Journal of the Statistical and Social Inquiry Society of Ireland Vol. XXXI
EVALUATING METHODS FOR SHORT TO MEDIUM TERM COUNTY POPULATION FORECASTING
EDGAR MORGENROTH
Economic and Social Research Institute (read before the Society, 7 March 2001)
________________________________________________________
Abstract:Public services provision and land use planning are crucially dependent on accurate population forecasts. Despite their importance, particularly for planning at the local level, population forecasts for Irish counties are not readily available. A number of different methods could be used to calculate such forecasts, but it is not clear which of these possible methods produces the most accurate forecasts. This paper assesses the data requirements and methodology involved in the implementation of the various techniques, and evaluates the forecasting performance of a number of different methods in terms of the forecast error associated with each method over the period 1991 to 1996. The results of this paper show that simple share extrapolation techniques perform well compared with the more elaborate cohort component model that is widely used for national projections.
____________________________________________________________________
Keywords:Population forecasts, share extrapolation, cohort component model.
JEL Classifications:J11, R23.
1. INTRODUCTION
Public services provision and land use planning are crucially dependent on accurate population forecasts. Such forecasts are particularly important at the local (county) level, where they should determine planning decisions such as the provision of water and sewerage facilities, schools, hospitals etc. As such, one would expect such forecasts to be produced on a regular basis and be readily available. However, this is not the case and rigorous county population projections are produced rarely and only for a few counties (e.g. Morgenroth, 2001, Brady Shipman Martin, 1999). In contrast, national forecasts are produced regularly by the CSO (Central Statistics Office, 1988, 1995, 1999) and more recently the CSO has published regional projections (Central Statistics Office, 2001).
produces the most accurate forecasts. Furthermore, issues of ease of implementation and data requirements of these methods have not been examined in the Irish context.
The lack of county population projections may also be due to the fact that they are likely to be subject to substantial error. This arises since population trends are at least in part dependent on future policies, such as the zoning of land. Since such policies are not known in advance, but may significantly impact on the dynamics of the population in small areas such as counties, it is difficult to precisely predict population changes in the future. This increases the forecast error, particularly if the forecast horizon is very long. As a result it is not advisable to project too far into the future and hence the focus of this paper is on the short to medium term. Nevertheless, the forecasting methods tend to use current trends which assume no significant changes to policy. Thus, if major policy changes occur the outcome regarding population is likely to be different than that predicted.
This paper will outline in detail the data requirements and methodology involved in the implementation of the various techniques, and will then evaluate the forecasting performance of the different methods, in terms of the forecast error associated with each method when applied to projecting county populations from 1991 to 1996. In doing so, the paper will for the first time apply such a large set of techniques to forecast Irish county population. Crucially, it will provide a more comprehensive evaluation of the various methods than has hitherto been available, since other papers on the evaluation of population forecasts have used a more restrictive set of methods (e.g. Smith, 1987), or were conducted in relation to population forecasts of larger spatial units (e.g. Smith and Sinicich, 1992). This paper is thus not concerned with explaining historical population trends for Irish counties, which was the subject of a paper by Walsh (2000), neither is it concerned with a detailed evaluation of recent trends in fertility or migration (see Fahey and Russel, 2001 on fertility and Punch and Finneran, 1999, Barrett, 1999 or Fitz Gerald and Kearney, 1999, on migration).
This paper is organised as follows. Chapter 2 describes in detail the different methods that will be utilised. Chapter 3 outlines data requirements and assumptions necessary to implement the various methods. Chapter 4 contains the projections for 1996 and a comparison of the projection accuracy of each method. Chapter 5 puts forward a set of county population projections utilising the most accurate method and, finally, chapter 6 summarises the main findings and highlights areas for future research.
2. ALTERNATIVE PROJECTION METHODS
counties1. Furthermore, the construction of a structural econometric model of Irish county populations, which would incorporate internal and external migration and fertility, is beyond the scope of this paper.
2.1 Cohort Component/Life Table
At the national level, the most widely used projection method is probably the cohort component/life table method. This involves disaggregating the Census data by cohort and then moving these cohorts along their life cycle. Thus, deaths are subtracted from each cohort according to mortality rates from the life table. The mortality rates can be adjusted for expected improvement in life expectancy. Births are calculated on the basis of age specific fertility rates and these are subject to infant mortality. Finally,
assumptions need to be made about migration, both internal and external.2 This method
is thus based on the fundamental balancing equation of population growth which defines population growth as the result of births minus deaths plus net migration for each county, which is defined as follows:
) ( )
( i i i i
i B D I E
g (1)
where: gi denotes the increase in the population of countyi;
Bi denotes the number of births in the county;
Di denotes the number of deaths in the county;
Ii denotes the number of immigrants into the county;
Ei denotes the number of emigrants out of the county.
The first term in parenthesis thus defines the natural increase of the population and the second term in parenthesis defines net migration into the county. Clearly, the latter incorporates both internal migration in the country and external migration to and from other countries.
The population at a particular point in time, say period 1, is thus equal to the population in the base period 0 plus the net increase in the population between the base period and period 1:
i i i P g
P1 0 (2)
Projections are then constructed by assuming or estimating numbers of births deaths and migration.
yields detailed results not only of the total size of the population but also of the gender balance, age balance, number of deaths and number of births.
2.2 Simple Trend Extrapolation
A simpler method of projecting county populations is the trend extrapolation method (Smith and Sincich, 1992). This involves identifying the trend of the total population or the share of the national population of a county, which is then used to project the population forward, assuming that this trend is stable up to the projection horizon. Clearly, this again is a strong assumption which may not hold in practice, particularly if developments take place that cause a structural break in the evolution of the population e.g. an economic crisis that leads to large scale emigration.
In order to outline these techniques it is useful to first define the relevant variables that
are used. The projected total population is denotedPif where i denotes the county. In
order to identify the trend, data is required for two points in time between which the
trend is measured. This period is denoted the base period, which coversy years and the
projection horizonx years. At the start of the base period, a populationPi0 is observed
and then, at the end of this period, a population Pi1 is observed. Using these two
variables, the average annual growth rate between the start and the finish of the base
period,r, can be calculated. Using this notation, two simple extrapolation techniques,
namely linear (LINE) and exponential (EXPO) extrapolation, can be defined as follows:
Method 1:Linear extrapolation (LINE)
1 01 i i
i
if P P
y x P
P
(3)Method 2: Exponential extrapolation (EXPO)
rx P
Pif i1exp (4)
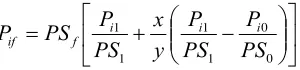
Another simple extrapolation method that makes use of existing national projections is the method of share extrapolation, where instead of the trend in the absolute size of the population, the trend in the share of the national population that resides in the county is used. In order to define the derivation of this method, three additional variables are required. First, since this method utilises existing national projections, let this be
denoted byPSf. Furthermore, the national population at the start of the base period is
PS0 and the total national population at the end of the base period is denotedPS1. The
Method 3: Shares of state population (SHARE)
» ¼ º «
¬ ª
¸¸ ¹ · ¨¨
© §
0 0 1 1 1
1
PS P PS
P y x PS
P PS
P i i i
f
if (5)
[image:5.505.173.323.97.132.2]The techniques described in this section are distinct from the cohort component/life table methods that are commonly used for national projections. The advantage of these simpler trend methods is that they require less data, which makes them particularly suitable for population projection at a spatially disaggregated level; data for some variables required for the cohort component method may not be available. Furthermore, they are easily implemented, yielding quick results. The disadvantage of these methods is that they use past trends to predict the future, whereas the cohort component model tracks individual cohorts on the basis of an assumed life expectancy.
2.3 Regression Based Extrapolation
A method that is closely related to the simple trend extrapolation methods described above is that of regression based share extrapolation (see for example Cantanese, 1972 and Klosterman, 1993). The distinguishing feature of this technique is that the projected share is generated using regression techniques which are applied to more than two data points. The use of these regression techniques results in a smoothing out of the estimated trend.
This technique involves estimating a regression model with the dependent variable being the share of the national population in a particular county and the independent variable is time. However, rather than simply assuming a linear functional form, a number of different functional forms are estimated and the one which fits best, say
according to theR2, is chosen. Of course, there are many possible functional forms,
including non-linear ones (see Cantanese, 1972 and Klosterman, 1993 for examples). Here, the focus is on functional forms that are either linear or that can be linearised. Specifically, the simple linear model, the power function/log-linear model and the exponential model are used. Adding a constant to the relationship described above, these are given as:
1. Linear
Si = Į + ȕT (6)
2. Log Linear (power function)
which can be linearised by taking logs to yield the following:
log Si = Į + ȕlogT (8)
3. Exponential
Si = ĮȕT (9)
which can again be linearised by taking logs to yield the following:
log Si = logĮ + (logȕ)T (10)
In all cases Į and ȕ need to be estimated, which is simplified through the choices of
these simple functional forms since these estimates can be easily obtained using standard Ordinary Least Squares (OLS) techniques. Once the different models have been estimated and the parameters from the best fitting regression recovered, these can be used to predict the share of the population in the future. Since the sum of these predicted shares is unlikely to be exactly 100, it is necessary to adjust the shares accordingly. Once this is done, the predicted national population can be allocated to each county according to these predicted shares, yielding county level population projections.
2.4 Correlated Indicators (Electoral Register)
The final method considered here uses data other than the Census data in order to apportion changes in the population. The main criterion for choosing such variables is that they must be highly correlated with the total population. For example, the electoral register that is updated annually can be used to estimate the population. In order to implement this method a similar approach to the regression based share extrapolation method can be used. However, this is applied to the ratio of people on the electoral register to the number of persons in the county, at the census dates. This ratio is then regressed on time, using the three functional forms outlined above. Again the functional form is chosen according to best fit and the parameters of this estimation are then used to project the ratio of electors to the population at a point in time. Then the population at that point in time can be estimated if the number of persons on the electoral register is known. This means that this method can not be used to project the population to a future date, but this method may nevertheless prove useful in providing estimates of the population in the intercensal period or before census figures are available. Of course, a lagged version of this method could be employed to provide actual forecasts, but this would require the estimation of a time series model with lags, which is not feasible with the available data since the periodicity is not constant.
3. DATA, ASSUMPTIONS AND CALCULATIONS
The previous chapter described the techniques that will be used to generate county population projections for 1996. In this chapter the data requirements and assumptions that are needed to construct the projections will be outlined and the projections will be generated.
Since the trend extrapolation methods are the simpler methods it is useful to start with these. They merely require data on county populations for at least two years in the case of the simple methods and for more than two years in the case of regression based techniques. This data can be easily obtained from the Census of Population, which has been carried out in Ireland since 1841. The last census preceding 1996 for which the projections are to be calculated was in 1991. It is then straightforward to estimate the trend in the case of the simple techniques. Of course, a choice has to be made regarding the starting point for the base period. The obvious choice is 1986, so that the trend is estimated over the 5 year intercensal period that immediately precedes the projection period. However, one may also take the view that a longer term trend might reflect better the evolution of the population, so that 1981 could also be used as the start for the base period.
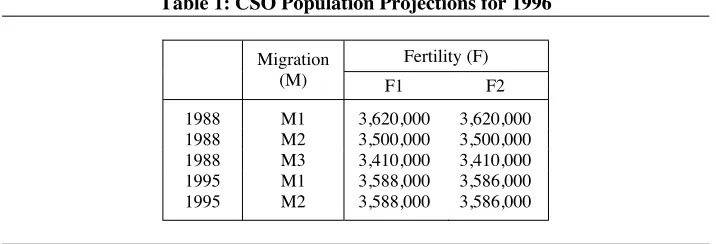
The SHARE and regression based techniques also require national level population projections from which the county populations can be obtained, once predicted population shares have been constructed. Here, two possible sets of projections are available, namely the CSO projections published in 1988 and those published in 1995 (see CSO 1988 and CSO 1995). In each case a number of different projections are put forward by the CSO reflecting different migration and fertility assumptions, which are denoted by M and F. These are shown in Table 1.
[image:7.505.75.433.457.579.2]The table shows that while there are ten different sets of assumptions, the projections for a number of these are the same, which means that only five different values are available to be used in the SHARE method and the regression based share extrapolation (REG).
Table 1: CSO Population Projections for 1996
Fertility (F) Migration
(M) F1 F2
1988 M1 3,620,000 3,620,000
1988 M2 3,500,000 3,500,000
1988 M3 3,410,000 3,410,000
1995 M1 3,588,000 3,586,000
1995 M2 3,588,000 3,586,000
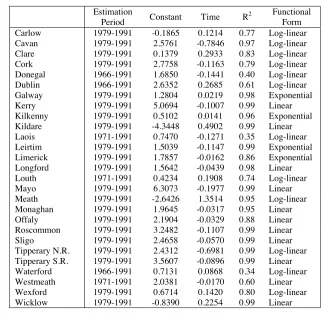
An important decision regarding the regression based share extrapolation method is the choice of time period over which to estimate the time trend. On the one hand a minimum number of observations is required for estimation, while on the other hand going back too far in time may give rise to estimates of the trend that bear no relationship with recent trends. The period that was chosen for the estimation was 1979 to 1991 (just 4 observations) which resulted in a good fit in most cases. However, for a few counties a slightly longer sample period was required to achieve a reasonable fit of the estimated relationship.
[image:8.505.88.413.280.595.2]The results of the regression for the best fitting functional form for each county are reported in Table 2. The table shows that in most cases the fit of the regression equation is extremely good. It also shows that no one functional form dominates in terms of best fit, which justifies the use of the three different functional forms. Furthermore, the estimated coefficients show that these differ quite substantially, with some counties having a positive trend while others have negative trend in the share of the national population.
Table 2: Regression Results for the Regression Based Share Extrapolation (REG) Estimation
Period Constant Time R
2 Functional Form
Carlow 1979-1991 -0.1865 0.1214 0.77 Log-linear
Cavan 1979-1991 2.5761 -0.7846 0.97 Log-linear
Clare 1979-1991 0.1379 0.2933 0.83 Log-linear
Cork 1979-1991 2.7758 -0.1163 0.79 Log-linear
Donegal 1966-1991 1.6850 -0.1441 0.40 Log-linear
Dublin 1966-1991 2.6352 0.2685 0.61 Log-linear
Galway 1979-1991 1.2804 0.0219 0.98 Exponential
Kerry 1979-1991 5.0694 -0.1007 0.99 Linear
Kilkenny 1979-1991 0.5102 0.0141 0.96 Exponential
Kildare 1979-1991 -4.3448 0.4902 0.99 Linear
Laois 1971-1991 0.7470 -0.1271 0.35 Log-linear
Leirtim 1979-1991 1.5039 -0.1147 0.99 Exponential Limerick 1979-1991 1.7857 -0.0162 0.86 Exponential
Longford 1979-1991 1.5642 -0.0439 0.98 Linear
Louth 1971-1991 0.4234 0.1908 0.74 Log-linear
Mayo 1979-1991 6.3073 -0.1977 0.99 Linear
Meath 1979-1991 -2.6426 1.3514 0.95 Log-linear
Monaghan 1979-1991 1.9645 -0.0317 0.95 Linear
Offaly 1979-1991 2.1904 -0.0329 0.88 Linear
Roscommon 1979-1991 3.2482 -0.1107 0.99 Linear
Sligo 1979-1991 2.4658 -0.0570 0.99 Linear
Tipperary N.R. 1979-1991 2.4312 -0.6981 0.99 Log-linear Tipperary S.R. 1979-1991 3.5607 -0.0896 0.99 Linear Waterford 1966-1991 0.7131 0.0868 0.34 Log-linear Westmeath 1971-1991 2.0381 -0.0170 0.60 Linear
Wexford 1979-1991 0.6714 0.1420 0.80 Log-linear
Wicklow 1979-1991 -0.8390 0.2254 0.99 Linear
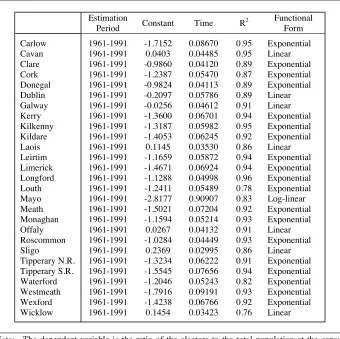
For the correlated indicators method, the number of persons on the electoral register is required (of course other variables could also be utilised). This can be obtained from the CSO Statistical Abstracts (various issues). Here the method is applied using data from 1961 to 1991. This is used to generate the ratio of electors to the population for each census year over that period. This ratio has been rising, reflecting the changing age structure of the Irish population. The regression results of the best fitting method are shown in Table 3. Again, the fit is generally very good indicating that the estimated relationships have a high within sample forecasting accuracy. Also notable is the positive estimated trend for all counties.
Table 3: Regression Results for the Correlated Indicators Extrapolation
Estimation
Period Constant Time R
2 Functional Form Carlow 1961-1991 -1.7152 0.08670 0.95 Exponential
Cavan 1961-1991 0.0403 0.04485 0.95 Linear
Clare 1961-1991 -0.9860 0.04120 0.89 Exponential
Cork 1961-1991 -1.2387 0.05470 0.87 Exponential
Donegal 1961-1991 -0.9824 0.04113 0.89 Exponential
Dublin 1961-1991 -0.2097 0.05786 0.89 Linear
Galway 1961-1991 -0.0256 0.04612 0.91 Linear
Kerry 1961-1991 -1.3600 0.06701 0.94 Exponential
Kilkenny 1961-1991 -1.3187 0.05982 0.95 Exponential Kildare 1961-1991 -1.4053 0.06245 0.92 Exponential
Laois 1961-1991 0.1145 0.03530 0.86 Linear
Leirtim 1961-1991 -1.1659 0.05872 0.94 Exponential Limerick 1961-1991 -1.4671 0.06924 0.94 Exponential Longford 1961-1991 -1.1288 0.04998 0.96 Exponential
Louth 1961-1991 -1.2411 0.05489 0.78 Exponential
Mayo 1961-1991 -2.8177 0.90907 0.83 Log-linear
Meath 1961-1991 -1.5021 0.07204 0.92 Exponential
Monaghan 1961-1991 -1.1594 0.05214 0.93 Exponential
Offaly 1961-1991 0.0267 0.04132 0.91 Linear
Roscommon 1961-1991 -1.0284 0.04449 0.93 Exponential
Sligo 1961-1991 0.2369 0.02995 0.86 Linear
Tipperary N.R. 1961-1991 -1.3234 0.06222 0.91 Exponential Tipperary S.R. 1961-1991 -1.5545 0.07656 0.94 Exponential Waterford 1961-1991 -1.2046 0.05243 0.82 Exponential Westmeath 1961-1991 -1.7916 0.09191 0.93 Exponential Wexford 1961-1991 -1.4238 0.06766 0.92 Exponential
Wicklow 1961-1991 0.1454 0.03423 0.76 Linear
Note: The dependent variable is the ratio of the electors to the total population at the census dates.
readily available from the Census. Secondly, survival rates are applied to each cohorts to reflect the number of deaths. These can be obtained from the CSO Life Tables. Here, Life Table No. 11, which was derived for the years 1985 to 1987 and which can be found in the CSO Statistical Abstract, is utilised. While there may well be differences in the survival rates between countries it assumed that these are equal across all counties. The third requirement are data regarding fertility. Here age specific fertility rates are applied to the female cohorts of child bearing age. These can be calculated using the data on births contained in the Report on Vital Statistics, 1991 and the number of females in the different age groups which is available from the Census. This yields one-year age-specific fertility rates that can easily be converted to 5-year rates. In contrast to the case of survivorships, these are allowed to vary between counties and county specific fertility rates are applied. Of course, fertility has been declining, so for the projections three different assumptions regarding fertility are applied. These are (1) the fertility rates of 1991 are applied unchanged (F1), (2) fertility rates that change at half the rate that applied between 1986 and 1991, and (3) fertility rates that continue to
change at the rate of change observed over the period 1986 to 1991.3 Applying the
rates to the cohorts of females of child bearing age yields the total number of births. Of course, not all children survive so that these births are subject to an infant mortality
rate which is calculated at 7.60651011 per 1000 births.4 Also, it is assumed that 51.4
per cent of births are male.5
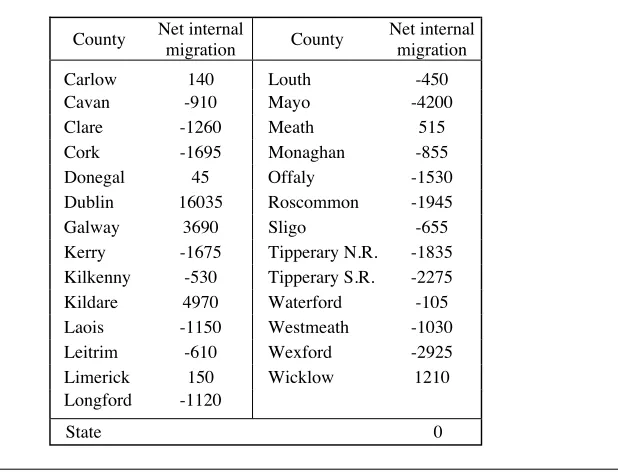
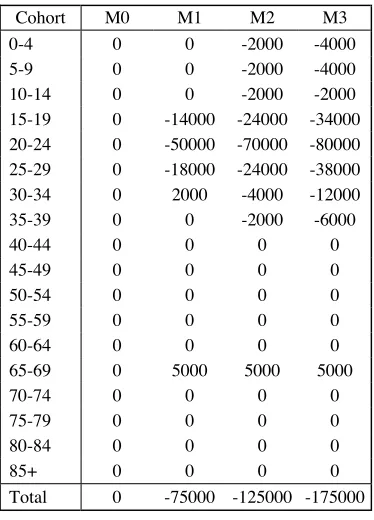
Finally, assumptions have to be made regarding migration, both internal and external. This is the most difficult aspect of the cohort component methodology; migration flows are influenced by economic conditions both at home and abroad, changes in attitude, and changes in policy which are not known in advance. These issues are particularly important for county population forecasting since an outflow of a relatively small number of people due to migration can be quite significant as a percentage of the total population in that county. With regard to internal migration, figures are available from the census, in that it records the number of persons who were resident in a different county one year previous. This allows net internal migration to be estimated for each county for a one year period. In the absence of other research that might suggest the trend in these migration figures it is convenient to assume that these absolute numbers
are constant over the following 5 year period and these are set out in Table 4.6In order
Table 4: Assumed Net Internal Migration 1991-1996
County Net internal
migration County
Net internal migration
Carlow 140 Louth -450
Cavan -910 Mayo -4200
Clare -1260 Meath 515
Cork -1695 Monaghan -855
Donegal 45 Offaly -1530
Dublin 16035 Roscommon -1945
Galway 3690 Sligo -655
Kerry -1675 Tipperary N.R. -1835 Kilkenny -530 Tipperary S.R. -2275
Kildare 4970 Waterford -105
Laois -1150 Westmeath -1030
Leitrim -610 Wexford -2925
Limerick 150 Wicklow 1210
Longford -1120
State 0
Table 5: Assumed Net International Migration for the State, 1991-1996
Cohort M0 M1 M2 M3
0-4 0 0 -2000 -4000
5-9 0 0 -2000 -4000
10-14 0 0 -2000 -2000
15-19 0 -14000 -24000 -34000
20-24 0 -50000 -70000 -80000
25-29 0 -18000 -24000 -38000
30-34 0 2000 -4000 -12000
35-39 0 0 -2000 -6000
40-44 0 0 0 0
45-49 0 0 0 0
50-54 0 0 0 0
55-59 0 0 0 0
60-64 0 0 0 0
65-69 0 5000 5000 5000
70-74 0 0 0 0
75-79 0 0 0 0
80-84 0 0 0 0
85+ 0 0 0 0
Total 0 -75000 -125000 -175000
Note: M0 indicates zero net migration. The other numbers were taken from CSO, 1988: Population and Labour Force Projection: 1991 – 2021, Table J.
Clearly the assumption regarding internal and particularly international migration are important but unlikely to represent the actual pattern of migration over the period 1991-1996. Therefore, another migration assumption is added, namely that there is no net international migration (M0).
4. PROJECTIONS AND COMPARISON OF PROJECTION
PERFORMANCE
Having dealt with the derivation and data requirements for the different methods in the previous chapter, this chapter outlines the estimation results and deals with the main objective of this paper, which is to compare these with the actual population as enumerated by the 1996 Census of Population and to identify which is the most accurate method.
predictions used for the various trend extrapolation methods, which is to a great extend explained by deviations of the actual migration patterns from the assumed ones.
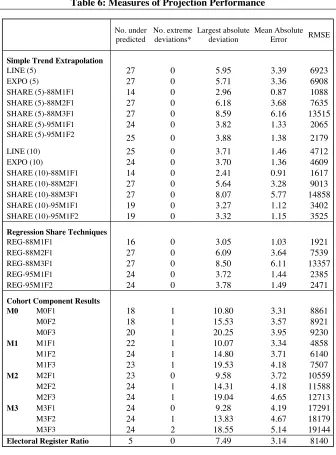
However, while it is clear that the predictions are not perfect and in most cases below the actual population of 1996, a more formal evaluation of the predictive performance of the different methods is needed. In order to accomplish this a number of measures are calculated. First, in order to identify whether a particular method is biased towards under or over predicting, the number of counties for which each method under predicts is counted. Second, the number of extreme deviations, that is deviation of more than 10 per cent from the actual figure recorded in 1996, are shown in the third column of that table. Clearly, if a method gives rise to many such extreme observations its results should be only cautiously used since, if used for planning purposes, such deviating projections could lead to a substantial misallocation of resources. The third measure, the largest absolute deviation, also refers to this type of deviation. Finally, the mean absolute deviation is a useful measure of the average accuracy of each projection method, as is the root means squared error (RMSE).
These indicators of predictive performance are found in Table 6. The first column of that table confirms that most methods underpredict in the majority of cases, with the exception of the correlated indicators (electoral register) method that overpredicts in a majority of cases. The second column provides important information in that only the cohort component method yields extreme deviations, as also confirmed by the third column which shows that these deviations are as large as 20 per cent. The simpler methods perform considerably better in this regard with the best performance achieved by the simple share method using 1988 M1F1 national projections. In this case, the largest deviation is just under 3 per cent.
Table 6: Measures of Projection Performance
No. under predicted
No. extreme deviations*
Largest absolute deviation
Mean Absolute Error RMSE
Simple Trend Extrapolation
LINE (5) 27 0 5.95 3.39 6923
EXPO (5) 27 0 5.71 3.36 6908
SHARE (5)-88M1F1 14 0 2.96 0.87 1088
SHARE (5)-88M2F1 27 0 6.18 3.68 7635
SHARE (5)-88M3F1 27 0 8.59 6.16 13515
SHARE (5)-95M1F1 24 0 3.82 1.33 2065
SHARE (5)-95M1F2 25 0 3.88 1.38 2179
LINE (10) 25 0 3.71 1.46 4712
EXPO (10) 24 0 3.70 1.36 4609
SHARE (10)-88M1F1 14 0 2.41 0.91 1617
SHARE (10)-88M2F1 27 0 5.64 3.28 9013
SHARE (10)-88M3F1 27 0 8.07 5.77 14858
SHARE (10)-95M1F1 19 0 3.27 1.12 3402
SHARE (10)-95M1F2 19 0 3.32 1.15 3525
Regression Share Techniques
REG-88M1F1 16 0 3.05 1.03 1921
REG-88M2F1 27 0 6.09 3.64 7539
REG-88M3F1 27 0 8.50 6.11 13357
REG-95M1F1 24 0 3.72 1.44 2385
REG-95M1F2 24 0 3.78 1.49 2471
Cohort Component Results
M0 M0F1 18 1 10.80 3.31 8861
M0F2 18 1 15.53 3.57 8921
M0F3 20 1 20.25 3.95 9230
M1 M1F1 22 1 10.07 3.34 4858
M1F2 24 1 14.80 3.71 6140
M1F3 23 1 19.53 4.18 7507
M2 M2F1 23 0 9.58 3.72 10559
M2F2 24 1 14.31 4.18 11588
M2F3 24 1 19.04 4.65 12713
M3 M3F1 24 0 9.28 4.19 17291
M3F2 24 1 13.83 4.67 18179
M3F3 24 2 18.55 5.14 19144
Electoral Register Ratio 5 0 7.49 3.14 8140
5. PROJECTIONS FOR 2001 AND 2006
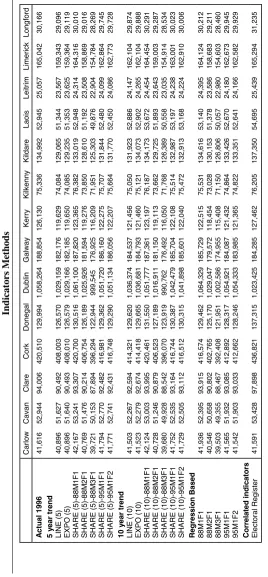
Having established the most accurate projection method, it is interesting to use this to produce real projections for the period from the last census (1996). Keeping with the 5-year intercensal interval, a 5-5-year projection involves the production of projections to 2001, which has of course passed. Thus, it is of more relevance to increase the projection horizon to 10 years, which of course increases the forecast error dramatically. The national projections that were published by the CSO in 1999 are used along with the SHARE method that performed best. Since it is not clear at this stage which of the projections provided by the CSO are the most accurate the whole set of projections is again used. The results are shown in Table 7.4.
Since these figures may be used for planning purposes, a brief comparison with the CSO projections of regional populations is in order (see CSO 2001). A number of interesting differences emerge. For example the results contained in this paper regarding the Dublin population are lower in all cases compared to the CSO projections. Overall these projections are larger then the CSO projections for the Mid-West, South-Mid-West, Mid-East, Border, Midlands and West regions but lower for Dublin and the South-East. They are therefore suggesting a somewhat different pattern of population change, with regions such as the Midlands not doing as badly as predicted by the CSO.
Table 7: Measures of Prediction Accuracy using the SHARE method to predict the 1996 county populations with for 5 and 10 year projection horizons
No. under predicted
No. extreme deviations*
Largest absolute deviation
Mean Absolute
Error
RMSE
Forecasting 5 Years ahead
SHARE (5)-88M1F1 14 0 2.96 0.87 1088
SHARE (5)-88M2F1 27 0 6.18 3.68 7635
SHARE (5)-88M3F1 27 0 8.59 6.16 13515
SHARE (5)-95M1F1 24 0 3.82 1.33 2065
SHARE (5)-95M1F2 25 0 3.88 1.38 2179
Forecasting 10 years ahead
SHARE (5)-88M1F1 9 0 7.54 2.18 7093
SHARE (5)-88M2F1 22 0 6.46 2.54 13807
SHARE (5)-88M3F1 25 0 8.87 4.69 19328
SHARE (5)-95M1F1 12 0 6.59 1.95 8726
SHARE (5)-95M1F2 13 0 6.53 1.95 8834
6. CONCLUSION
This paper has outlined a number of different population projection methods, and has applied these to predict the population for each county in 1996 in order to evaluate the predictive performance of each of these methods. These methods include the familiar cohort component method, simple extrapolation techniques, regression based share extrapolation and a correlated indicator method.
The results of the analysis yield a surprising result; namely, that the cohort component method performed relatively badly compared to the other methods, particularly the simple share extrapolation method. Of course, this could easily be attributed to the assumptions made in deriving the cohort component results. However, assumptions
need to be made in each method and it will not be known ex ante which set of
assumptions is correct. A researcher will always be faced with difficult choices regarding these assumptions. Furthermore, for the share extrapolation methods the assumptions are simple and do not require much research. The results found here, also concord with those found by Svanson and Beck (1994) which found particularly large absolute deviations for the cohort component method (up to 57 per cent).
Taking the most accurate method, i.e. the simple share extrapolation, projections of county populations for 2001 and 2006 were produced. These, while adding up to the same total (by construction) as those produced for regions by the CSO, nevertheless differ significantly in that Dublin and the South-East are projected to have a lower population in these years than was projected by the CSO.
Endnotes
1. While the data is available for all census years from 1841, the periodicity is not
constant i.e. the initial census years were 10 years apart, which reduced to 5 years but this series was broken since there was no census in 1976.
2. For national projections internal migration is irrelevant.
3. Details of the fertility rates can be obtained from the author.
4. This figure was derived from the CSO, 1996b: Report on Vital Statistics, 1991
5. Again this figure was derived from the CSO, 1996b: Report on Vital Statistics,
1991
6. There have been studies on migration in the past such as Hughes and Walsh, 1980,
7. APPENDIX
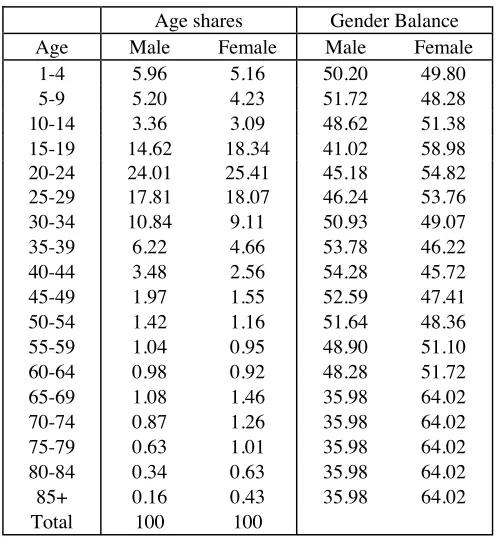
Table 7.1: Assumed Age and Gender Breakdown for Internal Migration, 1991- 1996
Age shares Gender Balance
Age Male Female Male Female
1-4 5.96 5.16 50.20 49.80
5-9 5.20 4.23 51.72 48.28
10-14 3.36 3.09 48.62 51.38
15-19 14.62 18.34 41.02 58.98 20-24 24.01 25.41 45.18 54.82 25-29 17.81 18.07 46.24 53.76 30-34 10.84 9.11 50.93 49.07
35-39 6.22 4.66 53.78 46.22
40-44 3.48 2.56 54.28 45.72
45-49 1.97 1.55 52.59 47.41
50-54 1.42 1.16 51.64 48.36
55-59 1.04 0.95 48.90 51.10
60-64 0.98 0.92 48.28 51.72
65-69 1.08 1.46 35.98 64.02
70-74 0.87 1.26 35.98 64.02
75-79 0.63 1.01 35.98 64.02
80-84 0.34 0.63 35.98 64.02
85+ 0.16 0.43 35.98 64.02
Total 100 100
Table 7. 3: C ounty P o p ulati on Projecti o ns for 1996 deri ved us ing the Cohor t Comp onen t Method (vari o us ass u mptions) Carlo w Ca v a n Clare Cork Done gal Dubli n Gal w a y
Actual 1996
41,616 52,944 94,006 420,510 129,994 1,058,264 188,854 M 1 F 1 42,130 52,203 89,846 412,589 131,808 1,045,289 188,139 M 1 F 2 41,752 51,921 89,297 410,395 131,023 1,042,319 187,151 M 1 F 3 41,375 51,638 88,748 408,201 130,239 1,039,350 186,164 M 2 F 1 41,670 52,378 89,539 408,505 132,362 1,009,260 185,577 M 2 F 2 41,292 52,095 88,990 406,311 131,578 1,006,291 184,589 M 2 F 3 40,915 51,813 88,441 404,117 130,793 1,003,321 183,601 M 3 F 1 41,210 52,552 89,232 404,422 132,917 973,231 183,014 M 3 F 2 40,832 52,270 88,683 402,227 132,132 970,262 182,026 M 3 F 3 40,455 51,987 88,134 400,033 131,348 967,292 181,039 Kerr y Kilken n y Kildare Laois Leitri m Limerick Lon gf ord
Actual 1996
Table 7. 3 (c on tinued ) Lou th Ma y o Meath Mona gha n Of fal y Rosco m m on Sligo
Actual 1996
92,166 111,524 109,732 51,313 59,117 51,975 55,821 M1F1 92,476 104,684 109,955 50,334 57,207 48,730 53,483 M1F2 92,076 104,233 109,385 50,028 56,863 48,582 53,160 M1F3 91,677 103,781 108,814 49,723 56,534 48,434 52,838 M2F1 92,279 105,559 109,581 50,161 57,368 49,072 52,879 M2F2 91,880 105,108 109,010 49,856 57,025 48,924 52,556 M2F3 91,480 104,656 108,440 49,550 56,696 48,776 52,234 M3F1 92,082 106,434 109,207 49,989 57,530 49,414 52,275 M3F2 91,683 105,983 108,636 49,683 57,186 49,266 51,952 M3F3 91,283 105,531 108,066 49,378 56,857 49,118 51,630 Tipp erar y N.R T ipp erar y S.R Waterfor d W estmea th Wexford Wicklo w State
Actual 1996
Table 7. 4 Pre dicted P o p u lation
for the ye
ars 2001 and
References
Barrett, A., 1999. “Irish Migration: Characteristics, Cause and Consequences”,IZA
Discussion Paper, No. 97, Bonn: Institute for the Study of Labour.
Brady Shipman Martin, Kirk McClure Morton, Fitzpatrick Associates and Colin
Buchanan and Partners, 1999. Strategic Planning Guidelines for the Greater Dublin
Area, Dublin: Department of the Environment and Local Government.
Cantanese, A., 1972. Scientific Methods of Urban Analysis, Aylesbury: Leonard Hill
Books.
Central Statistics Office, 1988. Population and Labour Force Projection: 1991 –
2021, Dublin: Stationery Office.
Central Statistics Office, 1995. Population and Labour Force Projection: 1996 –
2026, Dublin: Stationery Office.
Central Statistics Office, 1996a. Census 91, Volume 8 Usual Residence and
Migration, Dublin: Stationery Office.
Central Statistics Office, 1996b. Report on Vital Statistics, Dublin: Stationery Office.
Central Statistics Office, 1999. Population and Labour Force Projection: 2001 –
2031, Dublin: Stationery Office.
Central Statistics Office, 2001. Regional Population Projections: 2001-2031,
Statistical Release, Dublin: Central Statistics Office.
Fahey, T., and H. Russell, 2001. “Family Formation in Ireland: Trends, Data Needs
and Implications”ESRI Policy Research Series Paper, No. 43, Dublin: Economic and
Social Research Institute.
Fitz Gerald, J., and I. Kearney, 1999. “Migration and the Irish Labour Market”,ESRI
Working Paper, No. 113, Dublin: Economic and Social Research Institute.
Hughes, G., and B. Walsh, 1980. “Internal Migration Flows in Ireland and their
Determinants”.ESRI General Research Paper Series, No. 98. . Dublin: Economic and
Social Research Institute.
Klosterman, R. E., R. K. Brail and E.G. Bossard (eds.), 1993. Spreadsheet Models
Morgenroth, E., 2001. “Analysis of the Economic, Employment and Social Profile of
the Greater Dublin Region”, ESRI Books and Monographs Series Paper, Dublin:
Economic and Social Research Institute.
Punch, A. and C. Finneran, 1999. “The Demographic and Socio-Economic
Characteristics of Migrants, 1986-1996”, Journal of the Statistical and Social Inquiry
Society of Ireland. Vol. 27 (1), pp.213-252.
Sexton, J.J., B. Walsh, D. Hannan, and D. McMahon, 1991. “The Economic and
Social Implications of Emigrations”,NESC Report No. 90, Dublin: National Economic
and Social Council.
Smith, S. K., 1987. “Tests of Forecast Accuracy and Bias for County Population
Projections”,Journal of the American Statistical Association, Vol. 82 (400),
pp.991-1012.
Smith, S. K. and T. Sinicich, 1992. “Evaluating the Forecast Accuracy and Bias of
Alternative Population Projections for States”, International Journal of Forecasting,
Vol. 8, pp. 495-508.
Svanson, D., and D. Beck, 1994. “A New Short-Term County Population Projection
Method”,Journal of Economic and Social Measurement, Vol. 20, pp. 25-50.
Walsh, B., 2000. “Urbanisation and the Regional Distribution of Population in
DISCUSSION
Mr. Aidan Punch: Mr President, Ladies and Gentlemen, I welcome the opportunity of
proposing this vote of thanks to Edgar Morgenroth on his paper entitled “Evaluating Methods for Short to Medium Term County Population Forecasting”.
The paper uses a number of different methods to project the 1991 census figures at county level to 1996 and then compares the accuracy of these methods against the
actual 1996 census data to determine ex post the most accurate one. The methods
employed include:
1. linear and exponential extrapolation of recent county trends including
shift share analysis;
2. fitting regression lines to recent county data;
3. correlating with the register of electors at county level; and
4. the author’s own county projections for 1996 using the cohort
component method.
Table 6 of the paper then assesses the projection performance of these methods by examining the number of counties whose populations have been underpredicted as well as providing various measures of dispersion.
The main conclusion of the paper is that:
“The results of the analysis yield a surprising result; namely, that the cohort component method performed relatively badly compared to the other methods, particularly the simple share extrapolation method.”
although the author does allow that
“Of course, this could easily be attributed to the assumptions made in deriving the cohort component results”.
However, this conclusion is then left hanging. It is not clear whether the corollary ought to be that CSO, which as the audience will know, uses the cohort component method for official national and regional population projections, should abandon this approach forthwith and simply use shift share techniques in future. You will have detected from this provocative statement that I favour the cohort component approach to making population projections. But before singing its praises let us first look at the alternatives put forward.
1951 to 1961 trends we get largest absolute deviations of around 8 for LINE(5), EXPO(5), LINE(10) and EXPO(10) and mean absolute differences in the range 3 to 4. This could hardly be termed good in such a short run projection period, but then 1961 was a turning point in our population and the migration patterns evident in the fifties did not continue into the early sixties.
The SHARE method attempts to get the best of all worlds. On the one hand the changes in county shares from one census to the next are continued forward linearly, while on the other hand the resulting shares are then applied to exogenously determined national projections (which are invariably based on the dreaded cohort component method!). It’s not entirely clear whether the resulting deviations listed in Table 6, which find much favour with the author, are due to the benefits of shift share as a technique or to good national projections or indeed to a happy confluence of both.
It is of interest at this stage to briefly examine the accuracy of the quoted CSO national projections. The 1988 report used the 1986 census as the basis for the projections. Fertility fell at a faster rate than either F1 or F2 suggested, resulting in an actual TFR for 1996 of 1.89 against a projected 2.1 and 2.04, respectively. So births were overstated. The projected increase in life expectancy to 1996 was 2 years less than achieved (for both males and females) resulting in deaths being overstated. M1, M2 and M3 assumed average annual net outflows during 1986 to 1996 of 15,000, 25,000 and 32,500 respectively against an actual figure of 12,500. The result was that M1 projected a population of 3.62m compared with the measured population of 3.63m while M2 and M3 projected 3.5m and 3.41m, respectively. So M1 was fortuitously in the ball park because of the offsetting effects of births and deaths and because it assumed that average net outward migration would be 15,000 during each of the two sub-periods 1986 to 1991 and 1991 to 1996 although we now know that migration changed from high outwards to inwards during this period.
The 1995 report, which was based on the 1991 census, would be expected to accurately predict 1996 given its closeness in time. However, while fertility and mortality were accurate, the assumptions on migration were still largely outwards resulting in the population being understated.
Coming back to the SHARE performance in Table 6, the fact that the errors increase according as the national projections deviate from the actual outturn indicates that there is a scale factor at work and that the method is at the mercy of the national projections. It is therefore surprising to note that the author appears to favour it so much. Maybe it would be better to jettison the cohort component model entirely and marry the SHARE approach to the LINE(5) or LINE(10) approaches at national level. Perversely, this would give better results for LINE(5) but worse ones for LINE(10) in projecting to 1996 compared with the results obtained for the 1986 based M1F1 projections.
Turning to the method which fits regression lines through four data points and then calibrates the shares to 100 before applying them to the national projections, it strikes
purely mechanistic and underscores the absence of a coherent view on the interdependence of county populations.
The use of the Register of Electors data for population estimation suffers from a number of well-known drawbacks. The fact that its coverage only extends to those aged 18 years and over should have led the author to complement it using, say, the number of children for whom child benefit is paid, especially those up to age sixteen. Coverage of the register may also depend on whether an election is pending while there are well known county differentials. For instance, comparing the population aged 18 years and over in April 1996 with the register figures for February 1996 yields Register overestimates of 16 to 20 per cent for Donegal, Monaghan, Cavan, Meath and Leitrim while the population of the five county borough areas are all understated. In view of these shortcomings its use for current population estimates, let alone for population projections, is somewhat doubtful.
The last of the methods used is the author’s own projection of the 1996 county populations using 1991 as a basis and following the cohort component approach. It is not clear what function is served by using assumptions which are clearly known to be at variance with the actual outturn and then computing measures based on the derived population, such as largest absolute difference and mean absolute error, and then decrying them for showing large values – unless of course the intention is to say that an alternative method is superior!
So what has the cohort component method got going for it? A definite strength is that it forces us to take a stance on each of the factors influencing population change. Of course this is difficult but it means that we have to nail our colours to the mast on all the components. We have to take a view on fertility rates – whether at the national level they will continue to fall in line with the European experience and whether at a regional level we will see continued convergence. We have to pronounce on how quickly Ireland will converge towards the life expectancies of other European countries while observing that there is little variation at regional level within the State. More critically we have to pronounce on the magnitude and direction of migration flows – both internal and international. This has proved to be the most difficult component to predict in past projections and will doubtless continue to be so in future projections. In the final analysis, if our projections turn out to be wrong we can at least say which of the factors is at fault. In the alternatives examined in the paper we will not be able to explain away differences except to state that the overall population trends have not faithfully followed those which were experienced in the past.
In the final part of my intervention I want to address a number of points made in the paper relating to what the author calls “real” projections to 2001 and 2006. These projections are based on continuing the linear pattern of county population shares observed during 1991 to 1996 onwards to 2001 and 2006 and then applying the derived shares to the national projections produced by CSO. Based on his analysis of using five-year trends to project forwards five years and ten years to 1996 as outlined in Table 7, he advises that the projections for 2006 need to be interpreted cautiously. I would suggest that a more plausible reason for urging caution is that they are actual projections and not forecasts of the past and that the same uncertainty applies to them as to any projections.
A further point relates to a suggestion that the projected population for the Dublin region contained in the CSO regional projections is on the high side. This has also been
noted by others, including Garrett Fitzgerald in his weeklyIrish Times column. For the
purposes of analysis it is probably best to consider the Greater Dublin area versus the rest of the country. The former consists of the counties of Dublin, Meath, Kildare and Wicklow.
[image:30.505.76.434.373.549.2]In order to understand the divergence between the projected trend in the population of the GDA compared with its historical one it is necessary to look at the components of the changes. The average annual natural increase for the GDA has been less than that of the rest of the country up until 1991. In the projections, however, the differential age structure going forward (with a younger population in the East) will ensure that there are more births (despite the lower fertility rates) and fewer deaths. This is shown in Figure 1.
Figure 1: Average Annual Natural Increase (actual and projected M1F2)
-5000 0 5000 10000 15000 20000 25000
61-66 66-71 71-76 76-81 81-86 86-91 91-96 96-01 01-06 06-11 11-16 16-21 21-26 26-31
GDA Rest
-5000
0 5000 10000 15000 20000 25000
61-6
6
66-7
1
71-7
6
76-8
1
81-8
6
86-9
1
91-9
6
96-0
1
01-0
6
06-1
1
11-1
6
16-2
1
21-2
6
26-3
1
GDA Rest
did this while being fully aware of the trends emerging from the QNHS up to 1999 at the time. These trends, shown in Table 2, illustrate that there has been a turn around in internal migration to the Dublin area since 1997. However, the real question is whether these trends are a temporary aberration or whether they represent a long term reversal of well established trends. It should be borne in mind in this regard that the population estimates are themselves subject to change pending the results of the 2002 census (we should have the preliminary picture by county and sex in July).
Perhaps the CSO need not be too defensive of its projections. Without wishing to steal his thunder, tonight’s seconder of the vote of thanks, Dr Brian Hughes, in a paper prepared in Autumn 1999 put the population of the GDA in 2011 in the range 1.73 to 1.9 million with a greater likelihood that it would be at the higher end of that range. A paper commissioned by the Department of Environment and Local Government and prepared by consultants for the National Spatial Strategy had projections for 2010 in the range 1.75 to 2.03 million. By comparison CSO’s M1F2 variant for 2011 for the GDA is 1.8 million.
I want to conclude Mr President by complimenting Edgar Morgenroth for focusing our attention on the question of both county and regional population projections at a critical time for policymaking, given the importance of the National Spatial Strategy. I must admit however that it is not clear from his paper whether he seriously intends that some of his alternative trend based measures should actually be used at an official level for policy formulation.
Table 1: Census Internal Migration Matrices
Usual Residence 1 year previously Usual
Residence Border Dublin
Mid-East Midland Mid-West
South-East
South-West West Total 1996
Border 1265 634 319 188 171 189 797 3563
Dublin 1981 3623 1283 1670 2341 2059 1946 14903 Mid-East 619 5909 464 288 556 357 356 8549
Midland 288 775 512 280 324 190 419 2788
Mid-West 318 947 349 459 739 1406 779 4997 South-East 226 1475 757 369 876 722 270 4695 South-West 228 1157 321 211 1243 965 450 4575
West 887 1320 394 709 707 292 453 4762
Total 4547 12848 6590 3814 5252 5388 5376 5017 48832 Net = In - Out -984 2055 1959 -1026 -255 -693 -801 -255
1991
Border 994 495 233 144 152 138 679 2835
Dublin 1759 2598 1207 1429 2031 1653 1555 12232 Mid-East 482 3857 399 240 506 296 246 6026
Midland 150 552 367 258 252 120 338 2037
Mid-West 178 745 218 304 521 915 478 3359 South-East 177 999 492 236 517 588 224 3233 South-West 182 998 253 113 868 679 206 3299
West 594 880 264 511 492 231 263 3235
Total 3522 9025 4687 3003 3948 4372 3973 3726 36256 Net = In - Out -687 3207 1339 -966 -589 -1139 -674 -491
1986
Border 924 494 220 133 120 150 628 2669
Dublin 1892 2978 1109 1255 1847 1742 1433 12256 Mid-East 755 4079 377 220 481 285 233 6430
Midland 241 498 482 232 265 114 390 2223
Mid-West 224 738 280 368 499 915 465 3489 South-East 174 944 609 293 655 573 179 3427 South-West 189 920 274 169 808 745 237 3342
West 651 987 248 471 485 184 279 3305
Total 4126 9090 5365 3007 3788 4141 4059 3565 37141 Net = In - Out -1457 3166 1065 -784 -299 -714 -717 -260
1981
Border 1097 526 302 175 155 161 633 3049
Dublin 2149 2551 1274 1493 1990 1956 2114 13527 Mid-East 621 4074 449 277 620 326 293 6660
Midland 289 811 500 242 327 172 326 2667
Mid-West 292 1090 271 351 632 1007 515 4158 South-East 211 1133 562 283 533 696 170 3588 South-West 211 1215 312 184 751 811 258 3742
West 641 1103 229 398 403 215 238 3227
Table 2: QNHS Internal Migration for Regional Authorities
Year Border Dublin
Mid-East Midland Mid-West
South-East
South-West West State
2001 Out 4354 10341 2999 3314 1776 3367 2830 736 29717 In 2301 6233 5875 2037 3273 3835 1929 4234 29717 Net -2053 -4108 2876 -1277 1497 468 -901 3498 0
2000 Out 3997 12603 4018 3779 3066 4895 3067 863 36288 In 3136 6867 6720 3167 3719 4049 2588 6042 36288 Net -861 -5736 2702 -612 653 -846 -479 5179 0
1999 Out 3842 18763 6038 2810 4046 5326 4405 3435 48665 In 4008 10207 9822 3071 5116 6275 4513 5653 48665 Net 166 -8556 3784 261 1070 949 108 2218 0
1998 Out 3556 12447 4628 3028 3372 3382 3393 2854 36660 In 2156 9000 7004 2565 3820 4611 3279 4225 36660 Net -1400 -3447 2376 -463 448 1229 -114 1371 0
1997 Out 4224 16021 4323 2468 5842 4258 4676 3567 45379 In 1962 12359 13813 2751 3997 3095 2913 4489 45379 Net -2262 3662 9490 283 -1845 -1163 -1763 922 0
1996 Out 4028 7213 3656 1922 2510 3811 3154 3467 29761 In 1817 10260 4228 1473 2582 2873 2210 4318 29761 Net -2211 3047 572 -449 72 -938 -944 851 0
1995 Out 3054 6541 3526 2460 3315 3336 3879 4378 30489 In 1703 11810 4271 1467 3506 2458 3390 1884 30489 Net -1351 5269 745 -993 191 -878 -489 -2494 0
1994 Out 3487 7288 3927 2518 4041 3206 3050 3623 31140 In 2487 9577 4448 1334 2269 2948 3395 4682 31140 Net -1000 2289 521 -1184 -1772 -258 345 1059 0
1993 Out 3456 8003 2895 2864 4161 3497 2861 3384 31121 In 1292 8515 5328 1243 4443 3676 2651 3973 31121 Net -2164 512 2433 -1621 282 179 -210 589 0
1992 Out 4332 7235 3673 2799 3859 4137 3499 3734 33268 In 2856 11983 4985 950 3708 2274 2542 3970 33268 Net -1476 4748 1312 -1849 -151 -1863 -957 236 0
Out 3833 10646 3968 2796 3599 3922 3481 3004 35249 In 2372 9681 6649 2006 3643 3609 2941 4347 35249 Avg
92-01 Net -1461 -965 2681 -790 44 -313 -540 1343 0
Out 3995 14035 4401 3080 3620 4246 3674 2291 39342 In 2713 8933 8647 2718 3985 4373 3004 4929 39342 Avg
DISCUSSION
Brian Hughes: This important research paper by Edgar Morgenroth deals with an area
of knowledge shortfall often seen as a ‘black hole’ by developers, plants and policy strategists.
It comes at a time of fundamental structural change in the composition of Ireland’s demographic growth. Net inward migration has for the first time outpaced natural growth in the year to April 2001, as confirmed by CSO’s Population and Migration Estimates.
As a member of Dun Laoghaire – Rathdown Local Authority’s Economic Development and Planning Strategy Committee, I have commented in Council, on the Authority’s Housing Strategy 2001-2004, that their house-building target of 1,750 units per annum is believed to be substantially short of housing requirements. Thusfar, it has proved difficult to substantiate such a judgement in the absence of short-to-medium term county population forecasts, the absence of inter-censal county-by-county population forecasts and especially in the absence of inter-censal county-by-county migration data. Edgar’s field of research, in that it informs the formulation of robust methodologies will undoubtedly prove invaluable in terms of reinforcing such an argument.
In similar vein, together with Dr. Brendan Williams, Patrick Shields (who is in tonight’s audience) and Stephen Walsh, my Dublin Institute of Technology (DIT) colleagues and I, some time ago reported to the four Dublin Local Authorities on their Housing requirements. Therein it was concluded that the Capital’s housing market is suffering from a substantial shortfall of housing supply relative to total demand. There is a pressing need to converge to European household densities, especially given the dynamic of Natural Growth and Net Inward Migration.
DIT’s conclusions have centred on this shortfall and on its negative impact on sustainable development. In summary, the Open Market Value to Distance trade-off (as per the Alonzo Bid-Rent Model) is encouraging long-distance commuting patterns. Likewise, it is leading to the artificial growth in the fast-expanding dormitory towns in outer Leinster counties and to an increased Greater Dublin Area (GDA) Authorities’ responsibility to meet their Part V Social and Affordable Hosing obligations, under the 2000 Planning & Development Legislation.
The absence of migration data has in the past left research conclusions ‘hanging’, despite the seemingly conclusive evidence of the profound lack of affordability of GDA housing especially for first-time buyers, at least until the 2002 Census data outcome is to hand. Meanwhile the housing affordability and supply shortfall crisis deepens despite the ending of the ‘Celtic Tiger’ era.
to underestimate population projections when compared with the out-turn of the 1996 Census. The simple models appear to be more accurate!
Over the 1991-1996 period it was recorded that the Republic’s aggregate net inward
migration was only 2,000 compared to a natural growth of 98,000. This contrasts markedly with the position some five years later in April 2001. In this most recent period, natural growth of 109,000 was substantially matched by a figure of 104,000 for net inward migration. These profoundly changing components of Ireland’s demographic structure clearly point to the need to develop research methodologies so as to monitor and assess annual migration flows on a county-by-county basis and particularly to do so for the faster-growing seven counties of the Greater Dublin Area. Ultimately we should aim to provide an equivalent of the quarterly-published data for Natural growth, as outlined in Tables 7 and 10 of CSO’s Vital Statistics.
The Planning and Development professions, whose working relationship is becoming increasingly complementary rather than confrontational in both nature and in practice, require the same ‘comfort’ for migration data and trends as are now available for natural growth at the county level. This is needed particularly in the case of Dublin City Council, South Dublin and Dun Laoghaire – Rathdown given they comprise three of the four largest ‘county’ populations of the State.
Table 7.1 of the paper, ‘Assumed Net Internal Migration 1991-1996’, shows 8
counties to be the recipients of a total 26,755 internal in-migrants, as against 19
counties with a similar out-migration figure for that five-year period. It should be emphasised that as Dublin’s division into four Authorities only took place during the
1991-96 period, in this analysis it is recorded as just one county. Yet the Greater
Dublin Area accounts for almost 85% of the State’s total net internal migration. More pointedly, as can be seen from Table 7.1 the remaining four non-GDA counties (Carlow, Donegal, Galway and Limerick), in aggregate accounted for just 4,025 or 15% of the positive internal migration between 1991 and 1996.
For me, this analysis raises extreme curiosity as to what the respective county-by-county net internal migration flows might have been for the 1996-2001 period, in the light of the near 104,000 net total State inward Migration up to April 2001. The 2002 Census will be awaited with baited breath!
Thanks to the data sets kindly provided to me by Aidan Punch, I recently undertook some simple analysis of natural growth projections on a region-by-region basis, using the CSO’s central M1F2 projections out to 2031. In doing so, I am appreciative of Edgar’s view as to the limited merits of making any long-term demographic projections. Over the Christmas period, I had written to Aidan to enquire as to whether the population natural growth trend of the Rest of State of 4.5 per 1000 was a temporary aberration compared to the GDA’s 8.5 per 1000 rate?