Abstract—Natural hazard prediction has become an imperative domain for active researchers in recent years. This paper proposes a system model for Tsunami prediction by sensing and analysing both geophysical and bio-system parameters just before the Tsunami arrival. The proposed system model works on an integrated sensor network which sense 4 parameters in conjunction at particular timestamp: Magnetic Field, Tide level, consequent underwater Sea turtle count followed by the their navigation direction. The multiple parameters are evaluated on the basis of correlation coefficient using three supervised classification algorithms: Linear regression, decision tree learning and Logistic model trees to categorise the critical features from above mentioned and develop relation if any between both geophysical and bio-system parameters. We use an integrated dataset describing Unusual sea animal behavioural response to multiple geophysical factors related to tsunami Engineering. Correlation coefficient of a geophysical feature was 0.8 and 0.78 for bio-system feature during seismic year. This system model trained on a diverse dataset can be further trained on different animal dataset and can predict tsunami in real-time.
Keywords— TsunamiSensor,Geophysical,Biosystem Logistic model trees,Regression,Tsunami Detection, marine animal behaviour
I. INTRODUCTION
Seismic perturbations at both land and water sea bed have caused severe damage to life and property in past. There are several studies and frameworks that have been proposed and implemented as active research to predict such perturbations in real time in advance. These real time predictions will help generate alert situations consequently helping people to safely withstand these seismic disturbances. Current information shows that various public organizations along with ancient civilizations rely on recently proposed precursors to predict the upcoming hazards
.
These precursors can be categorized on the basis of range. Here range refers to the time of action these precursors require to generate an alert which can be categorized as moderately short range and extremely short range. Recent Analysis [1] shows that moderately short range precursor which observes few of geophysical one if supported by bio-system parameters: can be effectively used an integrated approach to predict these abnormal seismic disturbances.
Manuscript received December 08, 2016; revised Feb 11, 2017.
Nikita Jain is with Department of computer Science at Bhagwan Parshuram Institute of Technology and a part time research scholar at University school of Information, Communication and Technology affiliated to Guru Gobind
In December 2004, earthquakes along the Indian Ocean sea floor lead to a destructive Tsunami that claimed the life of thousand people. Scientists believe that nature do contain certain messengers: animals, plants ,wind who can generate alarm signals to mankind among which animals provided visible signals through their abnormal behavioral response [2].Amongst animals, marine animals do exhibit unusual underwater behavior which can be used to predict Seismic conditions by linking electric and magnetic sensory systems to geophysical underwater conditions[3].
In past 25 years Pacific Marine Environmental Laboratory (PMEL) has been monitoring bottom sea pressures and corresponding de-tided(after removing tidal effect) sea levels at various sites that now includes Indian Ocean as well.[4]
In current state of art, terrestrial animal reactions have been recorded in pre seismic time period for earthquake predictions. For similar seismic disturbances that hit underwater termed as Tsunami, there is a need for tracking and recording the aquatic animal response for real-time predictions [5]. In this paper a consolidated approach based system model is presented where both geophysical and animal behavior patterns sensed underwater contribute to tsunami predictions.
As discussed, we present an integrated system model to predict unusual seismic disturbances underwater with target site as Indian Ocean i.e Tsunami and generate alert signals interpreted from the messages formulated from the database server. To classify the alert and non-alert situations in specific timestamp, logistic model trees along with linear regression have been applied to the collected dataset.
Specific novel highlights of our paper are:
We present an integrated sensor system which predicts underwater seismic perturbations to generate alert based on both geophysical parameters and consequent unusual aquatic animal behaviour patterns near the coastline of Indian Ocean.
We apply Logistic Model Trees to the merged dataset collected for Indian Ocean and compare it with other classification methods such as Logistic Regression and decision tree learning. Using above comparison, critically dependent features amongst both geophysical and bio system for alert classification were established.
Feature Classification for Underwater Seismic
Prediction Using Wireless Sensor Nodes.
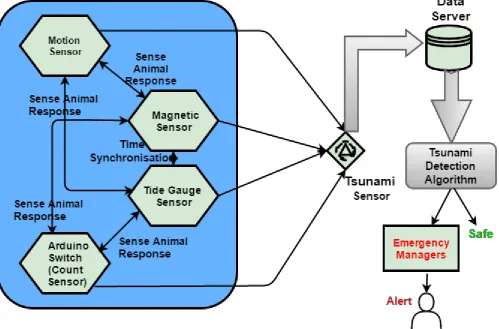
In this paper we propose a system implementing a framework in[5] :TsunamiSensor .This system consists of 4 sensors as shown in Fig 1 which work in combination to detect different features based values underwater in presence of specific seismic activity . These feature based values consists of both geophysical changes observed underwater along with the marine animal behavioral patterns characterized by the reactions they generate in response to these changed geophysical parameters in presence of the seismic actions..
Specifically the major contributions of the paper are as follows: Feature Identification: We inherit features from the
framework mentioned in [5] based on which data is extracted and analyzed for prediction signals.
Data Simulation: We do a detail search on the available datasets for both geophysical parameters and proposed (derived) behavioral patterns on Indian Ocean seismic prone sites.
Data Integration: The collected datasets were integrated on the basis of common timestamp i.e. year and date available.
Predictive System Model: We present a predictive system model implementing the predictive framework that works on combined features classified. The system model works on logistic model tree and regression classification to predict alert and non-alert situations.
This paper is structured as follows: Section II explores the present prediction systems or models for Tsunami and Earthquake formulating the necessity of sensor networks in coastal areas to detect tsunami. Section III describes the experimental setup of the system: TsunamiSensor. Followed by Section IV that presents the data collection and integration approach, Section V demonstrates the methodology and Analysis done for training and testing the prediction system. Section VI presents the results followed by Section VII that concludes the paper.
II. LITERATURE REVIEW
Natural disaster is an unfortunate event that results from environmental factors that injure people. Predicting such events well in advance has always been an open problem for researchers all over the world. Various factors have been explored in past to determine effective precursors.
Various studies have been proposed on prediction of earthquake one of the devastating natural disasters Earth has experienced in past. These studies have focused on physical and geographical features such as electromagnetic signals and radon gases as discussed in [7-8].
Anomalies such as unusual animal behavior have been considered another parameter for such seismic predictions. The basis for such parametric observations is based on pre seismic animal response [9]. Such responses have been recorded in terms of terrestrial animal reactions such as hearing range impairment, locomotive activities, nesting and breeding unusual patterns and migratory changes
Wireless Sensor Networks have been used in tsunami warning systems as they possess numerous advantages like online system reconfiguration, real time monitoring, easy distribution and their storage capacity [10]. The current state of art explores much on terrestrial animal behavior for earthquake prediction. The seismic perturbations underwater have been justified to be driven by aquatic animal behavior as explored in [6]. The authors have proposed a framework based on aquatic unusual animal behavior for predicting underwater seismic reactions in real time.
The tsunami related ocean flow can be described an unusual rise and fall in water level in form of short se waves. As discussed in previous section, we present a new system implementation based on framework proposed in [6] considering both geophysical i.e sea level and electromagnetic field intensity integrated with sea animal response here sea turtles tapped by sensors in terms of navigation and migration patterns.
III. TSUNAMISENSOR: SYSTEM DESCRIPTION The proposed system model - TsunamiSensor as shown in figure 1 consists of four major sensors categorised under Geophysical and Bio-system components. As discussed above both components can work in symbiotic association to provide effective Tsunami prediction.
This model system has bidirectional operated sensors where the geophysical sensors i.e. Magnetic and Tide gauge can sense their parameters and provide a two way feedback sensing the consequent sea animal response. The detailed description of the system is as follows:-
.
A. Magnetic Sensor
Seismic disturbances such as Tsunami are characterised by magnetic field disturbances. It is modelled in [11] that a secondary induced magnetic field was generated due to induced electric current by Tsunami Flow. Detection of such magnetic signals can be used as a precursor and thus used in the system model as shown in Fig 1
B. Motion Sensor
The motion sensor in the system proposed here is used tap direction of sea turtles(case here) in terms of latitude and longitude along the coast of Indian Ocean.
ISBN: 978-988-14047-3-2
C. Tide Gauge
Significant waveforms have been observed in past just before the actual Tsunami had hit ,by various tide gauge sensors deployed underwater such as in [4][12].Tide gauges provide valuable information about tsunami arrival times , and such sensors observe the changes in water level due to tsunami.
D. Count Sensor
Past experiments proposed that turtles when exposed to magnetic signals are drifted to off shore sites from breeding or nesting sites. Clearly this sensor is used to detect the number of turtles at a given location as tapped by other sensors discussed above. Sea turtle (loggerhead) navigation dataset in terms of latitude and longitude, nesting or animal count along with timestamp are obtained from [14] along Indian Ocean.
IV. DATASET: COLLECTION AND
INTEGRATION
In order to train and test the system model proposed in previous sections, we have used the available datasets across different public repositories. As mentioned in [13]
For the tide gauge data: Permanent service for Mean sea level [15] (PSMSL) which is global data bank for sea level change information
Clearly the two sets of data values so obtained tapped similar locations with large timestamp matching. Both datasets were integrated on the basis of common location tapped as latitude and longitude followed by the timestamp. Timestamp here mentioned comprised of year and date using which the two sets of data were merged. The integration here was performed using simple SQL queries where the missing and inappropriate
[image:3.596.41.541.340.669.2]data was filtered for further analysis.
The dataset here clearly depicts a timeline based analysis in terms of year and date of how sea turtle behavior has changed in response to varying magnetic field and sea level over past few years.
The data values here are merged for available years, however the analysis we show here comprises of a pre alert year 2003 followed by the tsunami year-2004 concluding for further
[image:4.596.62.536.115.699.2]years from 2008 till 2012.
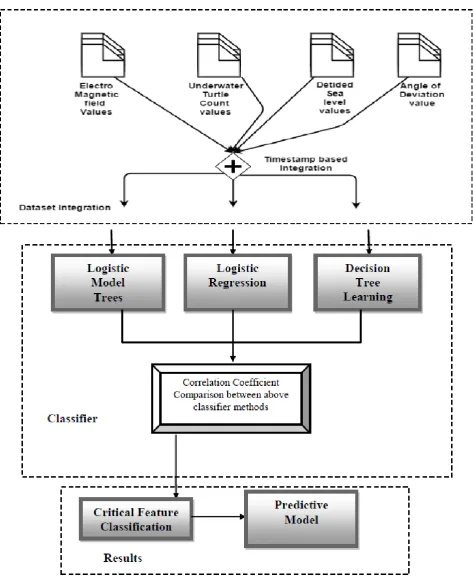
Fig 2 . Methodical Approach for formulating a predictive system model
ISBN: 978-988-14047-3-2
Year De- tided
Sea Level
Electromagnetic Field
Lat/Lon Sea turtle Count
2003 0.54 0.31 0.44 0.59
2004 0.71 0.29 0.46 0.67
2009 0.52 0.28 0.29 0.55
2012 0.51 32 0.22 0.58
V. METHODOLOGY AND ANALYSIS VI. RESULTS AND DISCUSSION In reference to the dataset obtained above, We define a class
variable as a numeric value 0 or 1.Here 0 is categorized as a safe state while 1 is an alert state. We have applied Logistic Model Trees on the above derived dataset and therefore compare it with other supervised learning classification methods such as Decision trees and Logistic Regression.
[image:5.596.311.554.185.365.2]The above mentioned supervised classification algorithms have implemented using the WEKA data mining suite [16].The task here is to categorize the critical features and the best analysis method which can be used by the system model for predictions in future. The predictive performances of all 3 classification method were compared on the basis of measure: correlation coefficient (r).Higher values of correlation justify a better correlation between given dependent variable and class variable .A detailed analysis is described below:
Table. 1 Correlation Coefficient analysis using Decision Trees
As stated above: Higher Correlation values define a tight correlation between the dependent and class variable. Here, the dependent variable is one of the features evaluated for the class variable alert or safe.
Clearly the correlation coefficients for the following two features depict the highest values for all three classification methods:-
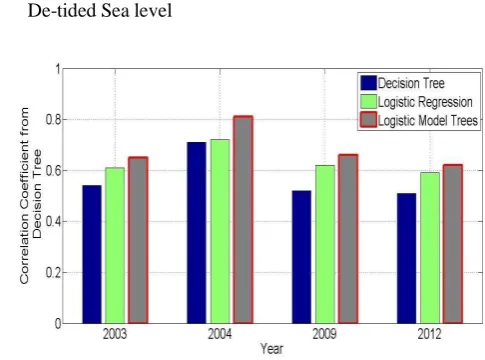
De-tided Sea level
Fig 3. Correlation Coefficient using Decision Trees
Sea Turtle Count
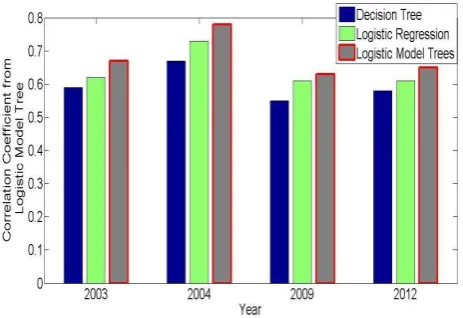
[image:5.596.31.283.477.613.2]Evidently Logistic model trees as discussed in previous sections outperforms the other 2 classification methods in terms of a better correlation coefficient analysis as shown in Table. 2 Correlation Coefficient analysis using Logistic Regression Figure 3,4 and 5 for de-tided sea level as a critical parameter.
Table. 3 Correlation Coefficient analysis using Logistic Model Trees
Year De- tided
Sea Level
Electromagnetic Field
Lat/Lon Sea turtle Count
2003 0.61 0.31 0.41 0.62
Fig 4 Correlation Coefficient analysis using Logistic Regression
We therefore propose logistic model trees as a classification technique for the system model discussed in section III that can be used to predict underwater seismic disturbances.
In order to validate the predictor model as proposed in section
Year De-tided Sea Level
Electromagnetic Field
Lat/Lon Sea Turtle Count
2003 0.65 0.34 0.48 0.67
2004 0.81 0.40 0.56 0.78
2009 0.66 0.38 0.21 0.63
[image:5.596.314.554.479.633.2]Fig 5 Correlation Coefficient analysis using Logistic Model Trees
It is important to note that validation was applied using the highly correlated features as formulated before. The performance here was measured in terms of Root mean Square error which measures the discrepancy.
data for pre tsunami days before Tsunami of Dec,24 2004 has been evaluated. The root mean square error for the critical features comes out to be 15432 whereas 14356 for de-tided sea level and sea turtle underwater count 24 hours before the tsunami arrival while the values are higher for Dec,24 itself.
VIII. REFERENCES
[1] Rikitake, Tsuneji. "Biosystem behaviour as an earthquake precursor." Tectonophysics 51.1 (1978): 1-20.
[2] Tiwari, Richa, and Sudhanshu Tiwari. "Animals: a natural messenger for disasters." J Nat Prod 4 (2011): 03-04.
[3]Kirschvink, Joseph L. "Earthquake prediction by animals: Evolution and sensory perception." Bulletin of the Seismological Society of America 90.2 (2000): 312-323
Table. 4 Root mean square Error for highly correlated feature
Table 4 shows the RMSE calculated for a 3 day period just before the Tsunami had hit Indian Ocean. An increase in discrepancy is signified by a probable seismic activity.
VII. CONCLUSION
Tsunami prediction is a social imperative and a need to develop real-time prediction system has become vital for scientists. In this paper we present a homogenous system model sensing both physical as well as natural responses in terms of animal behavior to predict tsunami by identifying anomalies in the same. Clearly, using this system critical and highly correlated features have been categorized by evaluating the system model under various classification schemes. De- tided sea level with correlation 0.81 and turtle migration patterns with correlation 0.78 tapped here in terms of nesting site count underwater have been identified as vital features for tsunami prediction as compared to other features. Also, in identifying these as two critical features, logistic model trees accounts to be the most effective classification scheme for the prediction algorithm used by the system model proposed. To evaluate this model based on above critical feature and classification scheme identified,
[4] Meinig, Christian, et al. "Real-time deep-ocean tsunami measuring, monitoring, and reporting system: The noaa dart ii description and disclosure." Washington, DC: Oceans 2005 MTS/IEEE, 2005 [2006210211]. http:∥ nct r. p mel. noaa. gov/model. html (2005).
[5] Rajendran, A., and C. Mansiya. "Physico-chemical analysis of ground water samples of coastal areas of south Chennai in the post-Tsunami scenario." Ecotoxicology and environmental safety 121 (2015): 218-222. [6] Virmani, Deepali, and Nikita Jain. "Intelligent information retrieval for Tsunami detection using wireless sensor nodes." Advances in Computing, Communications and Informatics (ICACCI), 2016 International Conference on. IEEE, 2016.
[7] Hayakawa, M.; Hattori, K.; Ohta, K. Monitoring of ULF (Ultra-Low- Frequency) Geomagnetic Variations Associated with Earthquakes. Sensors 2007, 7, 1108–1122.
[8]Wattananikorn, K.; Kanaree, M.; Wiboolsake, S. Soil Gas Radon as an Earthquake Precursor:Some Considerations on Data Improvement. Radiat. Measur. 1998, 29, 593–598.
[9]Buskirk, R.E.; Frohlich, C.; Latham, G.V. Unusual Animal Behavior before Earthquakes: A Review of Possible Sensory Mechanisms. Rev. Geophys. 1981, 19, 247–270.
[10] Nayak, S., Kumar, T.: Indian tsunami warning system 2008. The International archives of the Photogrammetry, Remote Sensing and Spatial Information Sciences, pp.1501- 1506.
[11] Tatehata, Hidee, Hiroshi Ichihara, and Yozo Hamano. "Tsunami-induced magnetic fields detected at Chichijima Island before the arrival of the 2011 Tohoku earthquake tsunami." Earth, Planets and Space 67.1 (2015): 1-11. [12]Maeda, Takuto, et al. "Significant tsunami observed at ocean-bottom pressure gauges during the 2011 off the Pacific coast of Tohoku Earthquake." Earth, Planets and Space 63.7 (2011): 803-808.
[13] Nikita Jain and Virmani, Deepali ― Navigation based Decision Algorithm to generate Tsunami Alerts using Sensor Nodes‖ Energy Proceedia, Elsevier [14] Halpin, P.N., A.J. Read, E. Fujioka, B.D. Best, B. Donnelly, L.J. Hazen, C. Kot, K. Urian, E. LaBrecque, A. Dimatteo, J. Cleary, C. Good, L.B. Crowder, and K.D. Hyrenbach. 2009. OBIS-SEAMAP: The world data center for marine mammal, sea bird, and sea turtle distributions. Oceanography
22(2):104-115
[15] http://www.psmsl.org/data/obtaining/stations/1501.php [16] Witten, I.H., Frank, E., 1999. Data Mining: Practical Machine Learning Tools and Techniques with Java Implementations. Morgan Kaufmann, San Francisco
De-tided Sea Level
Sea Turtle Count
Date, Year
RMSE
RMSE
Dec 21,2004
15600
15200
Dec 22,2004
15200
15210
Dec 23,2004
15342
14356
Dec 24,2004
18700
17834
ISBN: 978-988-14047-3-2
[image:6.596.49.281.73.232.2]