A Neural Network Model Deployed in the Cloud
for Prediction of Network Traffic
Ramandeep Dhanoa and Waqar Haque
Abstract—A multi-step neural network based predictive model is developed and trained offline, deployed in the cloud for real-time scoring, and used to predict network traffic. The information is then used to avoid congestion from occurring in a distributed real-time environment. The model predicts network traffic with high accuracy under varying scenarios representing low, medium and high load conditions. The accuracy is consistently maintained both inside and outside training ranges of the selected parameters which impact congestion. The R-square value ranges between 89.8% and 95.7% across all loads. The results prove robustness of the proposed model and illustrate that it can capture fluctuations, handle spikes, and adapt to varying load conditions. The results are obtained in real-time and used for taking proactive measures.
Index Terms—network congestion; neural networks; predictive modeling; cloud computing
I. INTRODUCTION
REDICTIVE analytics plays a crucial role in better decision-making and improved quality outcomes. It has become an essential tool when incorporating advanced data analytics into business operations. By analyzing historical data, present scenarios and predicting events using statistical and mathematical techniques, organizations can make optimal decisions while becoming aware of uncertainty and risk within data. Various data mining methods [1] are used to extract meaningful information (patterns, trends and clusters) from data. In predictive analytics, developing a prediction model is the first phase, and mainly involves input preparation, data modeling, and result interpretation. The second and most important phase is the deployment of model, which enables the decision makers to use it for real applications [2]. Business users need data which is accurate, timely and easy to understand. Hence, the real-time scoring engine is needed for timely decisions leading to derivation of new business rules, if warranted. The deployment of predictive model is a complicated task because of its resource and time-consuming nature. For real-time applications, when results from the predictive model are delayed, they may be of no value because of the dynamically changing business rules. In this paper, we present a prediction model developed to predict network congestion using neural networks. Further,
Manuscript received March 01, 2016. This work was supported by a Discovery Grant from Natural Sciences and Engineering Research Council (NSERC) of Canada.
The authors are with Department of Computer Science, University of Northern British Columbia, Prince George BC Canada (phone: 250-960-6522; e-mail: {dhanoa, waqar.haque}@unbc.ca).
the process of model deployment on the cloud is explained. A distributed real-time simulator is chosen as the test-bed. In such an environment, every transaction attempts to complete its operations within the assigned time. However, when resource requirement surpasses the capacity of network, congestion occurs [3]. In a distributed network, congestion occurs if a network link has queued messages waiting to get processed thereby decreasing the quality of service.
II. RELATED WORK
Congestion control techniques using prediction algorithms are known to provide superior network performance. Various prediction models using time series, fuzzy logic, Kalman filters, and neural networks have been proposed in recent years. Of these, neural networks have been demonstrated to provide relatively better performance because of their sophisticated learning mechanism and complex computational capability.
Time series is an ordering of data noted at regular intervals of time, for example, monthly sales of a retail outlet. When using this concept, it is important to analyze each point’s correlation (measure of degree of association) with previous point in the series. In order to predict through time series, the stationary assumption, as measured by autocorrelation functions [4], should be satisfied to minimize the mean square error. Jung et al. [5] used an auto-regressive (AR) model to predict network congestion, which examines whether the predicted packets are greater than the given bandwidth, and updates the routing table accordingly. Zhou et al. [6] proposed a model which is a combination of linear time series ARIMA and non-linear time series GARCH [7] model. Three separate time scales have been used to predict the network traffic from one-step ahead to k-step ahead. It captures long as well as short-range dependence. The model was compared with FARIMA [8] to prove its efficiency.
Fuzzy logic scales the degree of congestion, rather than defining complete congestion. Xiang et al. [9] developed a fuzzy neural network to predict the arrival rate of traffic. If the queue length is estimated to overflow, encoding rate of the source is reduced by 25 percent of the current sending rate. Haught et al. [10] placed Kalman filters on network links to periodically record data such as queue size and current arrival rate. It then predicts the queue size at next interval based on the current and past queue lengths, and uses this information to control the arrival rate of packets.
in [13] to predict the buffer occupancy L-step ahead through multi-step neural network. It also estimates the resources required through Back-Propagation (BP) neural network which is then used by the source node to adjust the sent-out rate accordingly. Fan and Mars [12] predicted the video traffic by finite impulse response (FIR) neural network and controlled congestion by throttling the input arrival rate. Ogras and Marculescu [16] predicted the congestion on Network-on-Chip (NOC) and proposed a flow control algorithm to control the total number of packets in the network. Mohan et al. [17] have implemented two approaches to predict a congestion free path in the network. In the first approach, association rule mining and traditional artificial neural network are used. Association rule mining defines the constraints, rules and statements derived from the data. Neural network takes the input like packet drop, response time and node degree, and yields the congestion weight which is then used to determine the best path. The second approach is an improved version of the feed-forward neural network, called self-motivated functional link feed-forward neural network. The neural network was trained with additional inputs to give the best reliable path. A common drawback of the aforementioned work is that they reduce the input arrival rate, rather than proactively manage the congestion.
III. METHODOLOGY
The effectiveness and accuracy of the model is achieved in several steps. First the model is developed and validated – this process requires that inputs of neural network be specified; second, the model is deployed in the cloud for real-time scoring; finally, the results are used to take corrective actions, if necessary. For this work, we use a distributed real-time transaction processing simulator (DRTTPS) to analyze the performance of the model.
A. Determining Inputs of Neural Network Model
The inputs of the neural network model are determined by the parameters of the underlying application which, in our case, is a simulated distributed real-time transaction processing environment. DRTTPS provides the ability to add protocols in a modular fashion, and tweak parameters of interest using a highly interactive graphical user interface. Time is represented in a dimensionless manner using ticks (simulation clock) and events are created and inserted in a queue at discrete points in time. These events include sending messages, arrival and completion of transactions. The complete structure of the simulator is beyond the scope of this paper and can be found in [18].
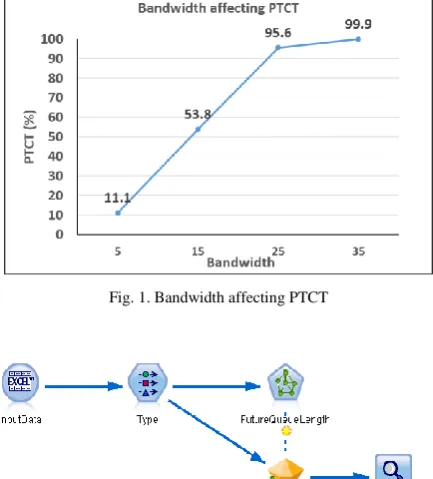
Our goal is to predict congestion in distributed networks and then take necessary corrective actions, if so warranted. The primary input parameters affecting congestion are determined by performing experiments with a broad range of values; these then become inputs of the neural network. Through experimentation, it was determined that the key parameters affecting congestion are bandwidth (5 to 35 message units/tick), max active transactions (10 to 50), update percentage (5 to 50%), latency (5 to 20 ticks) and work-size (2 to 10 pages). The input range for each parameter is chosen in a way that it shows observable results, for example, bandwidth shows a major impact on congestion within the
[image:2.595.318.535.140.380.2]range of 5 to 35 message units/tick (Fig. 1). The objective is to train the neural network with high, medium, low, and no congestion loads, based on a specified threshold. For each simulation run, input data is recorded periodically in a trace file.
Fig. 1. Bandwidth affecting PTCT
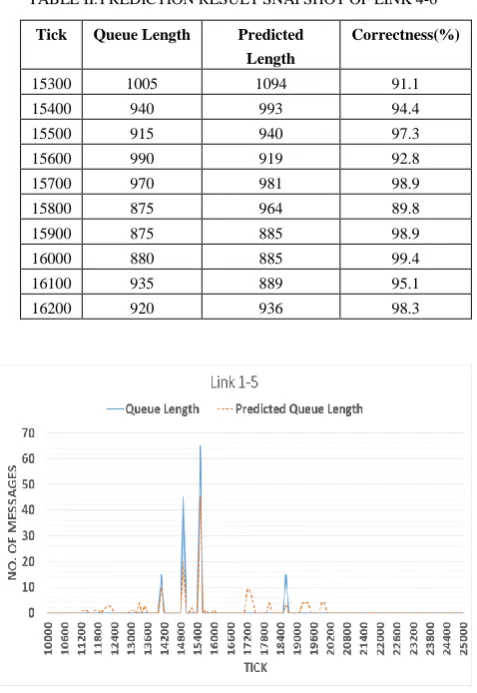
Fig. 2. Neural Network Model
B. Neural Network Model
The neural network model is developed in SPSS Modeler 16.0 [19]. Fig. 2 shows different types of nodes in the model, each node being representative of different functionality, as explained below:
InputData node is the worksheet source node, which imports data from the periodic Excel trace file. The neural network model is trained with 30 simulation runs under a range of congestion loads.
Type node specifies the role (input, target, or both) and format of input fields.
TABLE I. NEURAL NETWORK SETTINGS
Neural Network Parameter Value
Type Multilayer Perceptron Hidden Layers & Neurons Hidden layer 1: 10
Hidden layer 2: 5 Training Cycles 250 Overfit Prevention set (%) 50%
When the model completes its execution, a model nugget (diamond-shaped) is created. This nugget contains information (rules and equations) which is used for scoring and analysis of data. For instance, the summary view (Fig. 3) displays a quality chart showing the final accuracy of the model as defined by R-square value (92.7% for our model) [19]. The summary table provides an overview of the network architecture and other training parameters. Various other details of the model can be browsed through the nugget, for example, the predictive importance chart, which helps to identify the relative importance of each predictor (Fig. 4).
Finally, in the analysis node, training vs. actual outcome is analyzed to find the error. The statistical measure used here is square; higher the value of R-square, better is the prediction model.
Determining the architecture of neural network and related settings is an iterative process. After each training cycle, the results are analyzed to identify issues in the network settings and reconfigure the parameters (number of hidden layers and neurons), if necessary. This process is repeated until satisfactory results are achieved (R-square is above 90%).
C. Cloud Deployment
Once the model is trained, it is ready for deployment and use. In order to obtain real-time scoring, we have selected ADAPA (Adaptive Decision and Predictive Analytics) [2] scoring engine. It delivers cloud computing capabilities and open standards, which facilitate quick deployment by integrating with data mining platform (SPSS Modeler). ADAPA uses Predictive Model Markup Language (PMML) [20] to deploy models from data mining tools to the cloud. PMML is an XML-based language, which represents data mining models, business rules, input data, and data transformations. The steps involved in the deployment and use of the model are described below [2]:
Step 1: Prepare the model. Our neural network model is developed in SPSS Modeler which exports it in PMML format. Once the model is finalized, it is deployed on ADAPA so that real-time scoring can be done.
Step 2: Deploy model. Model is deployed directly by uploading PMML file on the ADAPA console which is an interface that allows user to upload models and rule-sets.
Step 3: Verify the model. After model deployment,
ADAPA results need to be verified. ADAPA
processes the uploaded data file (containing input data) and provides the predicted results in a new file, which can be downloaded and analyzed. If the results are identical to those from SPSS Modeler, the model is verified.
Step 4: Use the model. Once the model deployment
[image:3.595.316.538.238.467.2]is verified, it can be used for real-time scoring. The scoring can be done through ADAPA console or through XML-based web service. ADAPA web service uses Java Data Mining (JDM) standard to process the models defined in PMML [2]. Web service properties are configured in Web Service Description Language (WSDL) file, defined by JDM standard.
Fig.3. Neural Network Model Summary View
Fig. 4. Predictive Importance Chart
In summary, a user can create the predictive model, for instance, in SPSS Modeler, export it as a PMML file, and upload it to the ADAPA user interface. The embedded Java code then makes web service calls to ADAPA and obtains scores in real-time.
[image:3.595.317.548.494.668.2]and the default source code files generated, the instance is never terminated. ADAPA provides a development kit with sample programs to assist with sending data in an acceptable format and obtain the predicted values.
IV. EXPERIMENTS AND RESULTS
The network topology can play an important role in congestion. For this research, we chose the hypercube network as the underlying topology because of its superior topological characteristics which include small diameter (communication delays are less when network’s diameter is small), high connectivity, simple routing, and fault tolerance [21]. The results presented in this section are for a 3-dimensional (8 nodes) hypercube. Since links are bi-directional in nature, the total number of links in the topology are 24. For example, there are two links between nodes 0 and 1 (bi-directional), link outgoing from Node 0 and Node 1 is named as Link 0-1 and vice versa. Each link may have different congestion load, depending on its attributes (bandwidth and latency) and node’s workload (each node has different inter-arrival rate). For each experiment, the baseline parameters were fixed and neural network inputs were varied to create different congestion loads.
A. Testing with non-trained parameters, but within the trained input range
In this set of experiments, accuracy of the neural network model is tested with non-trained parameter values which lie within the trained input ranges. The simulation runs chosen to test the accuracy of the model represent different congestion loads.
1) Experiment A1 – High Congestion Load:
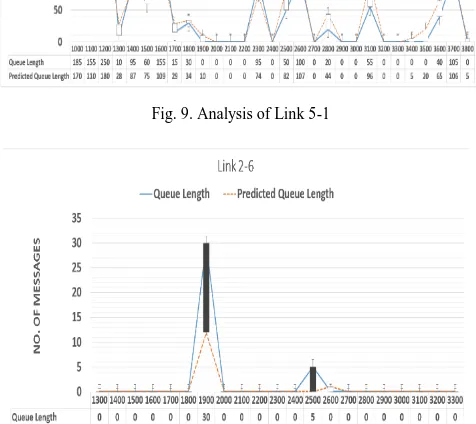
Initially, the model is tested with a simulation run depicting high congestion (Bandwidth – 5, Update percentage – 10%, and maximum active transactions, MAT 50). It is a highly congested scenario because of the low bandwidth. The accuracy, that is, R-square of the run is 95.7%. To demonstrate the model’s performance, only one representative link is selected for each load. An example of a link experiencing high congestion is Link 4-6. As shown in Fig. 5, approximately 1000-2000 messages are queued on this link which could take 200 to 400 ticks to clear the queue, thus representing high congestion. As illustrated, the prediction model has shown very promising results in predicting the congestion for such highly congested scenario. For more explicit comparison, the snapshot of predicted results for selected 1000 ticks is shown in Table II. The model’s correctness for the selected ticks is always above 90% (out of 10 cases, 6 have above 95% correctness).
2) Experiment A2 – Negligible Congestion Load:
In order to observe the behaviour under minimal congestion, the model was analyzed with the simulations runs representing negligible/no congestion load. The accuracy (R-square) of the run is 91.0%. Links 1-5 (Fig. 6) and 7-5 (Fig. 7) have 0 messages in the queue (no congestion), and insignificant fluctuations. This pattern is successfully recognized by our prediction model. At tick 15,500, Link 1-5 has 65 queued messages whereas our
[image:4.595.308.549.135.307.2]model predicted 45 messages. Even though the number of queued messages is significantly higher than the mean value (approximately 0), the model is still able to predict this spike with reasonable accuracy (70%). Similarly, at tick 14,600, Link 7-5 has 10 queued messages, whereas the model predicted 8 messages (accuracy - 80%).
[image:4.595.311.550.352.699.2]Fig. 5. Analysis of Link 4-6
TABLE II.PREDICTION RESULT SNAPSHOT OF LINK 4-6
Tick Queue Length Predicted
Length
Correctness(%)
15300 1005 1094 91.1 15400 940 993 94.4 15500 915 940 97.3 15600 990 919 92.8 15700 970 981 98.9 15800 875 964 89.8 15900 875 885 98.9 16000 880 885 99.4 16100 935 889 95.1 16200 920 936 98.3
Fig. 7. Queue Length: Link 7-5
B. Testing with parameters outside the input training range
The experiments presented in this section use parameter values which fall outside the input training ranges. Recall, training range of MAT is 10 to 50 transactions, update percentage 5 to 50%, and bandwidth 5 to 30 message units/tick. Again, the simulation runs with different congestion loads are analyzed, but only one representative link from each set is presented here.
1) Experiment B1 – High Congestion Load:
In this experiment, high congestion load is created by setting MAT at 60, update percentage at 55, and bandwidth at 15. All the parameters are outside the input training range, except total bandwidth. It is because the goal here was to create high congestion scenario, which would not have been possible if bandwidth value was selected from outside the input training range. The accuracy (R-square) of the simulation run is 92.0%.
[image:5.595.307.548.340.510.2]An example of a link with high congestion load is shown in Fig. 8 for a duration of approximately 2000 ticks. The data error bars represent deviation of predicted value from the actual value. The dark gray bar indicates that the predicted value is smaller as compared to the actual value; whereas the white bar means that the predicted value is larger than the actual value. The maximum error in the displayed interval occurs at the 8100th tick (queue length – 1300 messages and predicted queue length – 1112 messages)
Fig. 8. Analysis of Link 4-6
2) Experiment B2 – Low Congestion Load:
In this experiment, the prediction model is tested with low congestion load, and the accuracy (R-square) of the run is 91.4%. This simulation run has fluctuating queue length (Fig. 9), for example - at tick 1200, the number of queued messages is 250 (high congestion load), then drops to 10 messages (low congestion load), and climbs to 95 messages (medium congestion load). The predicted result for the aforementioned example is 180 messages queued at tick 1200 (high congestion load), declines to 28 messages (low congestion load), and then climbs to 87 messages (medium congestion load). This indicates that our prediction model correctly captures the fluctuating congestion load scenarios in the hypercube network.
3) Experiment B3 – Negligible Congestion Load:
When tested with negligible congestion load, the accuracy (R-square) of the run is 89.8%. The highest outlier in the range exists at 1900th tick where the predicted and actual number of messages in the queue were 12 and 30, respectively (Fig 10); the remaining ticks show no congestion in general, and are predicted accurately by the model.
[image:5.595.307.545.438.650.2]Fig. 9. Analysis of Link 5-1
Fig. 10. Analysis of Link 2-6
C. Using the predictive scores
[image:5.595.47.290.576.750.2]congestion actually improves network performance. The results showed a remarkable improvement, but are beyond the scope of this paper.
V. CONCLUSION
In this paper, we have demonstrated how a neural network model can be developed and deployed in the cloud for real-time scoring, and using the results to proactively manage congestion in a distributed network. The neural network prediction model is developed in SPSS Modeler. The model is trained in an off-line mode for various congestion scenarios and then deployed in the cloud for real-time scoring. SPSS modeler exports a file in PMML format containing the neural network model; this file is uploaded on the ADAPA instance running on Amazon cloud. An ADAPA wrapper embedded in the simulator invokes the prediction model through web services and predicts network traffic in real-time. This information is then used to proactively re-route messages to avoid congestion from happening.
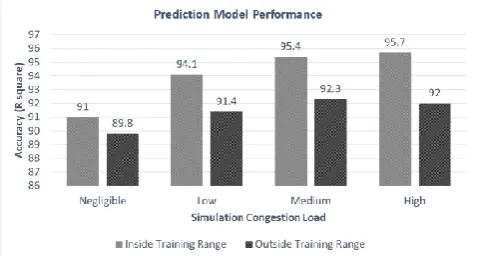
[image:6.595.48.289.446.574.2]The prediction model is tested using parameter values both inside and outside training ranges, and R-square is observed for each experiment (Fig. 11). From the testing set, it is noted that the maximum accuracy ranges from 91.0% (at negligible congestion) to 95.7% (at high congestion) when tested within the input training range. Outside of the training range, these values are 89.8% to 92.0%, respectively. From the analysis of various simulation runs with different congestion loads, it is concluded that our prediction model is robust because it can sense different congestion scenarios in a link, capture fluctuations, handle spikes, and adapt to varying load conditions.
Fig. 11. Performance of Prediction Model
REFERENCES
[1] O. Maimon and L. Rokach, Data Mining and Knowledge Discovery Handbook, Secaucus, NJ, USA: Springer-Verlag New York, Inc., 2005.
[2] A. Guazzelli, K. Stathatos and M. Zeller, "Efficient Deployment of Predictive Analytics Through Open Standards and Cloud Computing," SIGKDD Explor. Newsl., vol. 11, no. 1, pp. 32-38, Nov. 2009.
[3] M. Welzl, Network Congestion Control: Managing Internet Traffic (Wiley Series on Communications Networking Distributed Systems), John Wiley & Sons, 2005.
[4] T. H. Lai, "Time series analysis univariate and multivariate methods : William W.S. Wei, (Addison-Wesley, Reading, MA,
1990)," International Journal of Forecasting, vol. 7, pp. 389-390, 1991.
[5] S. Jung, C. Kim and Y. Chung, "A Prediction Method of Network Traffic Using Time Series Models," in Computational Science and Its Applications - ICCSA 2006, vol. 3982, Springer Berlin Heidelberg, 2006, pp. 234-243.
[6] B. Zhou, D. He and Z. Sun, "Traffic Modeling and Prediction using ARIMA/GARCH Model," in Modeling and Simulation Tools for Emerging Telecommunication Networks, Springer US, 2006, pp. 101-121.
[7] L. Bauwens, S. Laurent and J. V. K. Rombouts, "Multivariate GARCH models: a survey," Journal of Applied Econometrics, vol. 21, no. 1, 2006.
[8] J. Liu, Y. Shu, L. Zhang, F. Xue and O. Yang, "Traffic modeling based on FARIMA models," in Electrical and Computer Engineering, 1999 IEEE Canadian Conference, 1999.
[9] F. Xiang, H. Xiaoyan, J. Luo, J. Wu and G. Gu, "Fuzzy Neural Network Based Traffic Prediction and Congestion Control in High-Speed Networks.," J. Comput. Sci. Technol., vol. 15, no. 2, pp. 144-149, 2000.
[10] J. Haught, K. Hopkinson, N. Stuckey, M. Dop and A. Stirling, "A Kalman filter-based prediction system for better network context-awareness.," in Winter Simulation Conference, 2010.
[11] J. A. Bivens, B. K., M. J. Embrechts and B. K. Szymanski, "Network Congestion, Arbitration, And Source Problem Prediction Using Neural Networks," Smart Engineering System Design, vol. 4, pp. 243-252, 2002.
[12] Z. Fan and P. Mars, "Access flow control scheme for ATM networks using neural-network-based traffic prediction,"
Communications, IEE Proceedings-, vol. 144, no. 5, pp. 295-300, Oct 1997.
[13] Y. He, N. Xiong and Y. Yang, "Data Transmission Rate Control in Computer Networks Using Neural Predictive Networks.," in ISPA, 2004.
[14] Z. Liu, X. Guan and H. Wu, "Bandwidth Prediction and Congestion Control for ABR Traffic Based on Neural Networks.," in ISNN (2), 2006.
[15] M. Thottethodi, A. Lebeck and S. Mukherjee, "Self-tuned congestion control for multiprocessor networks," in High-Performance Computer Architecture, 2001. HPCA. The Seventh International Symposium on, 2001.
[16] U. Ogras and R. Marculescu, "Prediction-based flow control for network-on-chip traffic," in Design Automation Conference, 2006 43rd ACM/IEEE, 2006.
[17] B. Mohan, R. Sandeep and D. Sridharan, "A Data Mining Approach for Predicting Reliable Path for Congestion Free Routing Using Self-motivated Neural Network," in Software Engineering, Artificial Intelligence, Networking and Parallel/Distributed Computing, vol. 149, Springer Berlin Heidelberg, 2008, pp. 237-246.
[18] W. Haque and P. R. Stokes, "Simulation of a Complex Distributed Real-time Database System," in Proceedings of the 2007 Spring Simulation Multiconference - Volume 2, San Diego, CA, USA, 2007.
[19] IBM, "IBM SPSS Modeler 17 User's Guide," IBM, 1 August 2015. [Online]. Available:
ftp://public.dhe.ibm.com/software/analytics/spss/documentation/ modeler/17.0/en/ModelerUsersGuide.pdf. [Accessed 1 November 2015].
[20] Data Mining Group, PMML Version - 4.1. http://dmg.org/pmml/pmml-v4-1.html.