Quantitative Security Risk Evaluation using CVSS
Metrics by Estimation of Frequency and Maturity of
Exploit
Umesh Kumar Singh and Chanchala Joshi
Abstract-The evaluation of network risk is a vital task. It is an essential step in securing any network. This evaluation can help security professionals in making optimal decisions about how to design security countermeasures in order to improve security. This paper proposes a risk estimation model that uses vulnerability database National Institute of Standards and Technology (NIST) National Vulnerability Database (NVD) and the Common Vulnerability Scoring System (CVSS). The CVSS Risk Level Estimation Model estimates a security risk level from vulnerability information as a combination of period of exploitation and frequency of occurrence to estimates the impact derived from the CVSS. Proposed model provides quantitative security metrics that produces rapid and consistent security measurement which helps in automated and reasonable security management.
Index Terms
-
CVSS score, risk level, security measurement, vulnerability category.I.
I
NTRODUCTIONSECURITY risk management provides way to manage the growing threats to infrastructures or system. Vulnerability management has to be proactive and increasingly automated to ensure that vulnerabilities are assessed, prioritized and remediated speedily before they are located and exploited. The Common Vulnerability Scoring System allows to rate, compare and understand the importance of different vulnerabilities and thus to prioritize them. CVSS was first released for public use in 2004 with the goal of vulnerability prioritization [1]. CVSS allocates a severity score to each vulnerability. This score helps to measure the potential danger of the vulnerability for the organization in which it is detected. Calculation of CVSS score considers the intrinsic characteristics of vulnerability (Base vector), its evolution over time (Temporal vector) and security level of organization (Environmental vector). Each vector is composed of several
Manuscript received June 07, 2016; revised July 19, 2016. This work is financially supported by Madhya Pradesh Council of Science & Technology, Bhopal-India under R&D Project funding scheme.
Umesh Kumar Singh is with Vikram University, Ujjain(MP)-456010 India. Contacts- phone: 91 734 2512214; fax: 91 734 2514276; e-mail: [email protected].
Chanchala Joshi is currently Junior Research Fellow in MPCST funded Research Project in Institute of Computer Science, Vikram University, Ujjain(MP)-India. Contact:917342525306 e-mail: [email protected].
metrics which must be evaluated in order to compute corresponding CVSS score. All Base metrics must be included in CVSS score while Temporal and Environmental metrics are optional. This paper focuses on the part of CVSS score which concerns the duration of exploitation (Temporal vector) and the security level of the organization (Environmental vector). The objective is to analyze the impact ofTemporal vector and Environment vector on the CVSS score. The proposed methodology begins with the study of CVSS score of one of the vulnerability database National Vulnerability Database (NVD)[2] because these score represent the intrinsic characteristics of vulnerability (Base metrics). Then modified CVSS score is calculated by stimulating all possible values of environment metrics. Finally result is analyzed for security risk evaluation.
II. RELATED WORK
Tripathi & Singh in [3] proposed a security metrics to prioritize vulnerability categories based on CVSS scores. Tripathi & Singh in [4][5] discussed the security trade-off analysis to measure the risk level accurately. Tripathi & Singh in [6] evaluated vulnerabilities protection by calculating a metric based on a number of factors like the number of vulnerabilities present in the system, vulnerability discovery date and their exposure to the network and traffic patterns; and estimated risk level of NVD vulnerability categories based on vulnerability characteristics, distribution of vulnerability and age of vulnerability. Joshi & Singh in [7] evaluated the efficiency of web application vulnerability scanners by designing a vulnerable web application. Prominent taxonomies of attacks and vulnerability of computer system and network are reviewed by Joshi & Singh in [8] to improve vulnerability categorization. In [9], Joshi & Singh proposed an approach towards Standardization of Network and Computer Attack Taxonomies. Sawilla et al. [10] used two attributes from the CVSS for vulnerability prioritization under the perspective of attackers.
III. VULNERABILITY DATABASE
Vulnerability Scoring System (CVSS) standard. The CVE list [11] an initiative to standardize vulnerability references and gives vulnerabilities a name in the form CVE-YYYY-XXXX, where YYYY is the year in which the vulnerability is first reported. NVD is the combination of many other security databases allowing the fullest utilization of available public computer security risk analysis and quantification methods via CVSS scores [12]. NVD provides data for automated vulnerability management and security management. It records vulnerabilities since 1999, total 77060 vulnerabilities listed under CVE names till May 4, 2016 [13]. Using NVD’s information about the vulnerabilities, vulnerability signatures can be derived [14]. NVD provides a reputable, widely used, constantly updated, and openly available resource.
IV. COMMONVULNERABILITYSCORING
SYSTEM (CVSS)
The Common Vulnerability Scoring System (CVSS) is an open framework consists of three metric groups: Base, Temporal, and Environmental [15]. The Base group represents the intrinsic qualities of vulnerability, the Temporal group reflects the characteristics of a vulnerability that change over time, and the Environmental group represents the characteristics of a vulnerability that are unique to a user's environment. The Base metrics produce a score ranging from 0 to 10, which can then be modified by scoring the Temporal and Environmental metrics.
A. Metrics
The Base metric group represents the intrinsic characteristics of vulnerability that are constant over time and across user environments[15]. It is composed of two sets of metrics: the Exploitability metrics and the Impact metrics.The Base metric optionally can be combined with the Temporal metric which reflects the characteristics of a vulnerability that may change over time but not across user environments. That means it represents the dynamic behavior of vulnerability. The Environmental metric group represents the characteristics of vulnerability that are relevant and unique to a particular user's environment. These metrics allow the scoring analyst to incorporate security controls which may mitigate any consequences, as well as promote or demote the importance of a vulnerable system according to business risk.
B. Qualitative Severity Rating Scale
[image:2.595.314.554.577.717.2]For some purposes it is useful to have a textual representation of the numeric Base score. All scores can be mapped to the qualitative ratings defined in Table [15]:
TABLE I
QUALITATIVE SEVERITY RATING SCALE
Rating CVSS Score
None 0.0
Low 0.1 - 3.9 Medium 4.0 - 6.9 High 7.0 - 8.9 Critical 9.0 - 10.0
C. Standard Quantitative Risk Models
Ahmed et al.[18] proposed a framework for quantitative risk level measurement. The proposed model measure the security risk of a network on two critical risk aspects - the risk of having a successful attack and the risk of this attack being propagated within the network. Another prominent framework for risk level measurement is proposed by Tripathi et al. [3] that estimates risk level of NVD vulnerability categories based on vulnerability characteristics, distribution of vulnerability and age of vulnerability. We have, therefore, modeled our framework as a combination these two with the aid of Environmental factor. Tripathi & Singh in [3] introduced Temporal factor, considering age of vulnerability is a prominent factor that can impact security risk level. This paper is also considering the aging factor; however we redefine it as maturity of exploit. Equations for calculating Temporal score are also redefine in this paper with respect to availability of patch. With the addition of Temporal factor, this paper uses Environmental factor which contains the frequency of exploit in user’s environment. In proposed model Base score of CVSS is updated by applying temporal score and environmental score of vulnerability. The next section will describe the proposed improved quantitative security risk level estimation model in detail.
V. IMPROVEDQUANTITATIVESECURITYRISKLEVE
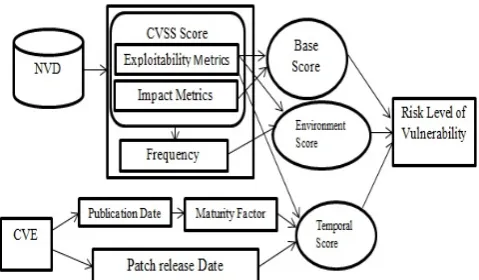
LESTIMATIONMODELUSING CVSS SCORE In security management quantifying security risk is a challenging task for securing the network proactively. However there are metrics exist to measure risk level of individual vulnerabilities [17] but to aggregate these risk values to evaluate risk level of host there is no standard matrix available. To evaluate risk level of host in a network (user’s environment) by aggregating risk levels of vulnerabilities (intrinsic properties of vulnerability), this paper converges the CVSS score with the maturity of exploit code with respect to remediation plan and frequency of exploit code. In figure1 the proposed Quantitative Security Risk Level Estimation Model is shown. In proposed model, risk level of vulnerability categories is estimated based on intrinsic characteristics of vulnerabilities, frequency of vulnerability and maturity of the vulnerability with respect to availability of patches.
In proposed model to define vulnerability characteristics, CVSS Base metrics: exploitability metrics and impact metrics are used. These two metrics groups in include three individual metric values in each, Attack Vector (AV), Attack Complexity (AC), Privileges Required (PR) and User Interaction(UI) are associated with Exploitability Metrics and Confidentiality Impact (C), Integrity Impact (I), Availability Impact (A) are associated with Impact Metrics. So, all these nine attributes are used to characterize vulnerability. Base value for vulnerability category risk level is evaluated from value of each of these attributes and frequency of vulnerabilities in various combinations of these attributes. To reflect change in risk level with time, temporal score is calculated. In proposed methodology Temporal score is calculated by convergence of maturity of vulnerability with availability of patches. Maturity score is determined by the date of emergence of vulnerability and availability of patches is discovered by Remediation Level (RL) vector of CVSS metrics. The more frequent occurrences of vulnerability makes system more risky; so by keeping this assumption the proposed model introduced a new dimension to the available standard Quantitative risk model, the Environmental metrics, which is used to estimate the frequency of vulnerability. The assumption behind frequency computation is that a highly exploitable vulnerability is more likely to be misused by attackers and consequently should have a higher frequency. Hence for frequency calculation Attack Vector (AV), Attack Complexity (AC) and Privileges Required(PR) attribute of Base Metrics of CVSS are used by which we can determine the exploitability of vulnerability. Frequency of vulnerability also depends on the time period of presence of vulnerability in the system, so the exploitability attributes are combined with temporal score for frequency estimation. For computation of risk level the base risk score is updated by applying temporal score and environmental score of vulnerability. This evaluated risk level value will be used in evaluation of severity of vulnerabilities.
A. Computations of risk level
The proposed Quantitative CVSS Risk Level Estimation Model follows four steps computational procedures:
Step 1: Computation of Base score using intrinsic properties of vulnerability by CVSS Base score equation.
Step 2: Computation of Temporal Score using maturity of exploit with respect to availability of patch.
Step 3: Estimation of frequency of vulnerabilities by Base Metrics, Temporal Metrics and Environment metrics of CVSS. Step 4: Calculate risk level from maturity and frequency estimates.
Computation of Base score in Step 1 involves the identification of both the vulnerabilities and capability of exploiting the vulnerabilities. CVSS Base score equations described in previous section’ IV C’ are used for the Base score computation. Computation of Temporal score involves two sub steps, at first maturity of exploit will be calculated by date of emergence of vulnerability, and then this maturity will be simulated by availability of patch. Availability of patch can be determined by Remediation Level (RL) and Report
Confidence (RC) factor of CVSS [15]. Attack Vector (AV), Attack Complexity (AC) and User Interaction (UC) attribute of Base Metrics of CVSS and Temporal score computed in step 2 are used for frequency estimation of vulnerability. Finally the risk level will be computed from Base score, Temporal score and frequency, computed in previous three steps. Estimation of frequency and computation of Temporal score is described briefly in the next section ‘V B’.
B. Enhancing CVSS by frequencyand maturity estimation
CVSS defines the severity of vulnerability. But the severity of a vulnerability depends not only on the intrinsic characteristics of vulnerability (i.e. Base score). Besides the CVSS scores there are many more factors that control the severity level of vulnerabilities, like remediation level of vulnerability, maturity of exploit code. With these vectors the risk level of vulnerability can be defined.
The maturity of vulnerability can be determined by the date of emergence of vulnerability, from NVD. This maturity score combines with availability of patches to further define the impact of vulnerability. Remediation Level (RL) vector of CVSS signifies the availability of patches. For estimation of risk level it is assumed that vulnerabilities that are discovered recently and have no patches available cause more security risks as compared to vulnerabilities that have patches available. Over the time user patch these vulnerabilities so with the time severity level of vulnerability decreases.
CVSS metric groups consist of a set of attributes, these attributes with Time score are used to estimate the frequency in Step 3 of the computational procedure specified in previous section. The assumption behind frequency computation is that a highly exploitable vulnerability is more likely to be misused by attackers and consequently should have a higher frequency. By considering the intrinsic exploitability factors of the vulnerability itself (i.e., the base metric attributes relevant to exploitability) and the temporal score; it is possible to calculate the exploitability frequency of vulnerability present in a system. The next subsection describes the estimation of maturity and frequency that aids in risk level estimation. 1. Estimation of temporal score
Temporal score of vulnerability is depending on two factors, availability of patches and maturity of exploit code. Maturity can be determined by emergence date of vulnerability, taken from NVD. Convergence of the maturity score with availability of patches, the impact of vulnerability can be defined. Considering these factors metric formulae are developed to evaluate temporal score for vulnerability. To calculate temporal score, vulnerabilities are divided into two categories, for which patches are not available, and for which those have patches available. We calculate Remediation Level in these two types separately and then Temporal Score will be calculated as
Temporal Score= BaseScore × (1/RemediationLevel) ×MaturityOfExploitCode
severity. Temporal score is based on the assumption that vulnerabilities that are discovered recently and have no patches available cause more security risks as compared to vulnerabilities that have patches available. Over the time user patch these vulnerabilities so with the time severity level of vulnerability decreases.
2. Estimation of frequency of vulnerability from CVSS metrics
[image:4.595.47.294.227.377.2]Attack Vector (AV), Attack Complexity (AC) and Privileges Required(PR) attribute of Base Metrics of CVSS and Temporal score computed in previous step are used for frequency estimation of vulnerability.
Figure 2: Frequency estimation from CVSS Base Metric and Temporal Score
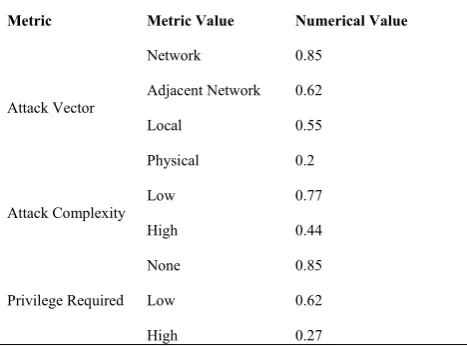
[image:4.595.42.276.469.642.2]CVSS metric groups consist of a set of attributes, these attributes with Time score are used to estimate the frequency. Following table summarizes the CVSS attributes relevant for the calculation of frequency estimate [15]:
TABLE II
CVSS ATTRIBUTE VALUES FOR FREQUENCY ESTIMATION
Metric Metric Value Numerical Value
Attack Vector
Network 0.85
Adjacent Network 0.62
Local 0.55
Physical 0.2
Attack Complexity
Low 0.77
High 0.44
Privilege Required
None 0.85
Low 0.62
High 0.27
The assumption behind frequency computation is that a highly exploitable vulnerability is more likely to be misused by attackers and consequently should have a higher frequency. By considering the intrinsic exploitability factors of the vulnerability itself (i.e., the base metric) and the temporal score; it is possible to calculate the exploitability frequency of vulnerability present in a system.
C. Risk level Computation Equation
As we have made an assumption that the more frequent occurrences of vulnerability makes system more risky; i.e. Risk level of the system also depends on the frequency of vulnerability. With this assumption the proposed Quantitative Risk Level Evaluation model converges frequency of vulnerability derived in the previous section with the CVSS score, for Risk Level estimation of the system. Therefore for risk level evaluation we sum up the frequency and CVSS Score of the vulnerability:
Risk Level = (Minimum [(CVSS Score + Frequency),10])
In proposed methodology we are considering the range of risk level in between 0.0 to 10.0. So if the sum of CVSS score and frequency is more than 10, then the value of risk level is taken as 10. For this we are applying minimum function to the proposed equation, that will return 10 if sum is more than 10.
VI. APPLYINGTHE PROPOSED MODEL ON TO THE
STANDARD CVSS SCORE FOR RISK LEVEL ESTIMATION
As described in Section ‘V- A’ Step 1 of the computational procedure of the CVSS Risk Level Estimation Model focuses on identifying intrinsic properties of vulnerabilities by Base score. We examined vulnerability databases NVD to check for recently released vulnerabilities. The Step 1 activity resulted in more than 20 potential vulnerabilities published during April to July, 2016. CVSS Base score of these vulnerabilities is taken from NVD, as NVD contains the information about vulnerability’s CVSS Base score. The CVSS score defines the severity of vulnerability.
Besides the severity of vulnerability the two major factors that affect system’s security and can increase risk level of system failure are, the maturity of vulnerability and the frequency of vulnerability. So, in the next steps the estimation of these two factors is done and finally the risk level will be evaluated. We are taken “CVE-2016-3092” vulnerability to elaborate our proposed methodology.
The step 2 of the computational procedure concerns estimating the Temporal Score of the vulnerabilities identified in Step 1. Temporal score equation defined in previous section uses maturity of vulnerability and Remediation Level vector of CVSS. The value of Remediation Level vector is computed by using CVSS v3 calculator [19] and maturity is determined by the Published date of vulnerability taken from NVD. With Base score, Remediation Level vector and maturity of vulnerability we are calculating the Temporal score.
Temporal Score= BaseScore × (1/RemediationLevel) ×MaturityOfExploitCode
Remediation Level of CVE-2016-3092 vulnerability is 0.7(by CVSS3.0 calculator) and maturity is 16 days on 20 July 2016. The maturity of vulnerability is considered as 1 because average patch release time for vulnerability ranges between 23 and 40 days[6].
In Step 3 frequency of the CVE-2016-3092 vulnerability is estimated according to the CVSS metric attributes using the equation described in previous section:
Frequency= (AV*AC*PR) + Temporal Score
Temporal score calculated in previous step is 5.46.The CVSS information available in the NVD for the vulnerability CVE-2016-3092 published on 2016-07-04 is as follows:
Attack Vector (AV): Network
Attack Complexity(AC): Low
Privileges Required (PR): None
Hence, Frequency = (Network*Low*None) + 0.54
Frequency= (0.85*0.77* 0.85) +0. 54
Frequency=1.09
With these calculated factors, vulnerability severity, maturity and frequency the risk level of vulnerability is evaluated. For risk level evaluation we sum up the frequency and CVSS Score of the vulnerability:
Risk Level = (Minimum [(CVSS Score + Frequency),10])
We defined the range of risk level in between 0.0 to 10.0. If the sum of CVSS score and frequency is more than 10 then risk level the value of risk level is taken as 10. For this we used Minimum function that will return 10 if sum is more.
VII. QUANTITATIVE RISK EVALUATION
For risk evaluation we are considering 25 potential vulnerabilities published during April to July, 2016. Maturity scores, frequencies and risk levels of these vulnerabilities are calculated using proposed methodology, which are shown in the table III. The first column of the table contains the serial number; the second and third columns represents information about CVE-ID of vulnerability and CVSS score of vulnerability computed using Base score of CVSS Metrics respectively. Fourth column represents the emergence date of vulnerability, which is taken from NVD. Fifth column shows the qualitative severity level of vulnerability derived by CVSS score(defined in TABLE-I).Sixth column shows the computed maturity score till 2016-07-21 with respect to published date. Seventh column represents the frequency of vulnerability calculated using proposed model and the eighth column contains the quantitative risk level determined by frequency along with maturity of exploit and CVSS score of vulnerability.
TABLE III
QUANTITATIVE RISK LEVEL EVALUATION
S N CVE-IDs CVSS Score Publish
ed Date Severity
Maturity on 2016-07-20 (In days) Freque ncy Risk Leve l 1 CVE- 2016-2346 6.8
2016-04-25 Medium 85 0.72 7.52
2 CVE- 2016-1918 4.3
2016-04-22 Medium 88 1.02 5.32
3 CVE- 2016-4051
6.8 2016-04-25 Medium 85 0.14 6.14
4 CVE- 2016-4118
7.2 2016-05-29 High 51 1.4 8.6
5 CVE- 2016-2175 7.5
2016-06-01 High 49 0.76 8.26
6 CVE- 2016-4521
10.0 2016-05-30 Critical 50 2.3 10
7 CVE- 2016-2309
7.5 2016-05-29 High 51 0.87 8.37
8 CVE- 2015-7988 7.5
2016-06-25 High 25 0.37 7.87
9 CVE- 2016-5020 9.0
2016-06-30 High 20 0.43 9.43
10 CVE- 2016-4440
7.2 2016-06-27 High 23 0.27 7.47
11 CVE- 2016-5728
5.6 2016-06-27 Medium 23 1.2 6.8
12 CVE- 2016-3651 6.0
2016-06-30 Medium 20 0.74 6.74
13 CVE- 2016-1387 9.0
2016-05-05 High 75 2.3 10
14 CVE- 2016-1343 6.4
2016-04-30 Medium 80 1.5 7.9
15 CVE- 2016-0892
4.3 2016-05-03 Medium 77 0.9 5.2
16 CVE- 2016-3092 7.8
2016-07-04 High 16 1.09 8.89
17 CVE- 2016-4438 7.5
2016-07-04 High 16 1.05 8.55
18 CVE- 2015-7029
10.0 2016-07-02 Critical 18 0.42 10
19 CVE- 2016-1289 10.0
2016-07-02 Critical 18 1.71 10
20 CVE- 2016-1328 7.8
2016-07-03 High 17 0.84 8.64
21 CVE- 2016-1394 7.5
2016-07-02 High 18 0.45 7.95
22 CVE- 2016-1416
10.0 2016-07-02 Critical 18 0.35 10
23 CVE- 2016-1442 9.0
2016-07-07 Critical 13 1.02 10
24 CVE- 2016-4512 7.5
2016-07-03 High 17 0.64 8.14
25 CVE- 2016-0230 7.2
2016-07-07 High 13 0.23 7.43
A. Observations
All round Automations PL/SQL Developer 11 system and it allows man-in-the-middle attackers to execute arbitrary code by modifying fields in the client-server data stream. One another vulnerability SN 3 “CVE-2016-4051” also has the same CVSS score released on same date and having same qualitative severity level as CVE-2016-2346 vulnerability. It is reported in squid and it allows remote attackers to cause a denial of service or execute arbitrary code by seeding manager reports with crafted data.CVE-2016-4051 affects Linux systems Red Hat Enterprise Linux 6 (squid), Red Hat Enterprise Linux 6 (squid34) and Red Hat Enterprise Linux 7 (squid) on 2016-05-31 [20]. Rapid 7 released patch for this vulnerability on 2016-06-14 [21].Even though both vulnerabilities have same severity level but patch is not available for CVE-2016-2346.After applying the proposed methodology, we observed that risk level of CVE-2016-2346 is 7.52 while risk level of CVE-2016-4051 is 6.14, because of the availability of the patch. After Qualitative evaluation now severity level of 2346 is High while of CVE-2016-2346 is Medium.
This evaluation shows that the proposed quantitative risk level evaluation of vulnerability will be more helpful in system security as it provides an effective way for risk level evaluation.
VIII. CONCLUSION
Controlling security risks is important for systems’ safety as security attacks may lead to system failure. In order to control security risks the effective evaluation of risks level is essential. This paper presents the Enhanced Quantitative CVSS Risk Level Estimation Model which effectively determines the risk level of vulnerability. The proposed model computes the overall risk level of a system based on maturity and frequency estimates. The model uses attributes from the Base metrics to estimate frequency. From these attributes by using Base score equation of CVSS 3.0 severity of the vulnerability is calculated. Severity score is an important factor of measuring risk level of system. We are considering that severity of vulnerability affects the system but its proportion changes with time. To reflect change in risk level with time we converges the maturity of exploit with the
severity of vulnerability.
The proposed model introduced a new dimension for calculating frequency of the vulnerability with the assumption that the more frequent occurrences of vulnerability makes system more risky. The assumption behind frequency computation is that, a highly exploitable vulnerability is more likely to be misused by attackers and consequently should have a higher frequency. With this assumption frequency of vulnerability is calculated with convergence of maturity of exploit.
Finally, along with the frequency of vulnerability, severity and maturity of exploit the quantitative risk level is calculated which defines the security risk level of the system. The proposed Quantitative Risk Level evaluation model will enhance the system security by effective risk level measurement.
ACKNOWLEDGMENT
The authors are highly thankful to Madhya Pradesh Council of Science and Technology, Bhopal for providing financial grant and support for this research project.
REFERENCES
[1] The Common Vulnerability Scoring System, Available: https://www.first.org/cvss
[2] National Vulnerability Database,Available: http://nvd.nist.gov [3] A. Tripathi and U.K. Singh, “On prioritization of vulnerability
categories based on CVSS scores”, Proceedings of 6th International Conference on Computer Sciences and Convergence Information Technology, Korea, 2011, pp.692–697.
[4] A. Tripathi and U.K. Singh, “A proposal for common vulnerability classification scheme based on analysis of taxonomic features in vulnerability databases”, International Journal of Computer Science and Information Security, Vol. 9, No. 6, 2011, pp.106–111.
[5] A. Tripathi and U.K. Singh, “Analyzing trends in vulnerability classes across CVSS metrics”, International Journal of Computer Applications, Vol. 36, 2011, No. 3, pp.38–44.
[6] A. Tripathi and U.K. Singh,“Estimating risk level for vulnerability categories using CVSS”, International Journal of Internet Technology and Secured Transactions”, Vol. 4, No. 4, pp.272–289.
[7] C. Joshi and U. Singh, “Analysis of Vulnerability Scanners in Quest of Current Information Security Landscape” International Journal of Computer Application (IJCA, 0975 – 8887), Volume 145 No 2, July 2016, pp. 1-7.
[8] C. Joshi and U. Singh, “A Review on Taxonomies of Attacks and Vulnerability in Computer and Network System”. International Journal of Advanced Research in Computer Science and Software Engineering (IJRCSSE) Volume 5, Issue 1, January 2015, pp 742-747.
[9] C. Joshi C. and U. Singh,“ADMIT- A Five Dimensional Approach towards Standardization of Network and Computer Attack Taxonomies”. International Journal of Computer Application (IJCA, 0975 – 8887), Volume 100, Issue 5, August 2014, pp 30-36.
[10] R. E. Sawilla and X.Ou, “Identifying critical attack assets in dependency attack graphs”. In: ESORICS ‘08: Proceedings of the 13th European Symposium on Research in Computer Security, Malaga, Spain, Springer-Verlag, 2008, pp. 18–34.
[11] W.U. Bin and A. J. WANG, “EVMAT: An OVAL andNVD Based Enterprise Vulnerability Modeling andAssessment Tool”, In Proceedings of ACMSE, Kennesaw,GA, USA, March 24-25, 2011, pp.115-120.
[12] “Risk Assessment and Mapping Guidelines for Disaster Management”, COMMISSION STAFF WORKING PAPER, Brussels, 2010. [13] CVE - Common Vulnerabilities and Exposures (CVE),
Available:https://cve.mitre.org/
[14] T. Hamid, C Maple, P. Sant., “Methodologies to Develop Quantitative Risk Evaluation Metrics”, International Journal of Computer Applications, Vol. 48 No.14, June 2012, pp.17-24.
[15] CVSS v3.0 specification document , Available: https://www.first.org/cvss/specification-document
[16] P. Mell, K. Scarfone, and S. Romanosky, “CVSS: A complete Guide to the Common Vulnerability Scoring System Version 2.0”, Forum of Incident Response and Security Teams (FIRST), 2007.
[17] A. Arora., R. Krishnan, R.Telang, Y. Yang, “An Empirical Analysis of Software Vendors’ Patching Behavior: Impact of Vulnerability Disclosure”, ICIS 2006 Proceedings, 2006, Paper 22.
[18] M. Ahmed, E. Al-Shaer and L. Khan, “A Novel Quantitative Approach For Measuring Network Security”, INFOCOM 2008, The 27th Conference on Computer Communications, IEEE, 13-18 April 2008. [19] Common Vulnerability Scoring System Version 3, Available:
Calculatorhttps://nvd.nist.gov/CVSS/v3-calculator.
[20] Red Hat Customer Portal, Available: https://access.redhat.com/ security/cve/cve-2016-4051.