Proceedings of the 12th International Workshop on Semantic Evaluation (SemEval-2018), pages 329–333
CENNLP at SemEval-2018 Task 1: Constrained Vector Space Model in
Affects in Tweets
Naveen J R, Barathi Ganesh H. B., Anand Kumar M, Soman K P Center for Computational Engineering and Networking (CEN)
Amrita School of Engineering, Coimbatore Amrita Vishwa Vidyapeetham, India
[email protected], m [email protected]
Abstract
This paper discusses on task 1, ”Affect in Tweets” sharedtask, conducted in SemEval-2018. This task comprises of various sub-tasks, which required participants to analyse over different emotions and sentiments based on the provided tweet data and also measure the intensity of these emotions for subsequent subtasks. Our approach is to come up with a model for all the subtasks on count based representation and use machine learning tech-niques for regression and classification related tasks. In this work, we use bag of words tech-nique for supervised text classification and re-gression. . Further, fine tuning on various pa-rameters for the bag of word, representation model we acquired better scores over various other baseline models (Vinayan et al.) partici-pated in the sharedtask.
1 Introduction
A huge portion of analysis in natural language pro-cessing try to find better understand and process various kinds of info in text. Day by day the devel-opment of social websites, blogging and the con-summation of technologies gives vast amount text data on the internet, which opened a space to study peoples feeling, reviews, and emotion from their own written languages, called sentimental analy-sis. Sentimental analysis has so many attractions and has done so many research (Zhu et al.,2014) in this area.
Sentiment analysis remains a sequence of tech-niques, approaches, and tools about sensing and mining subjective info (such as opinion and at-titudes) from language (Bravo-Marquez et al.,
2014). Traditional approaches (Kiritchenko et al.,
2014; Mohammad et al., 2013) are finding out the polarity of the positive, negative, neutral classification problem (Mohammad,2018; Bravo-Marquez et al., 2015). Recent research in sen-timental analysis (Mohammad and Kiritchenko,
2018) are done on the data-driven algorithm view point. But at the same time combination of good linguistic awareness data can increase the perfor-mance and insights about the task. We used ma-chine learning techniques to build the model. Lin-ear regression, random forest methods are used re-spectively for prediction and classification tasks. A mathematical system or an algorithm need some form of numeric representation to work with. The naive way of representing a word in vector form is one hot representation but it is a very ineffec-tive way for representing a large corpus. In a more effective way, we need some semantic sim-ilarities (Soman et al., 2016) to nearby points, thus creating the representation bring beneficial info about the word actual meaning, called word embedding models that are categorized based on count and predictive word embedding models. Both embedding models at least some way share sematic meaning. We used here count based word embedding methods for inputting the word. In more specific, Feature representation is done based on the term-document matrix (TDM) and term frequency-inverse frequency (TFIDF) ma-trix. The optimum value of n-gram range, depth of classifier, mindf are obtained by hyper parame-ter tuning.
2 Corpus
Dataset provided by shared task was sourced from Twitter API by focusing emotion-correlated words. The tweets were annotated separately for 4 emotions namely anger, joy, fear and sadness. The data provided were annotated with best-worst scaling technique (Kiritchenko and Mohammad,
2016) that gave better annotation consistency and emotion intensity scores for tweets. There were 5 subtasks in task1 (Mohammad et al., 2018). For each sub-tasks, separate training and testing data
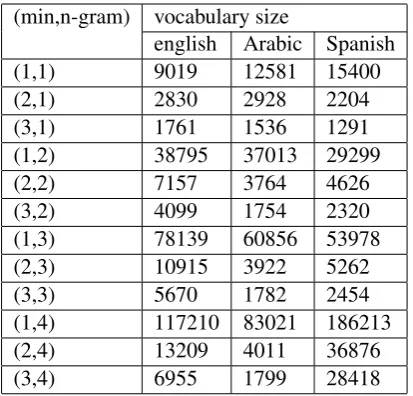
sets are given for Spanish, English, and Arabic. Subtasks 1 and 3 focused on emotion intensity and sentiment intensity tasks respectively which were categorized into regression tasks (EI-reg and V-reg ). In that emotion intensity and sentimental inten-sity is a real-valued scale between 0 and 1, where 0 represents least and 1 represents the most in-tensity of the tweeters from written tweets. Rest of the subtasks EI-oc, V-oc, E-c were multi-class classifications problems that are emotion intensity ordinal classification, sentiment analysis ordinal classification, emotion classification subtasks re-spectively. For subtask 2(EI-oc) distinct training and testing, dataset are provided for anger, fear, joy, and sadness. Subtask 4(V-oc) gives 7 ordi-nal classes, according to different levels of posi-tive and negaposi-tive valence state of the tweeter. Ta-ble 1-2 shows various vocabulary sizes based on the different count and n-gram parameters, for 3 different languages.
(min,n-gram) vocabulary size
[image:2.595.314.521.61.259.2]English Arabic Spanish (1,1) 23359 25144 15400 (2,1) 10677 9281 6022 (3,1) 6738 7067 4453 (1,2) 119782 83498 64306 (2,2) 41557 20143 18324 (3,2) 22669 16333 13405 (1,3) 250233 141916 126712 (2,3) 76696 29223 28581 (3,3) 40550 24810 21417 (1,4) 378870 196365 186213 (2,4) 109838 37527 36876 (3,4) 57970 32682 28418
Table 1: El-reg vocabulary size with variation of pa-rameters.
3 Background
3.1 TDM
TD is the most basic method of representation of a text used in NLP. In this technique, for every indi-vidual document present in a corpus, we take the raw count of the words present in that document over all the unique words present in the entire cor-pus as its representation (Larson,2010). That is to say, a vocabulary is created using all the word in the entire corpus and for a single document repre-sentation, the count of the words are incremented in view of their occurrence only for that
docu-(min,n-gram) vocabulary size
english Arabic Spanish (1,1) 9019 12581 15400 (2,1) 2830 2928 2204 (3,1) 1761 1536 1291 (1,2) 38795 37013 29299 (2,2) 7157 3764 4626 (3,2) 4099 1754 2320 (1,3) 78139 60856 53978 (2,3) 10915 3922 5262 (3,3) 5670 1782 2454 (1,4) 117210 83021 186213 (2,4) 13209 4011 36876 (3,4) 6955 1799 28418
Table 2: V-reg vocabulary size with variation of param-eters.
ment. The drawback of this method is that this cre-ates a very spares matrix where only a few of the columns are accumulated with numbers whereas, the rest of the columns are all zeros, thus bringing to the term frequency method.
3.2 TF-IDF
One of the problems that occur due to the term document representation is that, it takes a raw count of all the words present in the document where most frequently occurring words like con-junction, preposition appear very often across most of the articles, thus not adding any signifi-cant importance to the individual article. On the other hand, seldom occurring words, like proper nouns give a more individual identification to the article. Thus, coming to a method where we take in the frequency of the words over the entire cor-pus, this method is termed as term-frequency(tf). In language processing technique a collection of commonly appearing words with apparently less significance to a document are called as ’stop words’, these can be removed at pre-processing level. Whereas, more often than not a list of stop words is not a sophisticated approach to adjusting term frequency for commonly used words. Inverse document frequency (idf) is a technique (Ramos et al., 2003) wherein, less weight age is given to more commonly occurring words (not re-stricted to only stop words) and vice-verse for sel-domly used words across the entire corpus.
idft=ln
Ntot docs ndocs containing t
Combining the two ideologies (tf-idf) brings, the rarity of the term intended to measure how impor-tant a word can be to the document in a collection (or corpus) of documents. it can be considered as a heuristic quantity. The term inverse document frequency for any given term is defined as
tf−idft,d=tft,d∗idft
3.3 Linear Regression
Linear regression is a commonly used supervised learning approach for prediction. The key goal is to fit a best fit line between a dependent and inde-pendent variable so as to minimize the error sum of squares between the actual and predicted value using the model. The model for linear regression is usually fitted using least square approach, or by minimizing the error sum of squares between the actual and predicted value. In certain cases, the model can also be framed by adding a regular-ization term. The regularregular-ization term is added to avoid overfitting (Franc¸ois and Miltsakaki,2012).
3.4 Random Forest
Random forest, an ensemble decision tree based classifier which averages various combination of trees created on arbitrary samples from the data set. A decision tree breakdown the data into mi-nor sub-classes while instantaneously construe a tree using decision and leaf nodes. The category is embodied by leafs nodes. A decision node takes two or extra divisions with choices or leafs. Ev-ery tree in the RF is made on an arbitrary decent subclass of features present (Liaw et al.,2002) on the entire data. The RF algorithm medians trees to generate a system with short variance and insignif-icant trees are canceled out, left trees produce the output.
4 Methodology
The model will be effective based on how it is extracting meaningful information from raw text. The system is created with the help of scikit-learn library 1 which is a python based library very much useful for classification, regression, clus-tering, data preparation, dimensionality reduction etc.
1http://scikit-learn.org/stable/
The training, development and test data set are taken from SemEval18 website.
1. Importing training and cross-validation from the given data set
2. Removes all the stop words from data that are insignificant.
3. Create a bag of words model which is a sim-ple numeric representation of piece of text that is easy to classify. We just count the frequency of each word in the piece of text and created a dictionary of them which is called tokenization process in NLP which is then passed to countvectorize object in scikit learn package to create a set of maximum fea-tures. We use fit transform method to model (Ganesh et al.,2016) the bag of words feature vector which are stored in an array.
4. Same tools and methods are followed for cre-ating TDM matrix as mentioned in step 3
5. We created a classifier or prediction with the help of machine learning model. Here we used random forest classifiers consisting of one hundred trees. RF is a set of decision trees graphs that model all possibility of cer-tain outcomes.
lang Rep min df n-gram MSE Var Sp TDM 1 3 0.04 0.19 Sp TFIDF 1 2 0.04 0.19
Ara TDM 1 3 0.03 0.04 Ara TFIDF 1 2 0.03 0.04
[image:3.595.319.516.455.556.2]En TDM 1 3 0.04 -0.02 En TFIDF 1 3 0.03 0.09
Table 3: EI-reg cross validation results.
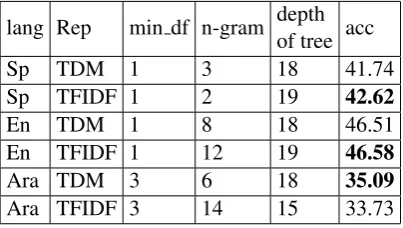
lang Rep min df n-gram depthof tree acc Sp TDM 1 3 18 41.74 Sp TFIDF 1 2 19 42.62
En TDM 1 8 18 46.51 En TFIDF 1 12 19 46.58
Ara TDM 3 6 18 35.09
[image:3.595.316.518.595.709.2]Ara TFIDF 3 14 15 33.73
Table 4: EI-oc cross validation results.
lang Rep min df n-gram MSE Var Sp TDM 1 2 0.03 0.33 Sp TFIDF 1 2 0.03 0.34
English TDM 1 3 0.04 0.25 En TFIDF 1 2 0.04 0.25
Ara TDM 1 2 0.03 0.22
[image:4.595.78.284.61.163.2]Ara TFIDF 2 3 0.03 0.21
Table 5: V-reg cross validation results.
lang Rep min df n-gram depth acc Sp TDM 3 9 17 30 SP TFIDF 2 10 13 31.4
En TDM 2 13 18 29.4 En TFIDF 1 9 17 29.4
Ara TDM 1 14 16 26
[image:4.595.82.281.193.295.2]Ara TFIDF 2 9 15 25.36
Table 6: V-oc cross validation results.
model is created 3 different languages, Spanish, English and Arabic. Both TDM and TFID fea-ture matrix are tuned on the basis of accuracy and Fscore values. Accuracy shown in bold letter are used for making prediction and classification task model.
5 Result
The group of tasks is particularly focusing on au-tomatic detection of the intensity of emotion (EI-reg) and sentiment (V-(EI-reg) of the tweeter. In this task, they have presented with the problem of clas-sifying multi-classed emotion of tweets, such as EI-oc, V-oc, E-c . We have approached these tasks with a count based representation model, where every individual tweet is represented based on var-ied vocabulary size, and how these will perform for different category of subtasks over three differ-ent language dataset namely English, Spanish and Arabic. We base the model, considering in mind
lang Rep min df n-gram depthof tree accur Sp TDM 3 11 12 95.58 Sp TFIDF 1 9 17 95.58
En TDM 2 5 15 95.25 En TFIDF 2 7 15 95.25 Ara TDM 1 1 2 93.81 Ara TFIDF 2 10 10 94.41
Table 7: E-c cross validation results.
that an algorithm should not be narrowed down to a certain problem. That is it should not be bi-ased towards a particular problem overall, this in-ference is made on the fact that all subtasks under task1 are focused on understanding the effect of tweets from the same corpora. As all the subtasks under task1 follow a generic grid search models, which are varied over min-df, n-gram parameters. The El-reg task was tuned on mean square error and varience for all 3 languages. El-reg gave com-paratively better accuracy in TF-IDF matrix than TDM matrix.so we used TF-IDF for creating fea-ture matrix. This regression task gave macroavg between 32-44 percentage. English tweets gave least macro-avg value (32) and Spanish data gave high macro-avg value, among them angry got un-wavering values in 3 languages.
Pearson (all instances) macro
-avg anger fear joy sadness english 0.328 0.315 0.415 0.178 0.404 arabic 0.399 0.267 0.392 0.487 0.447 spanish 0.441 0.348 0.533 0.414 0.471
Table 8: EI-reg result.
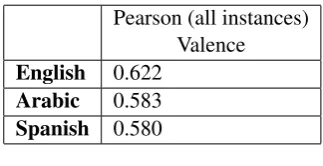
V-reg is a regression task where sentiment in-tensity was predicted. Spanish and English used TF-IDF and Arabic corpora used term document matrix for feature input matrix. These feature are found out by grid search method. Arabic and Spanish data give 58 % prediction and English data give slight high result which is 62
Pearson (all instances) Valence
English 0.622
Arabic 0.583
Spanish 0.580
Table 9: V-reg result.
Subtasks 2,4,5 are multi-label classification problems whose models are also generated by bag of words method. But the classification which was done by random forest did not yield expected re-sult comparing to regression tasks.
6 Conclusion
[image:4.595.335.497.523.606.2] [image:4.595.80.283.632.746.2]re-gression were used as machine learning tasks for predicting classification tasks and regression tasks respectively in which regression task gave fairly good results while classification task yield not so favorable results. TF-IDF seems to give better re-sults for English and Spanish languages whereas TDM gave better results for the Arabic language. Emotion intensity and valence were captured by our model for the validation given data. Algo-rithms performed nearly same with TF-IDF and TDM but with slightly better results while using TF-IDF.
References
Felipe Bravo-Marquez, Eibe Frank, and Bernhard Pfahringer. 2015. Positive, negative, or neu-tral: Learning an expanded opinion lexicon from emoticon-annotated tweets. InIJCAI, pages 1229– 1235.
Felipe Bravo-Marquez, Marcelo Mendoza, and Bar-bara Poblete. 2014. Meta-level sentiment models for big social data analysis. Knowledge-Based Systems, 69:86–99.
Thomas Franc¸ois and Eleni Miltsakaki. 2012. Do nlp and machine learning improve traditional readabil-ity formulas? In Proceedings of the First Work-shop on Predicting and Improving Text Readability for target reader populations, pages 49–57. Associ-ation for ComputAssoci-ational Linguistics.
HB Barathi Ganesh, M Anand Kumar, and KP Soman. 2016. From vector space models to vector space models of semantics. InForum for Information Re-trieval Evaluation, pages 50–60. Springer.
Svetlana Kiritchenko and Saif M Mohammad. 2016. Sentiment composition of words with opposing po-larities. InProceedings of the 2016 Conference of the North American Chapter of the Association for Computational Linguistics: Human Language Tech-nologies, pages 1102–1108.
Svetlana Kiritchenko, Xiaodan Zhu, and Saif M Mo-hammad. 2014. Sentiment analysis of short in-formal texts. Journal of Artificial Intelligence Re-search, 50:723–762.
Ray R Larson. 2010. Introduction to information re-trieval.
Andy Liaw, Matthew Wiener, et al. 2002. Classifi-cation and regression by randomforest. R news, 2(3):18–22.
Saif M. Mohammad. 2018. Word affect intensities. In
Proceedings of the 11th Edition of the Language
Re-sources and Evaluation Conference (LREC-2018),
Miyazaki, Japan.
Saif M. Mohammad, Felipe Bravo-Marquez, Mo-hammad Salameh, and Svetlana Kiritchenko. 2018. Semeval-2018 Task 1: Affect in tweets. In Proceed-ings of International Workshop on Semantic
Evalu-ation (SemEval-2018), New Orleans, LA, USA.
Saif M. Mohammad and Svetlana Kiritchenko. 2018. Understanding emotions: A dataset of tweets to study interactions between affect categories. In Pro-ceedings of the 11th Edition of the Language
Re-sources and Evaluation Conference (LREC-2018),
Miyazaki, Japan.
Saif M Mohammad, Svetlana Kiritchenko, and Xiao-dan Zhu. 2013. Nrc-canada: Building the state-of-the-art in sentiment analysis of tweets. arXiv preprint arXiv:1308.6242.
Juan Ramos et al. 2003. Using tf-idf to determine word relevance in document queries. In Proceedings of the first instructional conference on machine learn-ing, volume 242, pages 133–142.
KP Soman et al. 2016. Amrita cen at semeval-2016 task 1: Semantic relation from word embed-dings in higher dimension. In Proceedings of the 10th International Workshop on Semantic
Evalua-tion (SemEval-2016), pages 706–711.
Vivek Vinayan, JR Naveen, NB Harikrishnan, M Anand Kumar, and KP Soman. Amritanlp@ pan-rusprofiling: Author profiling using machine learn-ing techniques.
Xiaodan Zhu, Svetlana Kiritchenko, and Saif Moham-mad. 2014. Nrc-canada-2014: Recent improve-ments in the sentiment analysis of tweets. In Pro-ceedings of the 8th international workshop on