Proceedings of the 13th International Workshop on Semantic Evaluation (SemEval-2019), pages 806–811
806
UVA Wahoos at SemEval-2019 Task 6:
Hate Speech Identification using Ensemble Machine Learning
Murugesan Ramakrishnan Data Science Institue University of Virginia [email protected]
Wlodek Zadrozny Computer Science
UNC-Charlotte [email protected]
Narges Tabari Data Science Institute University of Virginia [email protected]
Abstract
With the growth in the usage of social media, it has become increasingly common for peo-ple to hide behind a mask and abuse others. We have attempted to detect such tweets and comments that are malicious in intent, which either targets an individual or a group. Our best classifier for identifying offensive tweets for SubTask A (Classifying offensive vs. non-offensive) has an accuracy of 83.14% and a f1-score of 0.7565 on the actual test data. For SubTask B, to identify if an offensive tweet is targeted (If targeted towards an individual or a group), the classifier performs with an accu-racy of 89.17% and f1-score of 0.5885. The paper talks about how we generated linguis-tic and semanlinguis-tic features to build an ensem-ble machine learning model. By training with more extracts from different sources (Face-book, and more tweets), the paper shows how the accuracy changes with additional training data.
1 Introduction
Internet is now accessed by over half of the world’s population 1. In fact, almost 1 million new users are added each day. With social media platforms, people find it a lot easier to get away with the abuse they spew around, in comparison to the offline world. This brings a lot of onus on the Social Network websites to tackle such ac-tivities. Majority of the countries have laws to control hate speech which puts tremendous pres-sure on the concerned websites to curb such activ-ities. Since manual monitoring or defining a spe-cific rule-set might be time consuming, an ensem-ble machine learning approach has been discussed to avoid complexity and increase interpretability.
The paper focuses on providing solutions to SubTask A and SubTask B for the SemEval 2019
1https://news.itu.int/
itu-statistics-leaving-no-one-offline/
competition. Previous works and papers focus on identifying if a tweet is offensive or not. Here, in addition to that, it is identified if an offensive tweet is targeted towards a particular individual or a group (SubTask B). Such granular information would help the Social Media to make better deci-sions.
2 Related Work
This issue has gathered a lot of attention over the past few years with various types of hate speech detection models.
Papers published in the last two years include the surveys bySchmidt and Wiegand (2017) and
Fortuna and Nunes (2018) where the authors extract features from the text like sentiment, linguistic features, utilize different lexical re-sources to tag an offensive tweet, and another paper by Davidson et al. (2017) presenting the Hate Speech Detection data set used in Malmasi and Zampieri(2017) where the authors perform a three way classification - Hate Speech, Offensive and None. By classifying these, the authors talk about specific patterns related to offensive terms. It is found that the usage of cuss words like b*tch and n*gga is fond in both offensive and casual setting, while f*ggot and n*gger were predominantly used in hateful contexts. One of the major takeaways was that lexical methods are effective to identify potentially offensive terms, but are inaccurate at identifying hate speech Other work include: ElSherief et al. (2018); Gamb¨ack and Sikdar(2017);Zhang et al.(2018).
These help in creating segment wise features to capture them separately. Finally, methods in iden-tifying profanity vs. hate speech is talked by Mal-masi and Zampieri(2018). This work highlighted the challenges of distinguishing between profan-ity, and threatening language which may not actu-ally contain profane language.
The description of the current task is presented in detail inZampieri et al.(2019b), which clearly provides the context and underlying problem state-ment for this paper.
3 Data
For this project, the data set provided by the orga-nizers of OffensEval 2019 was used.The data col-lection methods used to compile the data set used is described inZampieri et al. (2019a). The data set consisted of 13,241 records of training obser-vations with the following types of response vari-ables : 1) If a tweet is offensive or not 2) If an offensive tweet is targeted towards an individual (IND) or a group (GRP).
To validate if the performance would increase, an additional data source was also used. The main hypothesis behind including the data was that more data would result in a better accuracy. So, the data set that closely aligned with the cur-rent objective was considered for the analysis. This data set was used as a part of the competi-tion organized by TRAC2. This contained the re-sponse variable with the categories - ’Covertly Ag-gressive’, ’Overtly Aggressive’ and ’Non Aggres-sive’. To maintain consistency with the current data set, ’Covertly Aggressive’ and ’Overtly Ag-gressive’ were tagged as ’Offensive’ and the rest as ’Not Offensive’.
Including both the data sets, there were a total of 25,239 observations.
The distribution of variables of the original data set is as follows,
SubTask A: Offensive (33%), and Non-offensive (67%). SubTask B: Out of the 33% offensive tweets, it is seen that there are Targeted (88%), and Untargeted (12%)
4 Methodology
The Methodology involved two sub-works - Fea-ture Engineering and Ensemble Model building.
2https://sites.google.com/view/trac1/
shared-task/
Various features were extracted to get the seman-tics of the words and tweets.
4.1 Feature Engineering
Character n-grams
Inspired from earlier works, character n-grams were used especially to tackle misspelled words or words without spaces like ’fu*koff’ and ’fu*kasdf’. In both of these cases, character 4-gram would detect the sub-word ’fu*k’.
Word n-grams
Apart from using just 1-gram, 3-gram and 4-gram really helped in identifying the context of the tweet and focus on words like ’not good’where ’not’ negates the next word.
Cuss-word Dictionary and Profanity Checker A list of cuss words were scraped from www.noswearing.com. This helped in identi-fying such cuss words in tweets which occurred only once or twice in the whole corpus. Profanity checker libraries like profanity were also used along with the scraped list. These helped in creat-ing features like cuss-word count and cuss-word position.
GloVe Embedding
The use case of GloVe embedding were two-fold. One, average embedding could be found for a tweet which can then be used as a feature space. Two, once the top-30 features were obtained from the initial training, GloVe model was used to find most similar words to them thereby creating a feature representing potential offensive terms.
Part of Speech
Parts of Speech of the tweets were extracted using spaCy, especially the pronouns which could be used for identifying an individual(SubTask B).
Others
Other features like tweet polarity (positive, nega-tive or neural score), of hash-tags, of user tags were also used.
4.2 Model Building
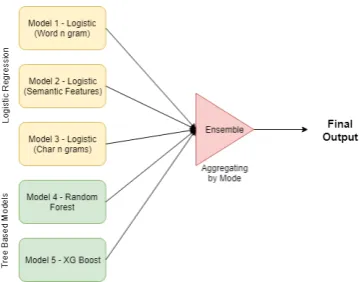
Figure 1: Final Model Architecture
An Ensemble Model was then built by aggregat-ing the results of 5 different models with varyaggregat-ing feature set provided as input to each model.
Logistic Regression
Three basic logistic regression models with L2 regularization were developed:
Model 1 was built with Bag of Words (1 - 4 grams) which amounted to 107,445 number of fea-tures
Model 2 was built with Tweet Polarity, Word Embedding, Cuss Word Count, and Cuss Word Position
Model 3was built with character - 4 grams. Var-ious tests with cross validation were performed to arrive at this result with a final count of 100,122 features
Tree Based Models
Model 4 was built using Random forest with Bag of Words (1,2,3,4 grams) containing a total feature size of 107,237.
Model 5 using XG Boost, with Bag of Words (1,2,3,4 grams) containing a feature size of 107,237.
The combined architecture looked as follows, Vote count was made to arrive at the final deci-sion using the outputs from each of these models
5 Results
5.1 Results - SubTask A
Model results with respect to the validation data set (part of the training sample) are discussed here. Results of the validation data set with respect to the 80-20 split are shown,
Ensemble Model was able to perform with an accuracy gain of 1.5% with respect to the best in-dividual model(Model 1)
Similarly, the results for the model using the
Model Accuracy F1 (macro)
Model1 - Logistic (BOW) 0.78 0.73 Model 2- Logistic (Semantic features) 0.77 0.70 Model 3 - Logistic (Char n gram) 0.76 0.71 Model 3 - Random Forest (BOW) 0.77 0.70 Model 4 - XG Boost (BOW) 0.77 0.71
[image:3.595.306.525.61.134.2]Ensemble Model 0.80 0.74
Table 1: Results for SubTask A without additional data
given data with an addition of training data pro-vided by TRAC are,
Model (Additional Data) Accuracy F1 (macro) Model1 - Logistic (BOW) 0.73 0.72 Model 2- Logistic (Semantic features) 0.70 0.69 Model 3 - Logistic (Char n gram) 0.72 0.71 Model 3 - Random Forest (BOW) 0.71 0.69 Model 4 - XG Boost (BOW) 0.71 0.71
Ensemble Model 0.74 0.73
Table 2: Results for SubTask A with additional data
Comparing the results, it can be seen that addi-tion of data in fact reduces the model accuracy.
Features Analysis- Logistic Regression
For better intuitive understanding, top features from logistic regression model trained without ad-ditional data were extracted to understand what words constitutes a tweet to be offensive,
Variable Coefficient
stupid 1.798
sucks 1.513
Cuss word 1.453
crap 1.415
clown 1.274
idiots 1.274
bitch 1.272
sex 1.231
Table 3: Coefficients with higher values
It is clear that words like stupid, sucks, crap and idiots increases the probability of a tweet to be of-fensive. However, it has been identified that some non-offensive tweets are mis-classified as offen-sive just because of the presence of such words.
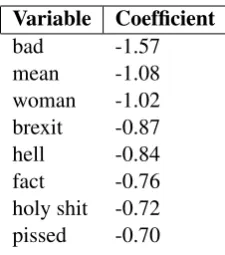
Looking at the coefficients with least weights, it is seen that although the above words have a mild negative connotation, majority of their use-cases are not in an offensive setting which makes a tweet with these to have higher probability of non-offensive class.
[image:3.595.310.525.211.284.2] [image:3.595.356.478.440.566.2]Variable Coefficient
bad -1.57
mean -1.08
woman -1.02
brexit -0.87
hell -0.84
fact -0.76
holy shit -0.72
pissed -0.70
Table 4: Coefficients with lower values
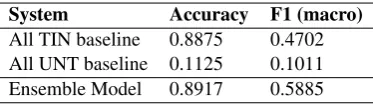
The results using ensemble model were submitted to the competition and compared against the actual test data. The table shows the baseline results and the model’s performance
System Accuracy F1 (macro)
[image:4.595.124.237.60.188.2]All NOT baseline 0.7209 0.4189 All OFF baseline 0.2790 0.2182 Ensemble - No additiona data 0.8314 0.7565 Ensemble with additional data 0.8093 0.7433
Table 5: SubTask A result on actual test data
It was surprising to see that by training the model with additional data, model’s accuracy de-creased by 3%. This can be mainly attributed to the difference in data sources and difference in re-sponse variable definition.
The results between the models trained with and without additional data are to be compared to see the difference between them. Looking at the tweets tagged as Offensive by Model without additional data, but as non-offensive by the other : @USER Zuckerberg lies., SerenaWilliams is so full of herself...she is just as painful to watch as to listen to..., and”50 Cent Calls Out Joe Budden’s Bullshit”” On Instagram URL URL. Looking at the tags, it can be hypothesized that words like ’lies’,’painful’ and ’bullshit’ which had very high positive score (offensie), got reduced because of the additional data where these words were not used in an offensive setting. Difference in usage of such words is the reason behind reduction in prediction accuracy for new tweets.
Confusion Matrix
The primary problem is seen with predicting the offensive tweets, where almost half of them are were predicted incorrectly, while a majority of the non-offensive tweets are predicted correctly.
Error Analysis
NOT OFF
Predicted label NOT
OFF
True label
596
24
121
119
Confusion Matrix
[image:4.595.307.533.65.264.2]0.0 0.2 0.4 0.6 0.8
Figure 2: SubTask A, Ensemble - No additional data
Analyzing the two cases of mis-classification, i) Offensive tweet tagged non-offensive - While a few of the tweets target an individual or a group, many of them seem to be ambiguous like -”@USER @USER @USER @USER Kick the ab-solute shite out of the car”, ”@USER @USER @USER @USER Yes. Yes he is!”, and ”Shits about to Hit the Fan. MAGA URL”
ii) Non offensive being tagged as offensive -The most common reason is the presence of cuss word in a non-offensive sense. Examples are -Am I a dickhead ???? Probably yes,@USER I’ve al-ready listened to it like 5 times it’s so fucking well madeMore features related to the sequence of the
sentence, and dependency parsing might help in understanding the syntactic structure
5.2 Results - SubTask B
The model architecture remained similar to the earlier SubTask, except that Model 2 was trained with additional features like Parts of Speech to help detect the target.
The cross-validation results obtained are,
Model (SubTask B) Accuracy F1 (macro) Model1 - Logistic (BOW) 0.87 0.46 Model 2- Logistic (Semantic features) 0.87 0.46 Model 3 - Logistic (Char n gram) 0.87 0.45 Model 3 - Random Forest (BOW) 0.86 0.46 Model 4 - XG Boost (BOW) 0.87 0.46
Ensemble Model 0.88 0.47
Table 6: Results for SubTask B with no additional data
[image:4.595.82.282.291.343.2]bet-TIN UNT Predicted label TIN
UNT
True label
210
3
23
4
Confusion Matrix
[image:5.595.75.296.65.263.2]0.0 0.2 0.4 0.6 0.8
Figure 3: SubTask B,Confusion matrix for final model
ter than all the other individual models. Now, as-sessing the performance on actual test data,
System Accuracy F1 (macro)
All TIN baseline 0.8875 0.4702 All UNT baseline 0.1125 0.1011 Ensemble Model 0.8917 0.5885
Table 7: SubTask B result on actual test data
Confusion Matrix
Looking at the confusion matrix in Figure 3, the main issue is seen with predicting a targeted tweet, where almost all of them are predicted incorrectly. This can be ascribed to insufficient number of fea-tures that would identify an individual or organi-zation.
6 Conclusion
The proposed ensemble model leverages the best of each of the individual models, where each of the models was experimented with a varying set of features. Some features like word and charac-ter n-grams, tweet polarity, cuss word count were more helpful in capturing offensive tweets. The performance for SubTask B is not appreciable be-cause less number of features related to identify-ing a target were used. With our best scores for SubTask A, we were placed 36th out of 103 par-ticipants, and were placed 42nd out of 75 submis-sions in the SemEval-2019 competition. The top team achieved a F1(macro) score of 0.829 in Sub-Task A, while we obtained 0.756. Similarly, for SubTask B the top team had a F1(macro) score
of 0.755, while we obtained 0.588. Features like identifying the presence of a person’s name using nltk libraries, and the presence of an individual or an organization using Named Entity Recogni-tion with spaCy is highly recommended for further studies.
Moreover, there was a pattern associated with the coefficients having least weights - most of them had a slightly negative connotation. This can justified because of the overall theme of tweets used for training, as most of them were inclined towardspolitics. This lead to overall less number of ’positive words’. Having more training ex-amples especially with a range of tweet polarity from more positive to more negative would help in building better models. As seen from our re-sults, an additional data set should be in the same space (Twitter data) to avoid worse performance.
Talking about the offensive tweet categories, there are four types - explicit, implicit, targeted at individuals and groups. The techniques mentioned in this paper using a variety of feature engineering tries to capture most of these categories. How-ever, advanced syntactic features should be in-troduced to capture patterns like ”Pronoun-Verb-Cuss word”. Especially, if a exploratory data analysis is performed on analyzing the patterns of Parts of Speech in offensive tweets, it would help in building additional useful variables.
The main goal of this paper is to show that sim-pler models which have understandable features can produce good results. More complex methods like introducing polynomial or intricate features, deep learning models using Recurrent Neural Net-work are other approaches for potentially better accuracy but at the risk of losing interpretability. In conclusion, it is believed that with additional robust features as discussed earlier, the current ensemble machine learning model’s performance might increase. Moreover, such features would also be really helpful in interpreting why a tweet could be offensive, which will help in taking nec-essary actions and remedial measures for social media companies.
References
Thomas Davidson, Dana Warmsley, Michael Macy, and Ingmar Weber. 2017. Automated Hate Speech Detection and the Problem of Offensive Language. InProceedings of ICWSM.
[image:5.595.88.275.344.397.2]William Yang Wang, and Elizabeth Belding. 2018. Hate Lingo: A Target-based Linguistic Analysis of Hate Speech in Social Media. arXiv preprint arXiv:1804.04257.
Paula Fortuna and S´ergio Nunes. 2018. A Survey on Automatic Detection of Hate Speech in Text. ACM Computing Surveys (CSUR), 51(4):85.
Bj¨orn Gamb¨ack and Utpal Kumar Sikdar. 2017. Using Convolutional Neural Networks to Classify Hate-speech. In Proceedings of the First Workshop on Abusive Language Online, pages 85–90.
Shervin Malmasi and Marcos Zampieri. 2017. Detect-ing Hate Speech in Social Media. InProceedings of the International Conference Recent Advances in Natural Language Processing (RANLP), pages 467– 472.
Shervin Malmasi and Marcos Zampieri. 2018. Chal-lenges in Discriminating Profanity from Hate Speech. Journal of Experimental & Theoretical Ar-tificial Intelligence, 30:1–16.
Anna Schmidt and Michael Wiegand. 2017. A Sur-vey on Hate Speech Detection Using Natural Lan-guage Processing. InProceedings of the Fifth Inter-national Workshop on Natural Language Process-ing for Social Media. Association for Computational Linguistics, pages 1–10, Valencia, Spain.
Zeerak Waseem, Thomas Davidson, Dana Warmsley, and Ingmar Weber. 2017. Understanding Abuse: A Typology of Abusive Language Detection Subtasks. In Proceedings of the First Workshop on Abusive Langauge Online.
Marcos Zampieri, Shervin Malmasi, Preslav Nakov, Sara Rosenthal, Noura Farra, and Ritesh Kumar. 2019a. Predicting the Type and Target of Offensive Posts in Social Media. InProceedings of NAACL.
Marcos Zampieri, Shervin Malmasi, Preslav Nakov, Sara Rosenthal, Noura Farra, and Ritesh Kumar. 2019b. SemEval-2019 Task 6: Identifying and Cat-egorizing Offensive Language in Social Media (Of-fensEval). InProceedings of The 13th International Workshop on Semantic Evaluation (SemEval).
Ziqi Zhang, David Robinson, and Jonathan Tepper. 2018. Detecting Hate Speech on Twitter Using a Convolution-GRU Based Deep Neural Network. In