Original Article
Analysis of contrast-enhanced ultrasound in the
differential diagnosis of papillary thyroid
cancer and thyroid nodules
Zheng Zhu1*, Yongxiang Qian2*, Fenglan Zhu3*, Qingfeng Ni1, Xinyan Xu1
Departments of 1Ultrasound, 2Thyroid and Breast Surgery, 3Endocrinology, Taicang First People’s Hospital, Taicang
215400, Jiangsu Province, P. R. China. *Equal contributors.
Received December 15, 2015; Accepted May 19, 2016; Epub July 15, 2016; Published July 30, 2016
Abstract: Aims: This study is to analyze the value of contrast-enhanced ultrasound in the differential diagnosis of papillary thyroid cancer and thyroid nodule. Methods: Ninety cases of papillary thyroid cancer were considered as papillary thyroid cancer group, and 90 cases of thyroid nodules in the same period were considered as thyroid nod-ule group. Ultrasound images were compared and differential diagnostic values of contrast-enhanced ultrasound (CEUS) were analyzed. Results: Between two groups, there were significant differences of systolic peak velocity and resistance index (P<0.05). In papillary thyroid cancer group, papillary thyroid cancer accounted for 74.4%, 81.2%, 62.3%, 67.8%, and 82.2% for abnormal signs of lesion’s shape, border, contrast intensity, enhancement and fill-ing defect in CEUS, respectively. Meanwhile, ROC curve was drawn for sensitivity and specificity analysis based on ultrasound images and then compared with pathology scores. The area under ROC curve (AUC) of papillary thyroid cancer and thyroid nodules was 0.924 and 0.806, respectively. The CEUS was of great diagnostic value for papillary thyroid cancer compared thyroid nodules with statistical significance (P<0.05). Conclusion: CEUS can distinguish between papillary thyroid cancer and thyroid nodules with satisfactory sensitivity and specificity, thus, it is of great value in clinical diagnosis and treatment.
Keywords: Papillary thyroid cancer, thyroid nodules, ultrasound imaging, pathology
Introduction
Papillary thyroid cancer and thyroid nodules are both common diseases, and thyroid papillary cancer accounts for about 74%-80% of all thy-roid cancer [1]. Papillary thythy-roid cancer is often misdiagnosed with thyroid nodules due to its low malignancy and slow growth, thus further treatment is often delayed [2]. CT scan and MRI are limited in the diagnosis of papillary thyroid cancer. Ultrasound is the most common diag-nostic tool for thyroid diseases; however, tradi-tional ultrasound is limited in the differential diagnosis of thyroid tumors. But with the appli-cation of ultrasound with modified high-fre-quency probe and color Doppler, the diagnosis of thyroid diseases is greatly improved. In recent years, the application of new contrast agents and contrast-enhanced ultrasound (CEUS) significantly improves the detection of microperfusion in tissues [3], however, CEUS is
still in the exploratory phase. In this study, the CEUS images of papillary thyroid cancer and thyroid nodules were analyzed and evaluated, in order to improve its diagnostic value for papil-lary thyroid cancer in the future.
Materials and methods
Subjects
papillary thyroid cancer group, there were 41 males and 49 females, aging from 25 to 72 years with mean age of 41.29±18.36 years. In thyroid nodule group, there were 46 males and 44 females, aging from 21 to 68 years with mean age of 45.82±15.36 years. There were no significant differences of gender, age, tumor shape, tumor border, echo, calcification, blood flow changes or lymph node metastasis bet- ween the two groups of patients (P>0.05). Bio- psy was obtained before and after surgery. Prior written and informed consent were obta- ined from every patient’s family and the study was approved by the ethics review board of Taicang First People’s Hospital.
Equipment and material
Color Doppler ultrasound (Philips-iU22, Nether- lands) was used with PM/IP imaging software and CS-2 probe (frequency of 4-9 MHZ). Mechanical index (MI), depth gain control DGC remained same during CEUS in all patients. The ultrasound host was Baishengmeili 90 with LA522 probe. The contrast agent Sono Vue (59 mg, BRACCO company, Italy) was used and diluted with 5 ml saline solution.
Operation method
All patients were in neck extension position to expose thyroid. An experienced sonographer operated ultrasound to observe the thyroid lobe, isthmus, and tumor foci to examine their location, shape, border, internal echo and CEUS. Bolus of 4.8 ml 0.9% saline diluted con-trast was injected into elbow vein. With mechan-ical index of 0.05-0.08, single focus was placed on the edge of tumor and the gain was adjusted to inhibit the background echo of thyroid. The
Leica TP1020 tissue dehydration machine (Le- ica Microsystems, Wetzlar, Germany), Germany Leica2135 slicer (Leica Microsystems, Wetzlar, Germany), Japan OlympusBX51 and BX41 microscope (Olympus optical Co., Ltd., Tokyo, Japan) was used. All surgical removed sentinel lymph nodes performed rapid frozen biopsy. The tissue was fixed with 10% neutral formalin and embedded by paraffin for routine patholo-gy examination.
Image indicators and analysis
Ultrasound images of echo, shape, calcifica-tion, systolic peak velocity (Vmax), and resis-tance index (RI) were recorded and analyzed. CEUS indicators include lesion morphology, enhanced lesion border, homogeneous enhan- cement, perfusion defects and enhancement degree. The enhancement degree was catego-rized as Grade I (the enhancement of surround-ing tissues was significantly increased than that of tumor), Grade II (the enhancement of surrounding tissues was the same of tumor), and Grade III (the enhancement of tumor was significantly increased than that of surrounding tissues). Contrast-enhanced lesion diameters before and after CEUS were also recorded. The tumor lesion was analyzed by PM/IP image software for time-intensity curve and quantita-tive parameters.
Diagnostic value of CEUS
[image:2.612.90.385.86.202.2]Presence of each of the following indications scored one point in the CEUS scoring system (0-5) [4]: irregular lesion shape, unclear lesion border, strong enhancement, heterogeneous enhancement, and perfusion defects. The Table 1. Basic demographics of two groups
Basic demographics cancer group (n=90)Papillary thyroid Thyroid nodule group (n=90) P
Age (years) 41.29±18.36 45.82±15.36 P>0.05
Gender (male/female) 41/49 46/44 NS
Number of lesions 122 131 NS
Size of lesions (≤1 cm/>1 cm) 65/57 54/79 P>0.05
Calcifications (Yes/No) 24/66 31/59 P>0.05
Echo (strong/moderate/weak) 32/56/34 24/68/39 P>0.05
Blood CDFI) (fast/slow) 112/10 58/73 P>0.05
Note: CDFI: Color Doppler flow imaging. Age is presented as mean ± standard devia-tion. NS: no significance. P<0.05 was considered statistical significant.
max section was selected and contrast mode was set to continuous monitor the perfusion peak and with-drawal of dynamic contrast agent, the enhancement level of lesions, enhanced mode and surrounding tis-sues. All images were st- ored in the hard disk and analyzed by the two inde-pendent sonographers.
pathology was scored as 0 (benign) or 1 (malig-nant). We assume CEUS score of 3-5 and pathology identified malignancy as true posi-tive (TP); CEUS score of 1-2 and pathology iden-tified benign as true negative (TN); CEUS score of 3-5 and pathology identified benign as false positives (FP); CEUS score of 1-2 score points and pathology identified malignant as false negative (FN). The ROC curve was drawn to determine the diagnostic value of CEUS.
Statistical analysis
SPSS17.0 software (IBM Corp, Chicago, IL,, USA) was used for data analysis. Quantitative data approximates a normal distribution and presented as means ± standard deviation. T-test was used for group comparison, with
P<0.05 considered as statistically significant. ROC AUC was used to analyze sensitivity and specificity.
Results
Ultrasound indicator comparisons between two groups
To determine the different characteristics, ultr- asound indicators were compared between gr- oups. There were significant differences in tu- mor shape, border, echo, and calcification bet-
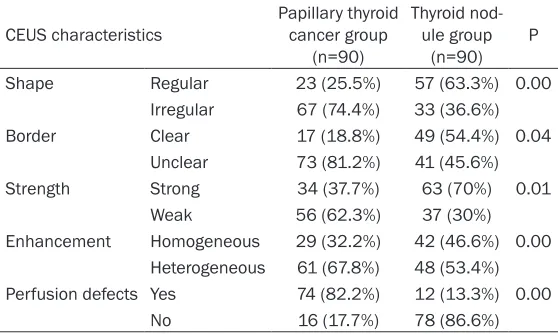
[image:3.612.88.526.84.133.2]To determine the features of papillary thyroid cancer and thyroid nodules in CEUS, the char-acteristics of two groups were compared, as in Table 3. The CEUS of papillary thyroid showed irregular shape, strong and heterogeneous enhancement, unclear border and focal perfu-sion defects. Those signs were more in papil-lary thyroid cancer patients, accounting for 74.4% of irregular lesion shape, 81.2% of un- clear lesion border, 62.3% of strong enhance-ment, 67.8% of heterogeneous enhanceenhance-ment, and 82.2% of perfusion defects, indicating the abnormal signs in CEUS were higher than that in thyroid nodule group.
CEUS and pathology results
To determine the enhancement, peak index and time to peak, two groups underwent CEUS and were diagnosed by biopsy or postoperative pathology. The representative images were shown in Figure 1. There were no adverse reac-tions or side effects during the inspection. There were 106 out of 122 cases with strong and heterogeneous enhancement, and 98 cases with perfusion defects. In thyroid nodule group, out of the 131 benign nodules there were 119 cases with homogeneous enhance-ment, 7 cases with annular enhanceenhance-ment, 4 case of heterogeneous enhancement, and 1 case of strong enhancement. There were sta-Table 2. Comparison of clinical indicators between two groups
Gender Shape Echo Calcification V-max RI
Papillary thyroid cancer group 1.53±0.510.51 12.53±2.512.51 18.23±7.367.36 32.41±12.6312.63 38.63±11.5211.52 2.56±0.780.78
Thyroid nodule group 1.48±0.190.19 17.53±4.654.65 19.17±8.638.63 21.34±11.2411.24 24.37±9.559.55 1.56±0.460.46
[image:3.612.90.369.168.335.2]P 0.001 0.023 0.032 0.000 0.001 0.000
Table 3. CEUS characteristics of two groups (%)
CEUS characteristics Papillary thyroid cancer group (n=90)
Thyroid nod-ule group
(n=90) P Shape Regular 23 (25.5%) 57 (63.3%) 0.00
Irregular 67 (74.4%) 33 (36.6%) Border Clear 17 (18.8%) 49 (54.4%) 0.04
Unclear 73 (81.2%) 41 (45.6%) Strength Strong 34 (37.7%) 63 (70%) 0.01
Weak 56 (62.3%) 37 (30%) Enhancement Homogeneous 29 (32.2%) 42 (46.6%) 0.00
Heterogeneous 61 (67.8%) 48 (53.4%) Perfusion defects Yes 74 (82.2%) 12 (13.3%) 0.00
No 16 (17.7%) 78 (86.6%)
ween two groups (P<0.05) (Ta- ble 2). The artery peak systolic velocity (Vmax) was 38.63± 11.52 and RI was 2.56±0.78 cm/s of patients in papillary thy-roid cancer group; while the artery peak systolic velocity (Vmax) was 24.37 and RI was 1.56±0.46 cm/s of patients in thyroid nodule group. It indicat-ed that Vmax and RI were statis-tically significant between the two groups (P<0.05).
tistical significant differences between two groups (P=0.000). The peak index and time to peak (TTP) of time-intensity curve were 6.43± 1.68 and 5.77±1.73 in papillary thyroid cancer group, and 5.54±1.36, 4.89±1.72 in thyroid nodule group, with no statistical significance (P>0.05). This result indicates that enhance-ment was of greater diagnostic value for thyroid cancer.
ROC curve of CEUS and pathology score for the two groups
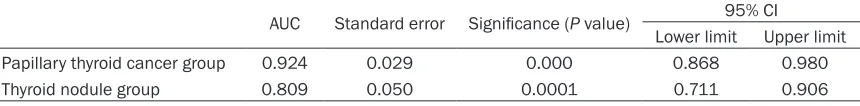
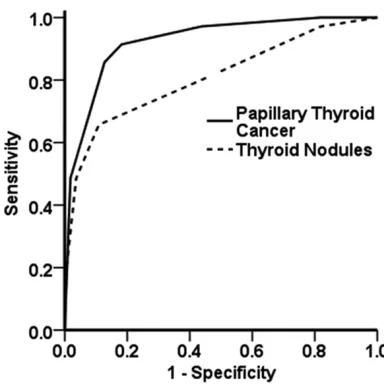
To determine the diagnostic value of CEUS, ROC curve was drawn by SPSS17.0 software for sensitivity and specificity analysis based on ultrasound image and pathology score. It sh- owed that CEUS was of high sensitivity and specificity for both groups. The AUC for papillary thyroid cancer group and thyroid nodule group was 0.924 and 0.806, respectively (Table 4). In this study, compared with AUC=0.5, CEUS was of great diagnostic value for papillary thyroid
cancer (P=0.000), and less value for diagnosis of thyroid nodules (P=0.0001), with significant difference, as shown in Figure 2.
Discussion
[image:4.612.91.523.73.261.2]Thyroid cancer is one of the most common types of cancer, and papillary thyroid cancer is the most common type for malignant thyroid cancer, accounting for about 60% to 80% of all thyroid cancers with 5-year survival rate of about 60% to 90% [5]. Therefore, early diagno-sis is of great importance for patient’s survival. Currently predisposing factors for papillary thy-roid cancer and thythy-roid nodules remain unclear, and are generally believed to be associated with hormone, genes, and environment [6]. The primary symptoms for both diseases are pain-less mass in neck that can move up and down when swallowing. Some patients feel hoarse-ness, dysphagia and pressure. In ultrasonogra-phy, it showed irregular shape, unclear border and calcification. The sensitivity and specificity
Figure 1. The time-intensity curve of CEUS for both groups. Papillary thyroid cancer group (A-C). (A) CEUS enhanced images, expressed as heterogeneous enhancement. (B) Time-intensity curve, expressed as “fast forward and fast backward” blood flow. (C) HE staining image. Thyroid nodules group (B-D). (D) CEUS enhanced images, expressed as heterogeneous enhancement. (E) Time-intensity curve, expressed as “fast forward and flow backward” blood flow. (F) HE staining image.
Table 4. ROC analysis of the two groups
AUC Standard error Significance (P value) Lower limit95% CIUpper limit
Papillary thyroid cancer group 0.924 0.029 0.000 0.868 0.980
Thyroid nodule group 0.809 0.050 0.0001 0.711 0.906
[image:4.612.92.522.357.410.2]of CEUS is increasing in the diagnosis of thyroid tumors, along with the increasing development of imaging, the wide application of high-fre-quency probe, color and spectral Doppler, and the increasingly experienced sonographer [7]. At present, CEUS is mostly used in the diagno-sis of malignant nodules with controversial diagnostic value [8, 9]. Currently, thyroid blood flow is an important indicator in differentiating benign and malignant thyroid tumors, however not all blood flow can be measured by ultra-sound, such as small tumor with immeasurable blood flow, thus identification of tumor malig-nancy can be difficult [10]. CEUS aims to increase vascular contrast when the contrast agent was injected into the vascular for more significant blood vessels and blood flow. Ultrasound images of benign thyroid nodules showed regular shape, clear border, high echo and calcification, especially calcification of the edge, which is significant different from papil-lary thyroid cancer. The artery peak systolic velocity (Vmax) and RI of papillary thyroid can-cer are significantly higher than that of thyroid nodules (P<0.05), which is consistent with many studies [6]. It is shown that CEUS of thy-roid cancer present as “fast forward and fast backward” blood flow with mainly high enhance-ment [11, 12]. However, Xiaolong Shi et al [13] showed papillary thyroid cancer lack blood sup-ply in CEUS. The above controversial studies may result from different pathology types of thyroid cancers. In this study, papillary thyroid
cancer was chosen in order to avoid the bias of different pathology types, and compare them with thyroid nodules. It is shown that irregular lesion shape, unclear lesion border, strong enhancement, heterogeneous enhancement, and perfusion defects were significantly higher in papillary thyroid cancer that of thyroid nodule group, indicating CEUS is of great diagnostic sensitivity and specificity when compared with traditional ultrasound. Ultrasound only cannot distinguish between benign or malignant thy-roid tumors, leading to non-specific diagnostic criteria.
The capillaries are rich in thyroid thus normal thyroid parenchyma can be enhanced fast and evenly after intravenous injection of contrast agent. However, papillary thyroid cancer and thyroid nodular are different from the normal parenchyma [8, 14]. It is shown [8, 14] that ultrasound contrast time - intensity curve can demonstrate vessel formation in lesion. CEUS of papillary thyroid cancer showed lack of blood supply and heterogeneous enhancement, ma- inly as small vessel formation, while CEUS of benign tumor showed only diffuse angiogene-sis, which is consistent with other studies [5, 15]. In consistent with the above studies, in this study, papillary thyroid cancer presents as het-erogeneous enhancement, and benign thyroid nodules presents as homogeneous enhance-ment. From analysis of ROC curve, CEUS showed great diagnostic value for papillary thy-roid cancer and thythy-roid nodules. CEUS was of great sensitivity and specificity of papillary thy-roid cancer with significant importance. In conclusion, ultrasound is of great impor-tance in differential diagnosis of thyroid diseas-es, and CEUS’s application in diagnosis of thy-roid disease should be standardized and further explored. In this study, CEUS is of high sensitivity and specificity in the diagnosis of thyroid papillary cancer, but its clinical applica-tion remains in exploratory stage that should be further used in the differential diagnosis of thyroid tumors.
Acknowledgements
[image:5.612.92.284.70.263.2]We would like to thank Professor Cai Chang from Department of Ultrasound, Shanghai Tumor Hospital of Fudan University, for his devoted efforts in preparation of manuscript.
Disclosure of conflict of interest None.
Address correspondence to: Zheng Zhu, Department of Ultrasound, Taicang First People’s Hospital, No. 58 Changsheng South Road, Taicang 215400, Jiangsu Province, P. R. China. Tel: +86-18915778778; E-mail: cvq999@126.com
References
[1] He C, Zhang J and Xing Y. Diagnosis and treat-ment of thyroid papillary carcinoma. Modern Diagnosis & Treatment 2006; 17: 290-292. [2] Shen L. The clinical importance of ultrasound
diagnosis for Hashimoto’s thyroiditis with dif-fuse nodular. Chinese Continued Medical Edu-cation 2015; 7: 187-188.
[3] Anil G, Hegde A and Chong FH. Thyroid nod-ules: risk stratification for malignancy with ul-trasound and guided biopsy. Cancer Imaging 2011; 11: 209-223.
[4] Giusti M, Orlandi D, Melle G, Massa B, Silvestri E, Minuto F and Turtulici G. Is there a real diag-nostic impact of elastosonography and con-trast-enhanced ultrasonography in the man-agement of thyroid nodules? J Zhejiang Univ Sci B 2013; 14: 195-206.
[5] Zhou Q and Du X. The diagnostic value of CEUS in papillary thyroid carcinoma. Chinese Journal of Ultrasound Medicine 2011; 27: 595-597. [6] Liu M and Hao Y. Clinical value of ultrasound
diagnosis of small papillary thyroid carcinoma and nodule. Chinese Continued Medicine 2015; 7: 39-40.
[7] Zhang D, Lu S, Wang S and Ch S. Study on CDFI and Doppler Spectra in Thyroid Lumps Compared with Pathology. Chinese Journal of Ultrasound in Medicine 2004; 20: 256-258.
[8] Bartolotta TV, Midiri M, Galia M, Runza G, At-tard M, Savoia G, Lagalla R and Cardinale AE. Qualitative and quantitative evaluation of soli-tary thyroid nodules with contrast-enhanced ultrasound: initial results. Eur Radiol 2006; 16: 2234-2241.
[9] Song H and Wang D. CEUS analysis of solitary thyroid nodules. China Medical Imaging Tech-nology 2008; 24: 44-47.
[10] Yang S and Qian C. Contrast ultrasound quan-titative analysis of thyroid nodule perfusion. Chinese Journal of Ultrasound Imaging 2011; 20: 38-40.
[11] Gu J and Chen H. Preliminary exploration of CEUS diagnosis on thyroid tumors. China Med-ical Imaging Technology 2008; 24: 1018-1020.
[12] Yuan H and Wang D. Quantitative analysis of CEUS for thyroid nodules. China Clinic Medical Imaging 2008; 19: 427-428.
[13] Shi X and Zheng X. Analysis of CEUS and pa-thology for thyroid tumors. Zhejiang Practical Medicine 2007; 12: 87-88.