VRep at SemEval-2016 Task 1 and Task 2: A System for Interpretable
Semantic Similarity
Sam Henry and Allison Sands Computer Science Department Virginia Commonwealth University
Richmond, VA 23284, USA [email protected]
Abstract
VRep is a system designed for SemEval 2016 Task 1 - Semantic Textual Similarity (STS) and Task 2 - Interpretable Semantic Textual Similarity (iSTS). STS quantifies the seman-tic equivalence between two snippets of text, and iSTS provides a reason why those snip-pets of text are similar. VRep makes ex-tensive use of WordNet for both STS, where the Vector relatedness measure is used, and for iSTS, where features are extracted to cre-ate a learned rule-based classifier. This pa-per outlines the VRep algorithm, provides re-sults from the 2016 SemEval competition, and analyzes the performance contributions of the system components.
1 Introduction
VRep competed in SemEval 2016 Task 1 - tic Textual Similarity (STS) and Task 2 - Seman-tic Interpretable Textual Similarity (iSTS). Both of these tasks compute STS between two fragments of text. Task 2 expands upon Task 1 by requiring a rea-son for their similarity. VRep uses an STS measure based on the Vector relatedness measure (Pedersen et al., 2004), and a reasoning system based on JRIP (Cohen, 1995), an implementation of the iREP algo-rithm.
For Task 1, we are provided with paired sen-tences, and for each pair of sentences VRep assigns a number indicating their STS. The number ranges from 0 to 5, 0 indicating no similarity and 5 indicat-ing equivalence.
For Task 2, we are provided with paired sentences and align the chunks of one sentence to the most
similar chunks in the other sentence. Next, a reason and score are computed for that alignment. A chunk is a fragment of text that conveys a single meaning such as in the following example for which chunks are bracketed.
[ Black Cow ] [ walking ] [ in a pasture ] [ Black and white Cow ] [ sitting ] [ in the grass ]
Alignment reasons are selected from a small list of possible labels created by the event organizers (Agirre et al., 2015):
1. Equivalent (EQUI) - the two chunks convey an equivalent meaning (“hot water”, “scalding wa-ter”)
2. Opposite (OPPO) - the two chunks convey an opposite meaning (“hot water”, “cold water”)
3. More General (SPE1) - this chunk conveys a more general meaning than the other chunk (“hot water”, “water”)
4. More Specific (SPE2) - this chunk conveys a more specific meaning than the other chunk “water”, “hot water”)
5. Similar (SIMI) - the two chunks convey a sim-ilar meaning (“sip water”, “gulp water”)
6. Related (REL) - the two chunks are somehow related (“boil water”, “ocean water”)
7. No Alignment (NOALI) - there are no chunks in the other sentence that are semantically sim-ilar to this chunk
As in Task 1 the scores range from 0 to 5, 0 in-dicating no similarity and 5 inin-dicating equivalence. VRep makes extensive use of WordNet (Fellbaum, 2005) to compute STS and assign a label in iSTS. Vrep is written in Perl and is freely available for download1.
2 Algorithm Description
The same measure of STS is used for both Task 1 and Task 2; however, the algorithm for Task 1 is sim-pler and consists of only the first two steps: Prepro-cessing and Semantic Textual Similarity. The steps are outlined below and are expanded on in subse-quent subsections.
1. Preprocessing - text is standardized
2. Semantic Textual Similarity - the STS between two chunks or two sentences is computed. This is the final step for Task 1.
3. Chunk Alignment - align each chunk of one sentence to a chunk in another sentence. If no chunks are similar then no alignment (NOALI) is assigned.
4. Alignment Reasoning - assign a label to each aligned chunk pair
5. Alignment Scoring - assign an alignment score on a 0-5 scale
2.1 Preprocessing
In the first step, data is prepared for processing as outlined below:
1. Tokenization - spaces are used as a delimiter
2. Lowercase All Characters - standardizes string equivalence testing and prevents incorrect part of speech (POS) tagging. The POS tagger tends to tag most words that have a capital letter as a proper noun which is often incorrect. This is particularly problematic with the headlines data set.
3. Punctuation Removal - standardizes string equivalence testing
1http://www.people.vcu.edu/ henryst/
4. POS tagging - Lingua::EN::Tagger2 is used.
POS tags are used for stop word removal and for alignment reasoning.
5. Stop Word Removal - remove any words that are not tagged as a noun, verb, adjective, or adverb. This reduces chunks and sentences to content words.
2.2 Semantic Textual Similarity (STS)
STS is computed in the same way for both tasks; however it is computed between two sentences for Task 1 and between two chunks for Task 2. While describing the computation of STS we refer to chunks; for Task 1 a sentence can be conceptual-ized as a chunk. VRep’s STS computation is shown in Equation (1) and is similar to the method de-scribed by NeRoSim (Banjade et al., 2015) and Stefanescu (S¸tef˘anescu et al., 2014). chunkSim
takes two chunks (c1, c2) as input and computes the
weighted sum of maximum word to word similar-ities, sim(wi, wj). To do this, the sim(wi, wj) is found for each word inc2 againstc1, and the
maxi-mum is added to a running sum.
chunkSim(c1, c2) =
Pn
i=1maxmj=1sim(wi, wj)
min(n, m) (1)
wherec1andc2are two chunks,nandmare the number of words in
c1andc2,wiis wordiofc1,wjis wordjofc2
sim(wi, wj) is defined differently for words in WordNet and words not in WordNet. For words in WordNet, sim(wi, wj) is the Vector relatedness measure3 (Pedersen et al., 2004) with a threshold
applied. The Vector measure was chosen for several reasons. Firstly it returns values scaled between 0 and 1 which is beneficial for applying thresholds in both chunk alignment and alignment reasoning. A known scale also allows for a direct mapping from the weighted sum to the answer space of Task 1 (scaled 0-5). Secondly the Vector measure works well whenwiandwjare different parts of speech be-cause it does not rely on WordNet hierarchies. When calculatingsim(wi, wj) all possible senses of both
wi andwj are used, and sim(wi, wj) is chosen as
the maximum value. This eliminates the need for word sense disambiguation (WSD). After comput-ing the measure, a threshold is applied that reduces any value less than0.9to0.0. This value was tuned separately using the training data for both tasks via a grid search and0.9was found to be optimum for both. The threshold prevents dissimilar terms from impacting the STS which improves the accuracy and prevents noisy chunk alignments.
For words not in WordNet,chunkSim(wi, wj)is a binary value: 1if all the characters in both words match,0 otherwise. Words not in WordNet tend to be proper nouns, abbreviations, or short words such as “he” or “she”, “is” or “in”, all of which are gener-ally spelled identicgener-ally making this a suitable mea-sure.
chunkSim is defined as the sum of maximum word to word similarities normalized by the number of words in the shorter of the chunk pair. Normal-ization prevents similarity scores from increasing as chunk length increases. It also scales chunkSim
within a predictable range of about0.0−1.0. chunkSimis used directly in Task 1 where it is
linearly scaled by5to produce final output. We perimented with multiple regression fits (linear, ex-ponential, logarithmic, power, and polynomial) be-tween ourchunkSimoutput and the provided gold
standard values with little to no improvement, so the linear scaling of5was chosen for simplicity.
2.3 Chunk Alignment
chunkSim is computed between each chunk of two aligned sentences and the chunk with the high-est chunkSim is selected for alignment.
Multi-ple alignments are allowed for a single chunk. If all chunks have a similarity of 0, no alignment (NOALI) is assigned. Due to the highsim(wi, wj) threshold, no threshold is required forchunkSimas with NeRoSim(Banjade et al., 2015).
2.4 Alignment Reasoning
Alignment Reasoning takes as input a chunk pair and provides a reason why that chunk pair is aligned. VRep’s alignment reasoning is inspired by NeRoSim (Banjade et al., 2015), and SVCTSTS (Karumuri et al., 2015). Both these systems clas-sify a chunk pair using features extracted from the chunk pair itself. NeRoSim’s features tend to focus
more on the semantic relationship between chunk pairs, such as whether or not the two chunks contain antonyms, synonyms, etc. The features of SVCSTS focus more on the syntactic form of the chunks, such as the number of words or counts of parts of speech in a chunk pair. VRep combines the two approaches and extracts a total of72syntactic and semantic fea-tures for each chunk pair.
Gold Standard chunk pairs of the SemEval 2015 Task 2 Test Data4 were used to train our classifier,
WEKA’s (Hall et al., 2009) JRIP algorithm (Cohen, 1995) which creates a decision list for classification. The classifier uses only 24 of original 72 features and a series of10rules.
JRIP was chosen as a classifier due to its perfor-mance (see Table 5), and its concision. The rules generated are human readable which provides in-sight into how the classification occurs and the types of features that are discriminative. Classifiers were trained with chunk pairs from every data set (stu-dent answers, headlines, and images), both individ-ually and combined. The best performing classi-fier for each topic was generated from the combined data. The set of features used and classification rules are shown below. αandβ designate the individual
chunks in the chunk pair being classified, andx~i in-dicates a feature vector created from a chunk pair.i
indicates the feature number in the feature list below. Features used in Classification:
1 - unmatched content word percentage ofα
2 - unmatched content word percentage ofβ
3 - 1 ifαcontains a location
4 - 1 ifβ contains a location
5 - 1 ifαhas a verb 6 - 1 ifαhas an adjective
7 - 1 ifαhas an adverb
8 - 1 ifαandβcontain antonyms 9 - 1 ifαandβhave a equivalent nouns
10 - 1 ifαandβcontain numeric quantities
11 - number of words inα(before stop word removal)
12 - number of words inβ(before stop word
removal)
13 - ratio of the number content words to all words inα(before stop word removal)
4http://alt.qcri.org/semeval2016/task2/data/uploads/train
14 - difference in number of content words inα
andβ
15 - difference in number of words inαandβ
(before stop word removal)
16 - absolute value of the difference in number of content words inαandβ
17 - absolute value of the difference in number of words inαandβ(before stop word removal)
18 - ratio of the number of content words inαto all words inα(before stop word removal)
over the ratio of the number of content words inβto all words inβ(before stop word removal)
19 - number of nouns inβ
20 - ratio of the number of nouns inαto the number of content words inα
21 - ratio of the number of verbs inαto the
number of content words inα
22 - ratio of the number of adjectives inαto the
number of content words inα
23 - ratio of the number of conjunctions inαto the number of content words inα
24 - difference in the number of verbs inαandβ
Algorithm 1Alignment Reasoning Rules 1: ifx~8≥1&x~22≥1
2: orx~8≥1&x~4≥1&x~5≥1&x~16≥1 3: orx~8≥1&x~23≥ 12&x~1≥ 12
4: orx~21≥12 &x~7≥1&x~12≤1
returnOPPO
5: ifx~2≥13 &x~14≤ −1&x~9≥1&x~19≤0
&x~13≥ 47
returnSPE2
6: ifx~14≥1&x~9≥1&x~2≤0&x~6≥1
&x~11≤4&x~24≤0 7: orx~14≥1&x~17≥2&x~13≥ 57
8: orx~15≥1&x~18≥ 98&x~2≤0&x~3≥1 9: or 1
4 ≤x~1≤ 2
3&x~14≥1&x~5≤0
&x~20≤ 15&x~18≤1&x~13≥ 23
returnSPE1
10: ifx~2≥12 &x~1≥ 13 &x~10≥1
returnSIMI
11: returnEQUI
It is interesting to note that there is no classifier for the REL class. The data set was heavily skewed to-wards the EQUI class which consisted of60%of the total data, leaving a small percentage to be divided among the remaining5classes, with just around5% being REL. With a larger training set we would
ex-pect a classifier for REL to be generated.
2.5 Alignment Scoring
Alignment scores are assigned as either the required scores,0for NOALI and5or EQUI, or the average alignment score for each class as in (Karumuri et al., 2015). The average alignment score for classes were computed both for each topic alone and for all topics combined. The best performing set of scores came for all topics, came from the images data set alone. Scores used for each class are as follows: EQUI = 5.00, OPPO = 4.00, SPE1 = 3.24, SPE2 = 3.69, SIMI = 2.975, REL = 3.00, NOALI = 0.00.
3 Results
The performance of VRep is shown below for Se-mEval 2016 Task 1 and Task 2 test data sets. The baseline described by the task organizers (Agirre et al., 2015) is shown for comparison for Task 2. Base-line results were not made available for Task 1.
3.1 Task 1 - Semantic Similarity
For Task 1 the Pearson Correlation Coefficient be-tween VRep’s results and Gold Standard results are reported for the 2016 Task 1 Test Data5. A value
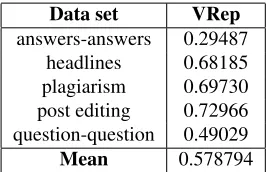
of1.0indicates perfect correlation,0.0indicates no correlation. We ran VRep on five data sets with the results of each data set shown in Table 1. More tails on the data sets and evaluation metrics are de-scribed in the competition summary6.
Data set VRep
answers-answers 0.29487
headlines 0.68185
plagiarism 0.69730
post editing 0.72966
question-question 0.49029
[image:4.612.360.493.490.576.2]Mean 0.578794
Table 1:Results of VRep on SemEval 2016 Task 1 Test Data
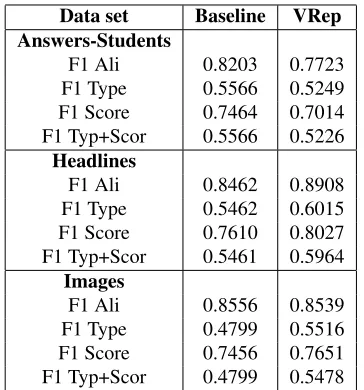
3.2 Task 2 - Interpretable Semantic Similarity For Task 2, we report results for the Gold Chunks scenario (data is pre-chunked). Each data set is eval-uated using the F1 score in four categories:
5
http://alt.qcri.org/semeval2016/task1/data/uploads/sts2016-english-with-gs-v1.0.zip
(Ali)- Alignment - F1 score of the chunk alignment
(Type)- Alignment Type - F1 score of the alignment reasoning
(Score)- Alignment Scoring - F1 score of alignment scoring
(Typ+Scor)- Alignment Type and Score - a combined F1 score of alignment reasoning and scoring
F1 scores range from 0.0 to 1.0 with 1.0 being the best score. Data sets are available online7 and
evaluation metrics are described in more detail in the competition summary (Agirre et al., 2015).
Data set Baseline VRep
Answers-Students
F1 Ali 0.8203 0.7723
F1 Type 0.5566 0.5249
F1 Score 0.7464 0.7014
F1 Typ+Scor 0.5566 0.5226
Headlines
F1 Ali 0.8462 0.8908
F1 Type 0.5462 0.6015
F1 Score 0.7610 0.8027
F1 Typ+Scor 0.5461 0.5964
Images
F1 Ali 0.8556 0.8539
F1 Type 0.4799 0.5516
F1 Score 0.7456 0.7651
[image:5.612.95.277.254.449.2]F1 Typ+Scor 0.4799 0.5478
Table 2:Results of VRep on SemEval 2016 Task 2 Test Data
4 Component Analysis
In this section the contributions of system compo-nents and possible additions are evaluated. VRep can be split into two major components, STS and Alignment Reasoning, both of which have different evaluation criteria. Data used for this section comes from the SemEval 2015 Task 18 training data and
SemEval 2016 Task 29training data. Two-Tailed
p-values are shown in the Tables 3 and 4.
7http://alt.qcri.org/semeval2016/task2/data/uploads/
test goldstandard.tar.gz
8http://ixa2.si.ehu.es/stswiki/images/2/21/STS2015-en
-rawdata-scripts.zip
9http://alt.qcri.org/semeval2016/task2/data/uploads/train
2015 10 22.utf-8.tar.gz
LevenshteinM easure= (β−δ
β δ < β
0 δ≥β (2)
whereδis the Levenshtein distance between the two words, andβis the threshold used
4.1 STS Component Analysis
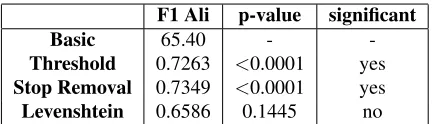
Pearson Correlation Coefficients of STS scores of Task 1 and the F1 Ali Task 2 are used as evaluation metrics for the STS portion of VRep. Tables 3 and 4 show the effects of adding a component to theBasic
system. Each component and theBasicsystem are described below:
1. As a baseline a Basic system which only ap-plies Equation (1) is used. For Task 1 the re-sult is scaled by 5. For Task 2 each chunk is aligned with the chunk with the highest
chunkSim. No thresholding, or preprocessing
is performed.
2. Threshold adds a threshold to sim(wi, wj) in Equation (1). A modest threshold of0.4 was used. The optimum threshold of 0.9 used in the final system was found with the system as a whole. We did not perform a grid search to optimize the threshold for all component tests.
3. Stop Removal adds stop word removal as de-scribed in subsection 2.1.
4. Levenshtein modifies sim(wi, wj) for words not in WordNet. Rather than using a binary value for exact string matching the Levenshtein measure shown in Equation (2) is used. This al-lows for slight differences in spelling, plurality, tenses, etc. The measure requires a threshold parameter,βwhich limits the maximum
Leven-shtein distance (δ) and scales the Levenshtein
F1 Ali p-value significant
Basic 65.40 -
-Threshold 0.7263 <0.0001 yes Stop Removal 0.7349 <0.0001 yes
[image:6.612.78.295.56.118.2]Levenshtein 0.6586 0.1445 no
Table 3:The effects of additional components to the core VRep system on Task 1
F1 Ali p-value significant
Basic 0.7508 -
-Threshold 0.8812 <0.0001 yes
Stop Removal 0.7511 0.9920 no
Levenshtein 0.7524 0.7795 no
WSD 0.7799 <0.0001 yes
Threshold + WSD 0.8216 <0.0001 yes
Table 4: The effects of components to the core VRep system on Task 2
5. Word Sense Disambiguation (WSD) should help to reduce noisy alignments by using the correct synset when computing the Vector re-latedness measure. We used the entire sentence (all chunks) as input to SenseRelate::AllWords (Patwardhan et al., 2003). WSD improves re-sults when used as a single component, but when used in combination with a threshold (Threshold + WSD) results are worse than a threshold alone. This is likely due to the fact that both WSD and thresholding aim to reduce noisy STS and chunk alignments. When used singularly they both achieve this task, but in combination WSD errors reduce performance.
Analysis of the test data indicated that the ad-dition of these extra components was unnecessary, however to further analyze their contributions three runs were submitted for the both tasks 1 and 2. Run 1 used thebasicsystem, run 2 eliminated the stop removal preprocessing step, and run 3 used the ba-sic system with theLevenshtein measure described above. Test results were mixed and data set de-pendant, see the respective competition summaries (Agirre et al., 2016) for complete results.
4.2 Alignment Reasoning Component Analysis For alignment reasoning, only the assignment of a label (Type) to a chunk pair is evaluated. We used the gold standard alignments provided for each data set, converted each gold standard chunk pair to the
Answers Headlines Images
Baseline 67.9 61.4 54.2
Naive Bayes 23.9 41.5 35.1
Bayes Net 49.3 58.9 51.3
SMO 69.6 65.7 54.9
Decision Table 67.5 65.7 55.8
J48 66.1 64.9 52.7
Random Forest 68.4 65.8 53.6
[image:6.612.313.541.56.167.2]JRip 68.9 65.4 56.2
Table 5:The performance of different classifiers on alignment reasoning
entire set of 72 features and tested multiple classi-fication algorithms. All classifiers are WEKA (Hall et al., 2009) implementations; results are shown in Table 5. The baseline score is calculated as simply assigning the most common class, EQUI.
5 Conclusions and Future Work
In future iterations, more analysis should be done to refine the features used in classification. Using JRIP and other analysis criteria we can see see why cer-tain features are discriminative, and develop more informative features.
Rather than relying solely on the Levenshtein
measure for words outside of WordNet, additional metrics, such as word2vec (Mikolov et al., 2013) could be incorporated.
Additional data should be added for training clas-sifiers. The top performing classifier was gener-ated from all data combined indicating that addi-tional samples are necessary. It is likely that given more data, topic specific classifiers will outperform the general classifier we evaluated. Additional data will also help to reduce the class imbalance and will likely result in a set of rules for the REL class.
Since VRep already makes use of WordNet, it could be easily expanded to compete in the polarity subtask by implementing a polarity classifier using SentiWordNet (Baccianella et al., 2010).
6 Acknowledgments
References
Eneko Agirre, Carmen Banea, et al. 2015. Semeval-2015 task 2: Semantic textual similarity, english, spanish and pilot on interpretability. InProceedings of the 9th International Workshop on Semantic Evaluation (Se-mEval 2015), June.
Eneko Agirre, Aitor Gonzalez-Agirre, Inigo Lopez-Gazpio, Montse Maritxalar, German Rigau, and Lar-raitz Uria. 2016. Semeval-2016 task 2: Interpretable semantic textual similarity. InProceedings of the 10th International Workshop on Semantic Evaluation (Se-mEval 2016), San Diego, California, June.
Stefano Baccianella, Andrea Esuli, and Fabrizio Sebas-tiani. 2010. Sentiwordnet 3.0: An enhanced lexical resource for sentiment analysis and opinion mining. In LREC, volume 10, pages 2200–2204.
Rajendra Banjade, Nobal B Niraula, Nabin Mahar-jan, Vasile Rus, Dan Stefanescu, Mihai Lintean, and Dipesh Gautam. 2015. Nerosim: A system for mea-suring and interpreting semantic textual similarity. William W. Cohen. 1995. Fast effective rule
induc-tion. InTwelfth International Conference on Machine Learning, pages 115–123. Morgan Kaufmann. Christiane Fellbaum. 2005. Wordnet and wordnets. Mark Hall, Eibe Frank, Geoffrey Holmes, Bernhard
Pfahringer, Peter Reutemann, and Ian H Witten. 2009. The weka data mining software: an update. ACM SIGKDD explorations newsletter, 11(1):10–18. Sakethram Karumuri, Viswanadh Kumar Reddy
Vuggu-mudi, and Sai Charan Raj Chitirala. 2015. Umduluth-blueteam: Svcsts-a multilingual and chunk level se-mantic similarity system.SemEval-2015, page 107. Tomas Mikolov, Ilya Sutskever, Kai Chen, Greg S
Cor-rado, and Jeff Dean. 2013. Distributed representa-tions of words and phrases and their compositionality. InAdvances in neural information processing systems, pages 3111–3119.
Siddharth Patwardhan, Satanjeev Banerjee, and Ted Ped-ersen. 2003. Using measures of semantic related-ness for word sense disambiguation. InComputational linguistics and intelligent text processing, pages 241– 257. Springer.
Ted Pedersen, Siddharth Patwardhan, and Jason Miche-lizzi. 2004. Wordnet::similarity: measuring the relat-edness of concepts. InDemonstration papers at hlt-naacl 2004, pages 38–41. Association for Computa-tional Linguistics.