Graph-based Coherence Modeling For Assessing Readability
Mohsen Mesgar and Michael Strube
Heidelberg Institute for Theoretical Studies gGmbH Schloss-Wolfsbrunnenweg 35
69118 Heidelberg, Germany
(mohsen.mesgar|michael.strube)@h-its.org
Abstract
Readability depends on many factors rang-ing from shallow features like word length to semantic ones like coherence. We intro-duce novel graph-based coherence features based on frequent subgraphs and compare their ability to assess the readability of Wall Street Journal articles. In contrast to Pitler and Nenkova (2008) some of our graph-based features are significantly correlated with hu-man judgments. We outperform Pitler and Nenkova (2008) in the readability ranking task by more than 5% accuracy thus establishing a new state-of-the-art on this dataset.
1 Introduction
Readability depends on many factors which enable readers to process a text. These factors can be used by readability assessment methods to quantify the difficulty of text understanding. Possible applica-tions of readability assessment are automatic text summarization and simplification systems. Measur-ing readability can also be used in question answer-ing and knowledge extraction systems to prune texts with low readability (Kate et al., 2010).
Many different text features have been used to assess readability. They include shallow features (Flesch, 1948; Kincaid et al., 1975), language modeling features (Si and Callan, 2001; Collins-Thompson and Callan, 2004), syntactic features (Schwarm and Ostendorf, 2005) and text flow or coherence (Barzilay and Lapata, 2008; Pitler and Nenkova, 2008). In a coherent text each sentence
has some connections with other sentences. Al-though these local connections make the text more readable, the corresponding coherence features used in Pitler and Nenkova (2008) (Section 2) are not strongly correlated with human judgments.
The main goal of this paper is to introduce novel graph-based coherence features for assessing read-ability. To achieve this goal, we use the entity graph coherence model by Guinaudeau and Strube (2013) (Section 3.1.1) and follow two ideas. The first main idea is to use a graph representation of rhetorical re-lations between sentences of a text (Section 3.1.2) and to merge the entity graph and the rhetorical graph (Section 3.1.3). Hence we enrich the entity graph and consequently consider the distribution of two aspects of coherence (i.e. entities and discourse relations) simultaneously. The second main idea is to apply subgraph mining algorithms to find frequent subgraphs (i.e. patterns) in texts (Section 3.2). Sub-graph mining has been successfully applied to other tasks, e.g. image processing (Nowozin et al., 2007) and language modeling (Biemann et al., 2012). We hypothesize that text coherence correlates with fre-quent subgraphs (vaguely reminding us of coherence patterns (Daneˇs, 1974)) and that the mined patterns are good predictors for readability ratings.
Our study is novel in introducing new and infor-mative graph-based coherence features. We examine the predictive power of these feature in two experi-ments: first, readability rating prediction, and sec-ond, ranking texts according to the readability (Sec-tion 5).
s1 s2 s3 s4 s5
ASSOCIA
TED
PRESS
...
OFFICIALS
POLICY MAKERS
...
W
ASHINGT
ON
B
UREA
UCRA
CY
HOURS GEAR NEWS
...
TABLE MAY
OR
...
CHARLEST
ON
HUGO SENSE
FUNCTIONS
Figure 1: The entity graph representation of the text in Table 1. Dark entities are shared by the sentences.
2 Readability Assessment
The quality of a text depends on different factors which make the text easier to read. These factors range from shallow features like word length to se-mantic features like coherence. Readability assess-ment leads to two problems: distinguishing and rec-ognizing readability levels of texts and predicting human readability ratings.
Pitler and Nenkova (2008) use all entity transi-tions of the entity grid model (Barzilay and Lapata, 2008) as coherence features. They compute the cor-relation between them and readability ratings and show that none of them is significantly correlated with human readability judgments. Indeed, none of these features on its own is a good predictor to mea-sure coherence and to predict readability as well.
3 Method
We introduce the graph representation of a text and propose to use these graphs to model coherence.
3.1 Graphs
3.1.1 Entity Graph
Guinaudeau and Strube (2013) describe a graph-based version of the entity grid (Barzilay and Lap-ata, 2008) which models the interaction between en-tities and sentences as a bipartite graph. This graph contains two sets of nodes: sentences and entities. Sentence and entity nodes are connected if and only if the entity is mentioned in the sentence (Figure 1). Edges are weighted according to the grammatical role of the entity mentioned in the sentence.
Guinaudeau and Strube (2013) model entity tran-sitions between sentences via a one-mode
tion of the entity graph. The one-mode projec-tion is a graph consisting of sentence nodes that are connected if and only if they have at least one entity in common in the entity graph. One-mode projections are directed as they follow the text or-der. Hence, backward edges never occur. Guin-audeau and Strube (2013) introduce three kinds of projections. The unweighted projectionPER
u models the existence of the entity connections between sen-tences. The weighted projectionPER
w uses the num-ber of shared entities by sentences as a weight for the corresponding edge (Figure 2).PER
acc takes the gram-matical function of entities in sentences into account as edge weights. Guinaudeau and Strube (2013) show that PER
acc does not perform well for readabil-ity assessment. It does not outperform PER
w in our
S1:The[Associated] [Press]’s[earthquake] [coverage]
drew[attention]to a[phenomenon]that deserves some
[thought]by public [officials]and other[policy]
[mak-ers].
S2: Private[relief] [agencies], such as the[Salvation]
[Army] and [Red] [Cross], mobilized almost instantly
to help[people], while the[Washington] [bureaucracy]
”took[hours]getting into[gear].”
S3:One[news]show we saw[yesterday]even displayed
25 federal[officials]meeting around a[table].
S4: We recall that the [mayor] of [Charleston] com-plained bitterly about the federal [bureaucracy]’s re-sponse to[Hurricane Hugo].
S5: The [sense]grows that modern public
[bureaucra-cies] simply don’t perform their assigned [functions]
well.
s1
s2
s3
s4
s5
s1
s2
s3
s4
s5
1
1 1 1
PER
[image:3.612.347.506.55.148.2]u PwER
Figure 2: PER
u : unweighted, andPwER: weighted projec-tion graphs. In the weighted projecprojec-tion all edge weights are equal to one, because all sentences share one entity.
experiments as well. Thus, we do explain further details ofPER
w here.
3.1.2 Discourse Relation Graph
Lin et al. (2011) and Lin (2011) use Rhetorical Structure Theory (RST) to describe and model co-herence by considering the transitions between dis-course relations. Inspired by the entity grid they ex-pand the relation sequence into a two-dimensional matrix whose rows and columns are sentences and entities, respectively. The cell hsi,eji corresponds to the set of discourse relations entityej is involved with in sentencesi. These methods are based on en-tity transitions which, however, are intuitively im-plausible, because discourse relations connect sen-tences (or elementary discourse units).
Since discourse relations capture interactions be-tween sentences (Table 2), we model these relations with a graph.
Relation Arg1 Arg2
Implicit Expansion S1 S2 Explicit Comparison S2 S2 Implicit Expansion S2 S3 Implicit Temporal S3 S4 Implicit Contingency S4 S5
Table 2: PDTB-style discourse relations (Prasad et al., 2008) of the sample text in Table 1
A discourse relation graph isPDR
u = (V,R), where
V is the set of sentence nodes and R is the edge set which represents all discourse relations in the text. Two sentence nodes are adjacent if and only if they are connected by at least one discourse rela-tion. Intra-sentential discourse relations are repre-sented as self-edges. We definePDR
w as a weighted discourse relation graph whose edge weights are
s1
s2
s3
s4
s5
s1
s2
s3
s4
s5
1 1
1
1
1
PDR
[image:3.612.111.262.57.150.2]u PwDR
Figure 3:PDR
u : unweighted, andPwDR: weighted discourse relation graphs.
the number of discourse relations between sentence nodes (Figure 3).
3.1.3 Combined Entity and Discourse Relation Graphs
Both projection and discourse relation graphs rep-resent different types of connections. These graphs can be merged by employing basic operators.
We use the ∨ operator (logical OR) to combine the projection graphPER
u with thePuDR graph. The ∨operator takes two sentence nodes and creates an edge between them if they are connected at least by one connection, whether entity transition (PER
u ) or discourse relations (PDR
u ). The other basic logi-cal operators (e.g.∧or⊕) lose connections. Hence we do not report on their performance. Inspired by linear regression models we combine the weighted graphs by adding (+) the edge weights in PER
w and
PDR
w (Figure 4).
s1
s2
s3
s4
s5
s1
s2
s3
s4
s5
1 1
1
1
2 1
1 1
PER
u ∨PuDR PwER+PwDR
Figure 4: Combined entity and discourse relation graphs.
3.2 Coherence Features
We use the proposed graphs to introduce novel co-herence features.
Average outdegree. Measures to which extent a
sentence is connected with other sentences (Guin-audeau and Strube, 2013):
[image:3.612.347.504.465.560.2] [image:3.612.105.267.482.556.2]whereOutDegree(s)is the sum of the weights as-sociated with edges that leave nodesandkSkis the number of sentences in the text.
Number of components. The projection graph
can be disconnected. A graph is disconnected if there are at least two nodes which are not reachable from each other (likes1ands2in Figure 2). A
max-imal non-empty connected subgraph in a graph is calledcomponent. Each projection graph in Figure 2 contains two components. Intuitively, projection graphs of a more coherent text should contain fewer number of components. The outdegree does not cap-ture this type of connectivity. E.g., in Figure 5 the average outdegree of the two graphs is equal, while the left graph contains more components and should be less coherent.
s1 s2 s3 s4
s5
s6
s1 s2 s3 s4
s5
s6
[image:4.612.318.536.56.137.2](a) (b)
Figure 5: Two graphs with the same outdegree value. Graph (a) has two components. It is less coherent.
Frequent subgraphs. We hypothesize that
par-ticular coherence patterns show a correlation with readability. These patterns are encoded as subgraphs in graphs. An advantage is that coherence can be measured beyond simple sentence or node connec-tivity. We first define the graph concepts employed.
Isomorphic.Two graphsGandG0areisomorphic,
if they fulfill two conditions: there should be a one-to-one association between nodes ofG0and those of G, and two nodes ofG0 should be connected, if and
only if their associated nodes inGare connected.
Subgraph. GraphG0is asubgraphof graphG, if G0is isomorphic to a graph whose nodes and edges
are inG.
k-node subgraph. A subgraph with k nodes is calledk-node subgraph.
Induced subgraph. The graph G0 is aninduced subgraphof graphG, ifG0is a subgraph ofGwhose
nodes are connected by all edges which connect the corresponding nodes in G (Figure 6). We always mean induced subgraphs when using the term sub-graph.
Frequent subgraph & minimum support. Letζ= {G1,G2,···,Gn} be a database of n graphs. For
[image:4.612.78.294.280.339.2](a) (b) (c)
Figure 6: Both graphs (b) and (c) are subgraphs of (a). Only (c) is an induced subgraph of (a).
each subgraphsg,support(sg) denotes the number of graphs (inζ) which containsgas a subgraph. A subgraph sg is a frequent subgraph if and only if
support(sg)>λ, whereλ is called minimum sup-port.
Graph signature. Given a set of fre-quent subgraphs {sg1,sg2,...,sgm}, a graph signature for G ∈ ζ is the vector Φ(G) = (ϕ(sg1,G),ϕ(sg2,G),...,ϕ(sgm,G)), where
ϕ(sgi,G) = count(sgi,G)
∑sgj∈(sg1,sg2,...,sgm)count(sgj,G)
Here count(sgi,G) is the number of occurrences of sgi in graph G. We use the relative frequency
ϕ(sgi,G)because it compares graphs with different numbers of nodes and different numbers of edges.
Subgraph features are divided into two categories: basic subgraphs and frequent large subgraphs.
Basic subgraphs. Instead of frequent subgraphs
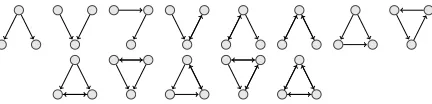
all possible 3-node subgraphs (Figure 7) are used as basic subgraphs because they are the smallest mean-ingful subgraphs that can model coherence patterns.
Figure 7: All possible directed 3-node subgraphs.
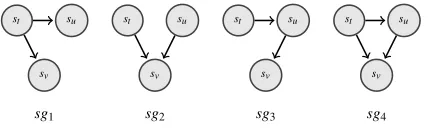
Because backward edges never occur in one-mode projections, only four subgraphs are feasible (Figure 8).
We interpret these subgraphs as follows:
• sg1: The connection between a sentence and
[image:4.612.319.535.513.565.2]st su
sv
st su
sv
st su
sv
st su
sv
[image:5.612.80.294.56.120.2]sg1 sg2 sg3 sg4
Figure 8: Feasible 3-node subgraph coherence features. Node labels illustrate the order of sentences. Sentencest occurs before sentencesu, and sentencesuoccurs before sentencesv(i.e.t<u<v).
• sg2: Indicates that entities inst andsuget con-nected to each other insv.
• sg3: Each sentence tends to refer to the most
prominent entity (focus of attention) in pre-ceding sentences (Sidner, 1983; Grosz et al., 1995). The absence of a connection between
st andsv indicates that the entity connectingst andsuis different from the entity connectingsu andsv. Therefore this subgraph approximately corresponds to the shift of the focus of atten-tion.
• sg4: Mergessg1andsg3and represents all
con-nections of these two subgraphs.
We use these feasible 3-node subgraphs and com-pute the graph signature,Φ, of eachG∈ζ. We pro-pose eachϕ∈Φ(i.e. relative frequency of each sub-graph inG) as a connectivity feature of graphGto measure text coherence.
Frequent large subgraphs. Since we observe a
strong correlation between basic subgraphs and hu-man readability ratings (Table 4), we mine frequent large subgraphs of projection graphs. Our intuition is that larger subgraphs are more informative coher-ence patterns. Hcoher-ence, we extend the cohercoher-ence fea-tures from all feasible 3-node subgraphs to frequent k-node subgraphs. We first use an efficient subgraph mining algorithm to extract all subgraphs with sizek
and then compute the count of each subgraph as an induced subgraph in each graphG∈ζ. We retain a subgraphsg, if it is frequent (i.e.support(sg)>λ). The result of these steps is a two-dimensional ma-trix whose rows represent graphs inζ and columns represent frequent subgraphs with size k. The cell
hGi,sgjishows the count ofsgj in graphGi. Given this matrix, we compute the graph signature of each
G∈ζ and take each element of the graph signature as a coherence feature.
4 Experiments
4.1 Data
We use the dataset created by Pitler and Nenkova (2008) which consists of randomly selected articles from the Wall Street Journal corpus. The articles were rated by three humans on a scale from 1 to 5 for readability based on quality measures that are de-signed to estimate the coherence of articles. The fi-nal readability score of each article is the average of these three ratings.
We exclude three files from this dataset: wsj--0382 does not exist in the Penn Treebank (Mar-cus et al., 1994)1. wsj-2090 does not exist in
the Penn Discource Treebank (Prasad et al., 2008).
wsj-1398is a poem.
4.2 Settings
Entity graph. We use the gold parse trees in the
Penn Treebank (Marcus et al., 1994) to extract all nouns in a document as mentions. We consider nouns with identical stem2as coreferent. We divide
the edge weight between two sentence nodessiand
sj by their distance j−ito decrease the importance of links that exist between non-adjacent sentences.
Discourse relation graph.We use gold PDTB-style
discourse relations (Prasad et al., 2008). We filter out EntRel and NoRel relations.
Number of components. For counting the number
of components in each projection graph, the Sage-Math3package is used. This feature is computed on
unweighted projections (i.e.PER u ).
Frequent subgraphs. Since subgraph mining is
an NP-complete problem, different algorithms have been introduced to improve the performance of sub-graph mining. We use the gSpan4 algorithm (Yan
and Han, 2002) to mine subgraphs of a graph database which containsPER
u projections. An advan-tage of using efficient subgraph mining algorithms is that we can exhaustively search very large subgraph spaces. A graph withkEk edges, however, poten-tially hasO(2kEk)subgraphs. Having sparse graphs
1Pitler and Nenkova (2008) also remove one file from their
experiments. We assume that it iswsj-0382.
2We use Stanford CoreNLP (http://nlp.stanford.
edu/software/corenlp.shtml)
3http://sagemath.org/download-linux.html 4We use the Java package: http://www.cs.ucsb.
sg1 sg2 sg3 sg4
st su
sv
sw
st su
sv
sw
st su
sv
sw
st su
sv
sw
sg5 sg6 sg7 sg8
st su
sv
sw
st su
sv
sw
st su
sv
sw
st su
sv
sw
sg9 sg10 sg11 sg12
st su
sv
sw
st su
sv
sw
st su
sv
sw
st su
sv
sw
sg13 sg14 sg15 sg16
st su
sv
sw
st su
sv
sw
st su
sv
sw
st su
sv
sw
sg17 sg18 sg19 sg20
st su
sv
sw
st su
sv
sw
st su
sv
sw
st su
sv
sw
sg21 sg22 sg23 sg24
st su
sv
sw
st su
sv
sw
st su
sv
sw
st su
sv
[image:6.612.79.292.57.409.2]sw
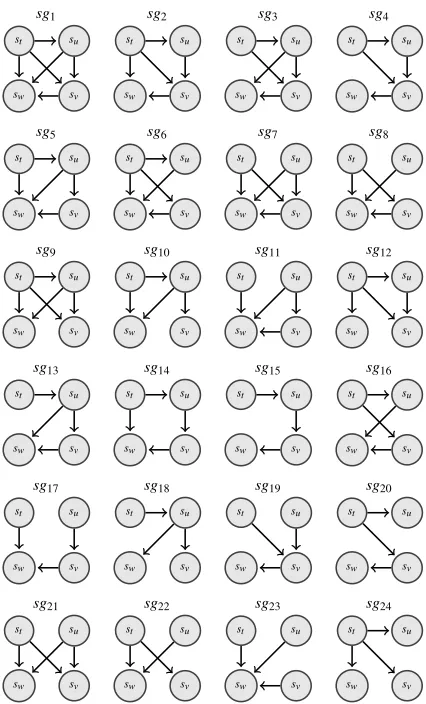
Figure 9: Frequent subgraphs with four nodes wheret<
u<v<w.
and using efficient subgraph mining algorithm lets us to search trough this space. We mine subgraphs withk=4 andλ=0 (Figure 9).
4.3 Evaluation
We evaluate on the following benchmark tasks.
Readability assessment. We use the Pearson
cor-relation coefficient to find features correlated with readability scores. It takes feature values and read-ability scores of all articles and returns −1≤ρ≤ +1. A high value of|ρ|shows a strong correlation. We report statistical significance on the 0.05-level5.
Readability as ranking. We rank texts pairwise
with respect to their readability. We define a clas-sification problem with a set of text pairs and a la-bel, which indicates whether the first text in a pair
5The results written in bold face (Section 5).
ρ p value
Entity Graph
PER
u −0.013 0.949
PER
w 0.151 0.452
PER
acc 0.150 0.455
Discourse Relation Graph
PDR
u 0.150 0.455
PDR
w 0.155 0.440
Combination of Entity and Discourse Relation
PER
u ∨PuDR 0.083 0.681
PER
w +PuDR 0.185 0.356
PER
[image:6.612.319.531.57.203.2]w +PwDR 0.187 0.350
Table 3: The correlation of the average outdegree of dif-ferent graphs with human readability ratings.
is more readable. We use every two texts whose hu-man readability scores differ by at least 0.5. Each text is represented with its graph-based coherence features. We employ WEKA’s linear support vector implementation (SMO) to classify the pairs. Perfor-mance is evaluated using 10-fold cross-validation.
5 Results
Readability assessment. We report the correlation
of our coherence models encoded in graph features and compare them with Guinaudeau and Strube’s (2013) entity graph as the state-of-the-art coherence model. Pitler and Nenkova (2008) show that the en-tity transition features extracted from the enen-tity grid model (Barzilay and Lapata, 2008) on its own do not significantly predict human readability ratings. So we do not describe their results here.
The results for the outdegree feature is shown in Table 3. The average outdegree of PER
w is highly correlated with human readability ratings. This confirms the readability results of Guinaudeau and Strube (2013) on the Encyclopedia Britannica dataset. The outdegrees of discourse relation graphs are more strongly correlated with human readability ratings than the outdegree of the projections in the entity graph, suggesting that efficient graph-based encoding of discourse relations can measure read-ability well. The outdegree of the combined graph
PER
rat-ings, confirming the intuition that outdegree only measures node connectivity in graphs and it is not enough to measure readability.
ρ p value
Number of Components −0.391 0.044 Relative frequency of 3-node Subgraphs
sg1 0.310 0.116
sg2 −0.325 0.098
sg3 −0.384 0.048
[image:7.612.327.520.57.360.2]sg4 0.108 0.592
Table 4: Number of components and subgraph sg3 are significantly correlated to readability.
Table 4 shows the correlation of two features of projections6: The number of components has
a strong and significant negative correlation with human readability ratings7, suggesting that simple
properties of graphs measure text coherence. The lower part of Table 4 shows the correlation of the rel-ative frequency of 3-node subgraphs (see Figure 8). More readable articles have manysg1and few
num-ber ofsg2 patterns. Patternsg3 is significantly and
negatively correlated with human readability judg-ments, confirming the intuition that many shifts in focus of attention make texts difficult to read.
Table 5 shows the correlation between the rela-tive frequency of 4-node subgraphs and readabil-ity ratings. First, most subgraphs with less than four edges are negatively correlated with readabil-ity, except sg20 and sg24 which are weakly
corre-lated with readability. Few connections between sentences make the text difficult to read.
Second, the highest positive and significant cor-relation ofsg12 and the most negatively correlated
subgraphsg11show that different patterns of edges
in subgraphs capture readability judgments. Stod-dard (1991, p.29) explains this by the ambiguity nodephenomenon: “[...] in some cases, there may be more than one logical, possible node for a given cohesive element in a text, in which case, a reader may see the resulting ambiguity but not be able to
6Although, the proposed features can be applied on all kind
of presented graphs, we evaluate them (except outdegree) only on projections of the entity graph model. We leave the applica-tion to the other graph representaapplica-tions for future work.
7This supports Karamanis et al. (2009) who report that
NOCB transitions in the centering model can be used for the sentence ordering task.
number of edges ρ p value
sg1 6 0.103 0.609
sg2 5 −0.212 0.288
sg3 5 −0.176 0.380
sg4 4 −0.257 0.196
sg5 5 −0.140 0. 486
sg6 5 0.200 0.317
sg7 5 −0.402 0.038
sg8 4 −0.317 0.107
sg9 5 0.153 0.446
sg10 4 −0.238 0.232
sg11 4 −0.509 0.007
sg12 4 0.449 0.019
sg13 4 −0.045 0.824
sg14 4 −0.033 0.870
sg15 3 −0.358 0.067
sg16 4 −0.068 0.736
sg17 3 −0.308 0.118
sg18 3 −0.546 0.003
sg19 3 −0.601 0.001
sg20 3 0.094 0.641
sg21 4 0.068 0.736
sg22 3 −0.374 0.055
sg23 3 −0.314 0.111
sg24 3 0.100 0.620
Table 5: The correlation between the relative frequency of 4-node subgraphs and readability ratings.
decide between the choices”. E.g., insg11 a reader
may make a decision about the focus of attention insw, while insg12 the focus of attention of sw is the same as the focus of attention of st. This phe-nomenon can also be observed in all positively cor-related subgraphs. If readers have to return to one point in the text, they prefer to return to a sentence which is the core of the preceding sentences. How-ever, we should refrain of interpreting too much into these patterns.
Finally, we conclude that in all strongly negative correlated subgraphs, a subgraph suffers either from edge shortage or the ambiguity node phenomenon likesg7.
Considering the correlation of 3-node subgraphs in Table 4 and 4-node subgraphs in Table 5, two results are noticeable. First, in large subgraphs there are more strongly correlated subgraphs than 3-node subgraphs, confirming our hypothesis that larger subgraphs convey coherence patterns with higher quality. Second,sg12 in 4-node subgraphs is
[image:7.612.83.287.110.197.2]3-node subgraphs, becausesg12 captures more
cir-cumstances aboutst. The relative frequency ofsg12
is more informative thansg4’s relative frequency.
Readability as ranking. Results of the readability
ranking problem are shown in Table 6. Baseline fea-tures are entity transition feafea-tures which are used as coherence features by Pitler and Nenkova (2008)8.
Features Accuracy
Baselines
None (Majority class) 47.85%
Baseline features (Pitler and Nenkova, 2008) 83.25%
Graph-based Features
Number of components 61.72%
Basic subgraphs (3-node) 79.43%
Frequent large subgraphs (4-node) 89.00% Frequent basic + large subgraphs 88.52% Baseline features + frequent large subgraphs 93.30%
Table 6: SVM prediction accuracy.
When classifying with graph signatures based on basic subgraphs, accuracy is lower than with the baseline coherence features. This is probably related to the entity grid features which represent gram-matical role transitions of entities, while the basic subgraphs only models the occurrence of entities across sentences. Graph signatures based on large subgraphs improve the performance of basic sub-graphs by around 10%. This high accuracy ver-ifies that larger subgraphs capture coherence pat-terns with high quality. Combining basic (3-node) and large subgraphs (4-node) cannot improve the performance of the large subgraphs features. This probably is because basic subgraphs are implicitly included in larger subgraphs. The combination of coherence baseline features and frequent large sub-graphs improves the accuracy.
6 Related Work
There is a research tradition developing metrics for readability and using these metrics to quantify how difficult it is to understand a document. Shallow fea-tures such as word, sentence and text length, which only capture superficial properties of a text, have been used traditionally (Flesch, 1948; Kincaid et al.,
8The accuracy reported in their paper is 79.42%. Our
reim-plementation achieves higher accuracy, because our dataset has three articles less.
1975). De Clercq et al. (2014) use traditional shal-low features and apply these to a new corpus anno-tated with two different methodologies. However, some studies indicate that shallow features do not precisely predict the readability of a text (Feng et al., 2009; Petersen and Ostendorf, 2009). Later studies introduce deeper (more semantic) features such as those obtained by language models (Si and Callan, 2001; Collins-Thompson and Callan, 2004) and syn-tactic features like the number of NPs in sentences or the height of the sentence’s parse tree (Schwarm and Ostendorf, 2005; Heilman et al., 2007). Barzi-lay and Lapata (2008) propose an entity-based co-herence model which operationalizes some of the intuitions behind the centering model (Grosz et al., 1995). Although this model works well on the sen-tence ordering and summary coherence rating tasks, it does not work well for readability assessment. Only when combining the entity grid with features taken from Schwarm and Ostendorf (2005) the en-tity grid performs competitively.
While most of these studies predict the readabil-ity level of documents, Pitler and Nenkova (2008) present a new readability dataset with Wall Street Journal articles, where each article is assigned hu-man readability ratings. They analyze the correla-tion between different readability features and hu-man readability scores. They show no correla-tion between entity-transicorrela-tion features and readabil-ity scores. In contrast to them we are able to report a statistically significant correlation between some entity-based features and human readability ratings.
7 Conclusions
We proposed graph-based coherence features based on the notion of frequent subgraphs. We analyzed these features on the dataset created by Pitler and Nenkova (2008) which associates human readabil-ity ratings with each document. We have shown that frequent subgraphs represent coherence patterns in a text. Larger subgraphs obtain a high and statisti-cally significant correlation with human readability ratings.
our automatically induced subgraphs have a strong statistically significant correlation. We also outper-form Pitler and Nenkova (2008) in the readability ranking task by more than 5% accuracy thus estab-lishing a new state-of-the-art on this dataset. We conclude that the graph-based representation (Guin-audeau and Strube, 2013) is a better and more infor-mative starting point for assessing readability.
In future work, we plan to induce common sub-graphs and apply our method to different datasets (e.g. the dataset created by De Clercq et al. (2014)) combined with other readability features (Schwarm and Ostendorf, 2005).
Acknowledgments
This work has been funded by the Klaus Tschira Foundation, Heidelberg, Germany. The first author has been supported by a HITS Ph.D. scholarship. We would like to thank our colleagues Benjamin Heinzerling, Yufang Hou, Sebastian Martschat, Nafise Moosavi, and Daraksha Parveen who com-mented on earlier drafts of this paper.
References
Regina Barzilay and Mirella Lapata. 2008. Modeling local coherence: An entity-based approach.
Computa-tional Linguistics, 34(1):1–34.
Chris Biemann, Stefanie Roos, and Karsten Weihe. 2012. Quantifying semantics using complex network analy-sis. InProceedings of the 24th International
Confer-ence on Computational Linguistics,Mumbai, India, 8–
15 December 2012, pages 263–278.
Kevyn Collins-Thompson and James P. Callan. 2004. A language modeling approach to predicting reading difficulty. In Proceedings of the Human Language Technology Conference of the North American Chap-ter of the Association for Computational Linguistics,
Boston, Mass., 2–7 May 2004, pages 193–200. Frantiˇsek Daneˇs. 1974. Functional sentence
perspec-tive and the organization of the text. In F. Daneˇs,
edi-tor,Papers on Functional Sentence Perspective, pages
106–128. Prague: Academia.
Orph´ee De Clercq, V´eronique Hoste, Bart Desmet, Philip Van Oosten, Martine De Cock, and Lieve Macken. 2014. Using the crowd for readability prediction.
Nat-ural Language Engineering, 20(3):293–325.
Lijun Feng, No´emie Elhadad, and Matt Huenerfauth. 2009. Cognitively motivated features for readability assessment. InProceedings of the 12th Conference of
the European Chapter of the Association for
Computa-tional Linguistics,Athens, Greece, 30 March – 3 April
2009, pages 229–237.
Rudolf Flesch. 1948. A new readability yardstick.
Jour-nal of Applied Psychlogy, 32:221–233.
Barbara J. Grosz, Aravind K. Joshi, and Scott Weinstein. 1995. Centering: A framework for modeling the lo-cal coherence of discourse. Computational Linguis-tics, 21(2):203–225.
Camille Guinaudeau and Michael Strube. 2013. Graph-based local coherence modeling. In Proceedings of the 51st Annual Meeting of the Association for
Com-putational Linguistics (Volume 1: Long Papers),Sofia,
Bulgaria, 4–9 August 2013, pages 93–103.
Michael J. Heilman, Kevyn Collins-Thompson, Jamie Callan, and Maxine Eskenazi. 2007. Combining lexical and grammatical features to improve readabil-ity measures for first and second language texts. In
Proceedings of Human Language Technologies 2007: The Conference of the North American Chapter of the
Association for Computational Linguistics,Rochester,
N.Y., 22–27 April 2007, pages 460–467.
Nikiforos Karamanis, Chris Mellish, Massimo Poesio, and Jon Oberlander. 2009. Evaluating centering for information ordering using corpora. Computational
Linguistics, 35(1):29–46.
Rohit Kate, Xiaoqiang Luo, Siddharth Patwardhan, Mar-tin Franz, Radu Florian, Raymond Mooney, Salim Roukos, and Chris Welty. 2010. Learning to pre-dict readability using diverse linguistic features. In
Proceedings of the 23rd International Conference on
Computational Linguistics,Beijing, China, 23–27
Au-gust 2010, pages 546–554.
J. Peter Kincaid, Robert P. Jr. Fishburne, Richard L. Rogers, and Brad S. Chisson. 1975. Derivation of new readability formulas (automated readability index, Fog count and Flesch reading ease formula) for navy en-listed personnel. Technical Report 8-75, Naval Tech-nical Training Command, Naval Air Station Memphis-Millington, Tenn., February.
Ziheng Lin, Hwee Tou Ng, and Min-Yen Kan. 2011. Au-tomatically evaluating text coherence using discourse relations. In Proceedings of the 49th Annual Meet-ing of the Association for Computational LMeet-inguistics
(Volume 1: Long Papers),Portland, Oreg., 19–24 June
2011, pages 997–1006.
Ziheng Lin. 2011. Discourse parsing: Inferring dis-course structure, modeling coherence, and its
appli-cations. Ph.D. thesis, Dept. of Computer Science,
School of Computing, National University of Singa-pore.
Katz, and Britta Schasberger. 1994. The Penn tree-bank: Annotating predicate argument structure. In
Proceedings of ARPA Speech and Natural Language
Workshop.
Sebastian Nowozin, Koji Tsuda, Takeaki Uno, Taku Kudo, and Gokhan BakIr. 2007. Weighted substruc-ture mining for image analysis. In Proceedings of the 2007 IEEE Computer Society Conference on
Com-puter Vision and Pattern Recognition, Minneapolis,
Minn., 18-23 June 2007, pages 1–8.
Sarah E. Petersen and Mari Ostendorf. 2009. A machine learning approach to reading level assessment.
Com-puter Speech and Language, 23(1):89–106.
Emily Pitler and Ani Nenkova. 2008. Revisiting readability: A unified framework for predicting text quality. In Proceedings of the 2008 Conference on Empirical Methods in Natural Language Process-ing,Waikiki, Honolulu, Hawaii, 25–27 October 2008, pages 186–195.
Rashmi Prasad, Nikhil Dinesh, Alan Lee, Eleni Milt-sakaki, Livio Robaldo, Aravind Joshi, and Bonnie Webber. 2008. The Penn Discourse Treebank 2.0.
InProceedings of the 6th International Conference on
Language Resources and Evaluation,Marrakech,
Mo-rocco, 26 May – 1 June 2008.
Sarah E. Schwarm and Mari Ostendorf. 2005. Read-ing level assessment usRead-ing support vector machines and statistical language models. InProceedings of the 43rd Annual Meeting of the Association for
Compu-tational Linguistics, Ann Arbor, Mich., 25–30 June
2005, pages 523–530.
Luo Si and Jamie Callan. 2001. A statistical model for scientific readability. InProceedings of the ACM 10th Conference on Information and Knowledge
Manage-ment, Atlanta, Georgia, 5–10 November 2001, pages
574–576.
Candace L. Sidner. 1983. Focusing in the com-prehension of definite anaphora. In M. Brady and R.C. Berwick, editors,Computational Models of
Dis-course, pages 267–330. Cambridge, Mass.: MIT
Press. Reprinted in: Grosz, Barbara J. et al. (Eds.) (1986). Readings in Natural Language Processing. Morgan Kaufman: Los Altos, Cal., pp.363-394. Sally Stoddard. 1991. Text and Texture: Patterns of
Co-hesion. Ablex, Norwood, N.J.
Xifeng Yan and Jiawei Han. 2002. gSpan: Graph-based substructure pattern mining. In Proceedings of the
International Conference on Data Mining, Maebashi