M tURICE F. DOYLE, President of the Institute. JC SEPH F. HARFORD, Chairman of the Council.
KEVIN BONNER, Secretary, Department of Enterprise & Employment. G.T. PAUL CONLON, Chairman, ESRI Fund-Raising Committee 1995-2000. * SEAN CROMIEN, Former Secretary, Department of Finance.
* CONNELL FANNING, Professorj Department of Economics, University College, Cork. MARY FINAN, Managing Director, Wilson Hartnell Public Relations Limited. ALFIE KANE, Chief Executive, Telecom Eireann.
KEVIN J. KELLY, Group General Manager - AIB Bank, AIB Group plc. PATRICK LYNCH, Chairman of the Institute, 1983-1988.
* EUGENE McCARTHY, Director, Woodchester Investments plc. EDWARD F. McCUMISKEY, Secretary, Department of Social Welfare.
ALAN MATTHEWS, Professor, Department of Economics, Trinity College, Dublin. MICHAEL J. MEAGHER, Director, Bank of Ireland International Finance.
STEPHEN MENNELL, Professor, Department of Sociology, University College, Dublin. JOSEPH MORAN, Chief Executive, Electricity Supply Board.
* PATRICK MULLARKEY, Secretary, Department of Finance. DONAL MURPHY, Director General, Central Statistics Office.
* DONAL .NEVIN, Former General Secretary, Irish Congress of Trade Unions. * TOMAS F. (3 COFAIGH, President of the Institute, 1987-1995.
MAURICE O’CONNELL, Governor, Central Bank of Ireland. MARIE O’CONNOR, Partner, Craig Gardner~Price Waterhouse. JERRY O’DWYER, Secretary, Department of Health.
PATRICK O’REILLY, Chief Executive, EBS Building Society. * W.G.H. QUIGLEY, Chairman, Ulster Bank Limited.
* NOEL SHEEHY, Professor, Department of Psychology, Queen’s University of Belfast. ROELOF SCHIERBEEK, Chairman, Northern Ireland Economic Research Centre. MICHAEL J. SOMERS, Chief Executive, National Treasury Management Agency. COLIN STORM, Managing Director, Guinness Ireland Limited.
T.K. WHITAKER, President of the bzstitute 1971-1987. * BRENDAN J. WHELAN, Director of the Institute.
* PADRAIC A. WHITE, Chairman, Northside Partnership Limited.
The Medium-Term Review:
1997-2003
Edited by
DAVID DUFFY, JOHN FITZ GERALD, IDE KEARNEY, and FERGAL SHORTALL
Copies of this paper may be obtained from The Economic and Social Research Institute (Limited Company No. 18269), (Registered Office) 4 Burlington Road, Dublin 4.
Price IR£35.00 per copy
David Duffy is an Assistant Research Officer, John Fitz Gerald is a Research Professor, Ide Kearney is a Research Officer and Fergal Shortall is a Research Assistant with The Economic and Social Research Institute. The Review has been accepted for publication by the Institute, which is not responsible for either file content or the views expressed therein.
© THE ECONOMIC AND SOCIAL RESEARCH INSTITUTE
ACKNOWLEDGEMENTS iv
SUMMARY v
1 INTRODUCTION 1
2 THE EDUCATIONAL REVOLUTION AND DEMOGRAPHIC 7
CHANGE
3 INTERPRETING THE RECENT IRISH GROWTH EXPERIENCE 35
4 FINANCIAL FLOWS AND THE BALANCE OF PAYMENTS 67
5 BACKGROUND ASSUMPTIONS 81
6 THE CENTRAL FORECAST 105
7 CONCLUSIONS AND IMPLICATIONS 151
The production of tile Medium-Term Review is a collective effort within The Economic and Social Research Institute. The editors of the Review have drawn heavily on the wide range of expertise of the Director of the Institute and their colleagues, who have assisted during all stages of preparation and revision.
In particular, we are grateful to Terry Baker, editor of the Quarterly Economic Commentary, for assistance with the interface between the QEC and our own projections.
The late Mary McElhone has been greatly missed in bringing this publication to fruition.
Tile editors have had unstinting support from many in the Institute in meeting the tight deadlines for publication.
A particular word of thanks is due to the National Institute of Economic and Social Research, London, for the use of their global econometric model, NiGEM, in exmnining the sensitivity of the forecasts to alternative assumptions.
Introduction
The ESRI’s Medium-Term Review is unique in presenting a comprehensive assessment of the prospects for the Irish economy over the next decade. It benefits from the wide range of research carried out in the ESRI since its last publication in 1994 and it takes account of latest thinking about the prospects for the wider EU economy. The Review analyses the reasons why the Irish economy is growing more rapidly than the rest of the EU and it presents a detailed forecast tbr the period to 2003. The analysis highlights a range of strategic issues which are crucial for the long-term development of die economy; issues which are often ignored in the debate on economic policy in Irehmd.
Demographic Change
Chapter 2 examines the demographic changes which are transforming Ireland. The rising educational attainment underpins the transformation of society and it is having a very important direct effect on the economy. It is a key factor driving the rapid rise in female participation; it is affecting migration; it has an indirect effect on the birth rate; and through enhancing the earning power of die population it is contributing directly to economic growth. As a result of all these changes, the supply of labour will grow by around
2 per cent a year in the 1990s. The rising education of the labour three is contributing directly at least 0.5 percentage points a year to the increase in productivity.
The fall off in the birth rate and the ending of net emigration means that the ratio of the number of people not working to those in employment is failing very rapidly. From having the highest rate of economic dependency in the EU Ireland will have one of the lowest by 2010. This provides a window of opportunity, which may last 20 years.
Who Put the Tiger in the Tank?
of successive govenunents over the last 40 years. Among medium-term factors, file authors attach particulm" importance to file shake-up of attitudes and institutions as a reaction to the recession of the 1980s. The re-establishment of fiscal control over that decade was "also crucial. The positive trends in Irish wage competitiveness have also played a major role and have beeu sustained by the pay agreements and social partnership arrangements. These domestic causal factors have interacted favourably with several external forces including wider developments in the EU.
The Context for Forecasting
In Chapter 4 the authors review the changing pattern of fiuancial flows in recent years. They argue that there has been no shortage of financial resources to support economic growth; unusually the Irish company sector remains a net lender. This frmnework is also used to discuss how Irish interest rates and exchange rates may behave in the approach to EMU.
Tile external environment facing the Irish economy over die next 6 years should be broadly favourable. As discussed in Chapter 5, while file US and UK economies have been growing at a satisfactory pace for a number of years, the rest of the EU economy appears to be recovering at last from recession. EMU membership froln 1999 onwards should help to maiutain the cun’ent relatively low interest rates providing a stable environment for future
invesunent.
The Central Forecast
In Chapter 6 the Central Forecast is presented. This represents the best estimate of what is likely to
happen to tile Irish economy in the medium term. In this forecast the authors concentrate on the likely average growth rates for the forecast period rather than the very difficult task of forecasting turning points. The forecast is based on the assumption of prudent fiscal policy, wage moderation, and the absence of serious domestic or international shocks.
The demographic dividend, from which we are beginning to benefit, will not last indefinitely. As a result, in planning tile public finances in the medium term it is wise to provide for the elimination of new government borrowing to ensure a sustained reduction in our indebtedness. Because of tile expected rapid growth, this reduction in debt would be compatible with increased public investment in infrastructure and moderate reductions in direct taxation.
Figure: GNP - Average Annual Percentage Change
8 AnnualAverage Percenta~le Change
60-65 65-7070-75 75-80 60-85 85-9090-95 95-00 00-0505-10
Source: Pre 1990 on ESA79 basis, post 1990 on ESA95.
The forecast is crucially dependent on adherence to the current partnership agreement, and on its successors being at moderate levels. Current economic circumstances and long-term investment in preceding decades offer a historical opportunity for Irish society. It should not be wasted.
in the economy is likely to continue into the next
decade. Ill contrast to the past, when the potential
growth in output appears to have been around 4 per
cent a year, the second half of the 1990s should see
growth at around 5.5 per cent a year (see Figure).
While this should slow down to around 5 per cent a
year from 2000 to 2005, it is only in the second half of the next decade, when the demographic
factors driving growth diminish in importance, that
the potential growth in output will fall back to 4
per cent a year or less. This implies that Ireland
will approach the EU average standard of living
around tile middle of the next decade, probably
exceeding that of the UK before 2005. The
convergence will be greatly facilitated by the
favourable movement in the rate of economic
dependency in Ireland.
As shown in the Table, the rate of growth in Gross
National Disposable Income, the best available
measure of standard of living, will be somewhat
lower than that in GNP because of a likely fall off
in transfers from the EU in the next decade and a
continuing unfavourable shift in the terms of trade.
This turnaround sees the economy in the 1990s
moving away from "jobless growth". In the period
1995-2000 employment should grow by an average
of 3 per cent a year, falling back to 2 per cent a
year in the period to 2005. This will represent an
exceptional performance by the standards of the
past (and by the standards of the rest of the EU)
and it will depend on the maintenance of the strong
competitive position of the economy.
While in the past the rise in employment has been
significant, the unemployment rate fell slowly.
Over the next decade we have the prospect of very
rapid employment growth which should make
possible a sustained reduction in unemployment.
This will be facilitated by the rising educational
attainment of the labour force. From its level of 12
per cent of the labour force in 1996, the
unemployment rate could be expected to fall to
around 8.6 per cent by 2000 and to 7 per cent by
2005. However, on present trends those with very
limited education are likely to remain seriously
disadvantaged on the labour market.
Table: Central Forecast, Major Aggregates
1996 1997 1998 1999 2000 2001 2002 2003 1990-9s 1995-00 2000-05 2005-10
GNP 6.4 5.7 5.9
Gross National Disposable Income + 5.2 4.4 5.8 Capital Transfers (National Resources)
Consumption Deflator 2.2 2.1 1.9 2.1 2.2 2.1 2.1 2.1
Employmem, April 3.6 3.1 3.9 2.9 1.5 1.5 1.7 2.2
% AverageGrowN,%
5.3 4.4 3.7 4.5 5.3 4.7 5.5 5.0 4.2 5.5 3.2 3.1 3.7 4.4 3.2 4.8 4.2 3.0
Balance of Payments, % of GNP 1.3 0.9 0.4 0.3 0.5 0.1 0.5 0.9
Debt/GNPRatio, % 87.7 83.4 77.2 71.6 66.9 63.1 59.1 54.9
General Government Deficit, % of GNP 1.2 1.6 0.4 0.1 0.1 0.4 0.4 0.2 Unemployment Rate, ILO basis,% of 11.9 10.9 9.1 8.3 8.6 8.8 8.9 8.4 Labour Force
2.4 2.1 2.1 2.2
1.8 3.0 2.0 1.5
1995 2000 2005 2010
2.5 0.5 1.5 0.8
96.9 66.9 45.7 33.0
2.3 0.1 -0.7 0.7
With prudent management of the public finances it should be possible to effectively eliminate all new government borrowing in the next 3 years and even to run a small surplus by 2005. As shown in the Table, this would be sufficient to reduce the debt to GNP ratio to around 30 per cent by the end of the next decade. Such a fiscal strategy is desirable ill the light of tile exceptionally favourable demographic trends of tile next decade, a situation which will not last indefinitely, and it would be consistent with Ireland continuing to run a small surplus on file balance of payments.
This benign Central Forecast seems a likely scenario tbr tile future but it is quite possible that the economy will be thrown off course by various unpleasant "surprises" in the form of sudden changes in tile economic circumstances of our neighbours or through domestically generated crises. In Chapter 6 we consider a range of possible shocks and we examine how our forecast would need to be modified if such events actually happened.
The biggest danger domestically is that an excessive rise in expectations could feed into wage inflation or unsupportable demands on the exchequer. This would choke off the rapid growth at a premature stage. If wage inflation were to make Irehmd uncompetitive, the necessary tightening of fiscal policy would erode much of the possible gain in money incomes of those at work. An even more serious burden would be felt by those who would, as a result, tail to find employment in Ireland, leaving them unemployed or forced to emigrate.
If invesunent in physical infrastructure is inadequate, rising congestion of various forms - in
the housing market, in transport, or other areas -could damage the growth potential of the economy.
Another possible threat would be an inappropriate EU response to the need to halt the global warming process. If measures were taken over the next decade which imposed a disproportionate cost on the Irish economy then the potential growth rate would be markedly reduced.
The authors also consider the possible adverse impact on the Irish economy if EMU failed to go ahead. Given file economic and political capital invested in it at all EU level, there would probably be serious disruption of the EU economy reflected in a substantial rise in interest rates in countries
such as Ireland. Experience indicates that this could result in the growth potential of the economy being temporarily reduced.
Finally, it should be stressed that there is as much likelihood that the actual performance of file economy could prove superior to the Central Forecast as that it should disappoint. However, the possible margins for error are greater on tile
down-side. A combination of an excessive rise in income expectations and a serious external shock could reduce the potential growth rate by up to 2 percentage points over a significant period. On balance, it seems probable that the average growth in GNP over the forecast period will be in the range 3.5 per cent a year to 6 per cent, but in any one year the growth rate could fall well outside these limits and such fluctuations must be allowed for in future planning.
The Implications
window of opportunity. Whereas the rapid !ncrease in file supply of labour has traditionally been Ireland’s "problem" it now looks like being Ireland’s opportunity. The first priority is how to ensure that the Central Forecast actually comes to pass. Key factors in "making it happen" are: ¯ Sustaining and reintbrcing the partnership
approach to income determination so that it survives the pressures from rising expectations; ¯ Adequate invesUnent must be undertaken to
provide the infrastructure essential to future growth;
¯ The pressures on the environment will have to be controlled by an appropriate use of fiscal instrumenks such as taxes and charges;
¯ Prudent management of the public finances to move into surplus in the next decade.
Assuming that the success story continues what can we do with "the Fruits of Growth".
* Over the next decade there will probably be the opportunity of making an impact on major social problems. For example, there is a pressing need for measures ahned specifically at improving the skill levels of the long-term unemployed;
* The "demographic dividend" should be invested to provide tbr long-term needs.
Introduction
Economic forecasters are often unjustly accused of prophesying endless gloom. Yet in this Review we forecast that the Irish economy, both in output and employment terms, should, in the absence of any major adverse shocks, continue its strong growth performance in the opening years of the next century. However, we make no pretensions to the wisdom of Calchas,2 rather this Review is intended to present our best estimate of the likely development of the Irish economy over the next decade.
certain sense of bemusement at this rapid reversal of fortunes. However, it is now becoming clear that, whatever the causes, the Irish economy is undergoing somedfing of a renaissance. The first task of this Review is to consider the reasons for this apparent change in fortunes. The analysis presented in Chapters 2 and 3 suggests that it is not a flash in the pan but rather represents the fruits of a strategy that has been pursued for a number of decades with considerable consistency by successive Irish governments.
When Lee wrote his history of Ireland less than a decade ago one of the many interesting questions he addressed was why the Republic of Ireland was an economic failure.3 Now the question posed by outsiders looking in is why is it such a success. To those of us living through the experience there is a
"Prophet of’ evil, never yet hast thou spoken to me the thing that is good; ever is evil dear to flay heart to prophesy, but a word of good hast thou never yet spoken, neither brought to pass." Homer’s Iliad (Book I: vssl06-109, 1924 ed. translated by A. T. Mun’ay, Loeb Classical Library).
z The passage fl’om the Iliad cites Agamenmon’s blistering reply to Calchas who has just prophesied on how the Greeks should get rid of the plagne. Calchas’ prophesy was entirely correct, but Agalnenmon’s response shows that a prophet is never loved among his own. Calchas’ prophecy did have some nasty consequences because Agamenmon’s embittered reaction to it led to the wrath of Achilles. This has modern clay resonances in the Lucas Critiqne! "~ Lee, J., 1989, Ireland 1912-1985. Politics and Society, Cambridge: Cambridge University th’ess.
The issue which we consider of most importance to the likely future course of the economy is the supply of labour. The rapid growth in the stock of human capital embodied in the labour force over the past decade is likely to continue and this has profound implications for Ireland’s tuture growth performance. In Chapter 2 we examine the impact which the educational revolution and demographic change have had on the structure and dynamics of labour supply.
The strong growth perlbrmance of the Irish economy in the 1990s has significantly exceeded
recession in the 1980s. However, file structure of tile economy and thus file detenninants of this growth performance have been radically transformed during this period. In Chapter 3 we look at the evidence on Ireland’s recent growth performance against the background of changes in human capital and file labour market, the increased openness of the economy and its impact on competitiveness, and file role of domestic policy rel’orms in fostering growth.
A welt functioning financial sector plays an essential part in sustaining economic growth. In Chapter 4 we discuss several important questions about the role of file financial sector in the years almad. We look at the pattern of financial flows to-day and file role of financial institutions within the financial system. We also consider the general implications of EMU for the balance of payments and the Central Bank reserves, together with a review of the alternative possibilities for file entry rate of the Irish pound into EMU.
The major task of this Review is to formulate a "CenU’al Forecast" for file Irish economy over the next 6 years. This forecast, presented in Chapters 5 and 6, represents our best "guess" as to what will happen to the major economic aggregates, although past experience has shown that the one certainty is that future events will surprise us. In file light of the inevitable uncertainty about the future we also consider how this Central Forecast would be affected by possible surprises, pleasant and unpleasant, over file period to 2003.
is therefore best captured by focusing on the average growth rates in different variables over the forecast period. These are more likely to be correct than the individual year on year forecasts which may miss the exact timing of turning points. It is especially important to bear this in mind in reading Chapter 6.
In Chapter 5 we detail the background assumptions made for the forecast period. For an economy as open as Ireland’s a key to future prospects is the likely development of neighbouring economies. Our assumptions concerning economic prospects for the US, the EU in general and file UK and Germany in particular are set out in detail.4 We also consider the outlook for the CAP and the ELI Structural Funds. For the domestic economy we spell out in Chapter 5 the assumptions which we have made on fiscal and monetary policy for the forecast period.
We use the ESRI macroeconomic model to help formulate the Central Forecast for the Irish economy over file period 1998-2003. The full details of this forecast are given in Chapter 6. We provide separate forecasts for 11 different sectors as well as details of the prospects for the major economic aggregates - incomes, prices, consumption and investment, employment, the labour force and the balance of payments. Because of the growing importance of environmental issues we also discuss the likely demand for energy over the forecast period and what this implies for emissions of the major greenhouse gas - carbon~
The Cenu’al Forecast includes annual data out to the year 2003. However file primary function of this Review is the provision of a forecast over a lnedium-term horizon. The flavour of the forecast
dioxide. This chapter ends by considering how the Central Forecast may be proved wrong: we consider a range of different scenarios to get a feel for file sensitivity of our forecast to "surprises". Tile detailed discussion of file prospects for the economy m 2003 highlights medium and long-term issues of importance for policy makers. The final chapter of the Review explores these issues in some detail to throw light on how we can maximise the potential for growth and minimise the risk from unexpected shocks. Chapter 7 discusses the broad policy implications of our forecast and considers how best we can use file window of economic opportunity which we face to deal with some of our pressing economic and social problems.
The Accuracy of Our Previous
Forecasts
In 1989 Lee was writing against the backdrop of an economy undergoing a severe recession and to some extent this may have coloured his writing. This highlights the danger for social scientists of being unduly influenced by current events and it is someOling we must keep in mind in looking at the future from file vantage point of today. Even more than historians, economic torecasters have an in-built tendency to see tomorrow as being file same as today. Since file Medium-Term Review was first published in 1986, we have nearly always erred on the side of pessimism though this has not stopped commentators viewing the ESRI as inveterate optimists! This pessilnism highlights the poor self-image in Ireland that has persisted throughout much of the last decade influencing economists, historians and politicians alike. Even if Ireland were u’uly a tiger we would be the last to see it.
Before embarking on our current forecasts it is useful to examine the track record of previous Review’s medium-term forecasts. Besides being an important lesson in humility which all forecasters -unless they be prophets - ultimately face, this can serve to quantify the likely margin of error in the Central Forecast prepared for this Review.
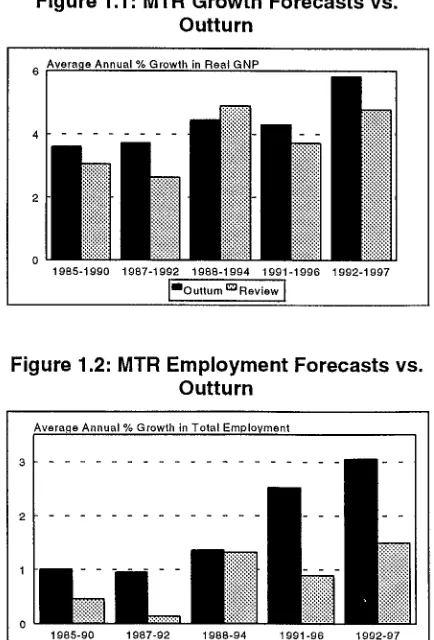
[image:13.581.294.511.262.582.2]Figure 1 below plots the average GNP growth forecasts in successive Reviews against the actual outturn. On average there is an absolute error of approximately 0.8 percentage points per annum in
Figure 1.1 : MTR Growth Forecasts vs. Outturn
~verage Annual % Growth in Real GNP
19B5-1990 1987-1992 1988-1994 1991-1996 1992-1997 [’Outtum r~ Review ]
Figure 1.2: MTR Employment Forecasts vs. Outturn
Averafle Annual % Growth in Total Employment 3 I ...
2 ...
1985-90 1987-92 1988-94 1991-96 1992-97 1"O uttum r~ Review]
our growth forecasts.5 Notably these have, with the exception of the 1989 forecast, all underestimated
_s
the actual outturn. Figure 1.2 plots our forecasting record oil growth in total employment. The average absolute error here is approximately 0.9 percentage points. Again all our employment forecasts underestimated the actual outturn. It is clear from the graphs that our "best" record was in the 1989 Medium Term Review covering the period 1988-1994. Otherwise our forecasts display a slight pessimistic trend. We could indeed be accused of prophesying "too little that is good", although our previous forecasts have generally been treated as unduly optimistic.
While our forecasts of employment and output have been within reasonably narrow confidence bounds, our track record on forecasting the unemployment rate has not been as satisfactory. This is mainly due to difficulties in forecasting migration flows which in turn are dependent on our forecasts of UK labour market conditions. Table 1.1 shows the average uuemployment rate forecasts in successive Reviews compared to the actual outturn. The absolute error is on ~werage two percentage points. Again tile 1989 Review was the only forecast which underesthnated the actual outturn while the 1991 Review crone closest to the actual outturn.
Although our medium-term forecasting performance reveals a reasonable track record, our year-on-year forecasts have had more difficulty in precisely identifying the timing of turning points in the economy. For instance, as call be seen in Table 1.2, in the t991 Review we expected growth to pick up in 1992 and 1993, based on our expectation that the European recovery would begin earlier than it
actually did, while in fact the growth pick-up started in 1994. Of course this delay was pardy attributable to the impact bf the currency crisis of late 1992. The last Review had a better year-on-year record in predicting turning points.
Table 1.1: Unemployment Rate: Forecast vs. Outturn6
Period MTR Actual Forecast
Forecast Outturn Error
1986-1990 17.85 15.99 1.86
1988-1992 18.72 15.32 3.40
1989-1994 13.75 15.32 -1.57
1992-1996 15.92 14.81 1.09
1993-1997 15.98 13.90 2.08
Casting an eye across the black bars in Figures 1.1 and 1.2 which track actual pertbrmance, it is clear that, on average, the economy has been continually improving its pertbrmance both in output and employment terms over the period 1985-1997. This upward trend in pertbrmance may partly explain why Review forecasts, which have in tact tended to underestimate the outturn, are generally treated as being overly optimistic at the time of publication. It is reassuring that other forecasters also experience some difficulty in predicting growth rates. The International Monetary Fund in a recent review of IMF growth forecasts found that for the industrial country group as a whole, which includes tile USA, Italy, Japan, UK, Germany, Canada and France, the World Economic Outlook tbrecasts have tended to over- or underpredict growth by about one percentage point.
previous Reviews were prep,’u’ed on the old ESA79 basis and if we compare them with the ESA79 outturns the absolute error is close (o olle percentage points per annum.
Table 1.2: Comparison of Forecasts for GNP Growth Rate
1986 1987 1988 1989 1990 1991 1992 1993 1994 1995 1996 1997 1998 1999 2000 2.5 3.3 3.5 3.0 3.0
-0.4 3.0 3.3 3.7 3.6
4.0 7.1 5.6 4.6 4.8 3.2
2.0 3.7 4.3 3.3 3.6
2.4 4.3 6.9 MTR1986
MTR1987
MTR1989
MTR1991
MTR 1994
MTR1997
3.7
5.7 4.6 4.8
6.4 5.7 5.9
CSO* -0.3 3.7 2.3 5.3 7.2 1.9 2.0 3.0 7.4 7.3
The Educational Revolution and Demographic Change
Tony Fahey and John Fitz Gerald
2.1 Introduction
Ill tile hnmediate post-war years all of tile countries in Northern Europe, with the exception of the Republic of Ireland, reformed and expanded their educational systems. In Northern Ireland, as in the rest of the UK, a substantial programme of investment was undertaken, the educational system was upgraded and participation at both second and third level greatly increased. In the Republic, by contrast, no similar developments occurred in that period. It took approximately 20 years before this neglect of education in the Republic was reversed.
Since tile late 1960s a strategy of investing in education has been pursued with consistency by successive governments. This process was initiated with the publication of Investment in Education1 in 1966 and the introduction of tree second level education in 1967. The development of the system has continued since that date and even in the 1980s, when many other sectors suffered severe cut-backs, the education system survived reasonably intact. In fact the rise in participation rates since 1980 has been even greater than that which occurred under the first 15 years of the "free education" policy.
This study was undertaken with the help of the OECD. It was conunissioned in 1962 and published in 1966. Among its authors were P. Lynch of UCD and M. O’Donoghue of TCD.
In looking at demographic trends in Ireland and their associated dependency patterns, the influence of improved education levels in the population is ubiquitous. It is not just that stronger economic performance in recent years may be pardy the consequence of the long-standing record of educational investment. It also appears that practically all demographic behaviours are influenced by education - particularly the decline in the marriage rate, the fall in fertility, the growing participation of women in the labour force and the peculiar pattern of cyclic migration which has emerged among the educated in Ireland in recent years. Rising educational attainment is still feeding through into the adult population - the first beneficiaries of tree secondary education in the late 1960s are still only in their early 40s, while the products of the education boom of more recent years are still only in early adulthood. The long-term effects of rising educational levels are thus still in the making. We have tried to point to some of these effects in the present study, but it is difficult to predict how the complex interactions which arise from improved educational levels will work out in tile future.
effect as the cause. However, in this chapter we focus on education as an important instrument for this change tracing how it may be affecting marriage fertility, migration and labour force participation.
While the locus of attention is on education as an instrument of change it must be recognised that there are mmw other social and cultural factors which are contributing to rapid change in the demographic structure. For exmnple, as discussed in the next chapter, the opening up of Ireland to the outside world since the 1950s has had profound economic effects. The increased cultural interchange with the rest of Europe is also having a wider impact on society. It is not our task here to exmnine these wider influences on demographic structure. Rather, our purpose is to document recent demographic trends and project future demographic developments, paying close attention to the role of education as an instrument of change.
Mmly of the features of the demographic changes described here are already inevitable given the investment in education which has already taken place and given the pattern of births, deaths and emigration over the last 20 years. However, experience with demographic forecasting in the past has shown it to be, if anything, even less reliable than economic forecasting. Probably the single greatest cause of uncertainty in such forecasts for Ireland ties in the volatile nature of migration. For exmnple, in this Review our central forecast assumes no net migration over the next 10 years whereas less than two years ago the CSO
foresaw the lower bound for emigration being
7,500 per year.2 The present assumption of zero migration could be wrong in either direction - it may prove to be an underestimate of either immigration or emigration.
The key characteristics of the demographic changes under way are: a big reduction in the number of children; a major increase in the proportion of the population in working age groups; a substantial reduction in the dependency ratio, even if unemployment were to continue at the EU average; a rise in life expectancy; a rapid fall from 2000 onwards in the net entry into the labour force.3 Section 2 concentrates on the wider implications of the educational revolution. Section 3 sets out our central forecast for the major demographic variables. Section 4 considers the implications of these changes for the economy and Section 5 summarises our conclusions.
2.2 Educational Change
Participation rates in education, while well below those elsewhere in Northern Europe, increased slowly in the period after 1945 even with no major change in policy. This reflected changing expectations among the population and the gradual increase in the size of the Irish middle class. The decision to introduce tree secondary education in
1967 confkrmed this pattern and greatly strengthened the rate of increase in participation.
2One of the authors, John Fitz Gerald, was Oll the conunittee which advised the CSO in preparing their forecast and, at the time the forecast was made, the assumptions on emigration seemed reasonable to all involved.
The introduction of flee second level education was the single most important change in educational policy over the last 30 years. It led to a steady extension of participation in education, initially concentrated at second level, and more recently reflected in a major expansion in third level education. Ill the 1970s the school leaving age was raised to 15 and a limited system of grant aid to students attending university was introduced. Since tile 1970s third level education has expanded rapidly, involving the construction of Regional Technical Colleges and two new universities, as well as a huge expansion in file number of places provided in file existing universities.
Set out in Figure 2.1 are details of the educational attainment of tile male and female population in 1994 cross-classified by year of birth. This shows how educational attainment levels have risen in recent cohorts but also how they had already begun to rise in tile cohorts which passed through the educational system prior to the late 1960s.
For those born 65 years ago who are now at retirement age, approximately two-thirds left school with only primary education and less than 10 per cent had tile benefit of third level education. Apprenticeships and on-the-job training would have added to tile range of skills in this cohort, but this would have provided only partial compensation for tile low levels of formal education. On average women have been slightly better educated than men in the Republic throughout the last two generations but, as can be seen from Figure 2.2, tile gap has been relatively small.
were down to only 10 per cent of the cohort, with around 60 per cent having at least a Leaving Certificate and around a quarter having some form of third level education.
Figure 2.1: Educational Attainment by Year of Birth, Males
% of total living In Ireland 100
<.,~...~,.X;+~¢ :-,’~; :::;:::::::;:;~::::::’:’~,~’:~.~;’;’;’;":":’:’""";’;’: ...
[image:18.583.292.510.121.448.2]v.,,,,,,.,,,.:.:::::::.-:~::~,,.::::..,,.:..~::::::::~:..::: ~::,:::-::::.:..::::::::::::::::::::::::.’::::::::::::
...:::::::::::":"~’~$::-’::"~:-~:’~i~ ~¢:.":"~’:::::.~::::$::::
2O 0
<1930 1935-39 1945-49 1955-59 1965-69 1930-35 1940-44 1950"54 1960"64
[maPrimary r-’llnter, lllLeaving r’mThirdI
Source: L~bOIJf Force Suwey, 1994
Figure 2.2: Educational Attainment by Year of Birth, Females
% of total living In Ireland
20406050
~~~~~4":’:’:’:’:’: !:~:!:~:!:! !::’:.:’.::.~!!~ 0
<1930 1935-39 1945-49 1955"59 1965-69 1930-35 1940-44 1950"54 1960-64
[mPrimary EDInter. ==Leaving t~ThirdI
source: Labour Force SUrVey, 1994
However, tile educational system continues to develop and the cohort leaving school in September 1995 showed very much higher participation rates in third level education than tile cohort leaving education five years previously.4 At present between 40 per cent and 50 per cent of those leaving the educational system have experienced third level education and over 80 per cent of the population have reached Leaving Certificate standard.. This further rise in participation in the 1990s is quite striking and it is has raised Irish
For those born in tile late 1960s, that is, those who
were aged 25 to 30 in 1994, early school leavers 4McCoy, S. and B. J. Whelan, 1996 The Economic Status of
participation in education up to levels reached in some of the more developed economies and above those currently experienced in the UK.s
Much of file policy advice over the last 10 years concenfing file problem of structural unemployment has concentrated on the need to reduce file numbers leaving the educational system with no qualifications. Figure 2.3 shows the considerable success that has been achieved in this area and this has important labour market implications which are discussed later in this Review. The numbers who are still failing to achieve a minimum of a junior certificate on leaving l’onnal education, while small, represent a fairly concentrated group which has multiple social problems and further progress with this group is likely to prove difficult in the future.
Figure 2.3: Educational Attainment of the Labour Force
100 °/oof 80 60 40 20
0
1991 2001 2011 Source: Labour Force Su treys and ESRI Forecast
DThird Level mLeavinq Cert. rmJunior Cert. rmPdmary
In forecasting future trends in educational attainment it is assumed that there will be a small additional increase in participation at third level together with a small reduction in numbers with only a .junior certificate. It is assumed that the proportion leaving with no qualifications remains
constant at its current low level. The resulting forecasts for the educational attainment of the labour force to the year 2011 are shown in Figure 2.3. (The assumptions on migration which also affect these figures are discussed later.) By that date under 10 per cent of the labour force will have had only a primary education and the proportion with a third level education will be approaching 40 per cent. This Figure illustrates how, even after a number of decades of investment in education, the impact of the continuing change in the level of human capital will affect the economy and society for some considerable time. The policy of upgrading the educational system takes many years to change society and the economy; it can not be seen as a "quick fix" solution to economic and social problems.
In this chapter we have concentrated on participation rates and qualifications attained; we have not considered the "quality" of the education received. This would go far beyond the scope of this study. However, the data published in OECD op. cit. suggest that the quality of the education provided in Ireland is broadly comparable with that available elsewhere. While expenditure per pupil at first and second level may be lower than in some
other developed countries, this appears to have been offset by a number of factors, principally because family and pupil motivation has been high. In the past, especially in rural areas, there was a low opportunity cost of education - pupils had nothing else to turn to, and their parents, from long experience, were convinced that education was file surest way to succeed.
2.3 Demographic Change
The model of demographic behaviour which we use is driven by education. We know the educational attainment of the existing adult population and we lbrecast how the educational participation of future cohorts will evolve. The resulting forecast tbr the educational attainment of the adult population over the next 10 years is not very sensitive to the assumptions on participation as rates are already quite high and most unlikely to tall.
Having determined the educational attainment of. the population, education specific marriage rates are applied to determine file proportion of women in different age groups who are married. (In the past women with third level education were less likely to get married.) In turn, fertility is affected by file changing numbers of women, married and single, in file 20 to 40 age group. In developing the model we have had to rely heavily on file changing pattern of behaviour in the past. What is urgently needed is further research into why these changes are taking place, an understanding which would give a stronger basis for forecasting behaviour in
the future.
We then apply marriage and age specific fertility rates to the population of women to determine the number of births each year. While there is evidence that marriage is declining in importance as a factor dete~anining fertility and labour market behaviour, we do not have information on fertility classified by educational attainment which might allow a more sophisticated approach to forecasting.
Net migration is modelled as a function of relative economic conditions in Ireland and in external labour markets (especially in the UK).6 The macro-economic model is used in deriving the net migration figure. However, within file net migration figure there are significantly greater gross flows in either direction. We make assumptions on the age pattern of the gross flows and on their educational attainment to arrive at file ultimate impact on file population.
Labour force participation by women is greatly influenced by the level of education attained. Tile level of educational attainment also has an impact on male labour tbrce participation.
Marriage Rate
Traditionally Ireland had a very low marriage rate: many never married and those who did so married at a relatively late age. Restricted access to marriage was a vital factor in controlling the birth rate after the famine.7 However, in the 1960s the marriage rate increased rapidly (Figure 2.4). Increasing proportions of successive cohorts of the population married and tim mean age at marriage tell for both males and females. The marriage rate peaked in tile early 1970s and it has fallen quite rapidly since then, especially since 1981.
Life expectancy is assumed to rise roughly in line with file forecasts included in the CSO Population Forecast publication. The improvement is assumed to occur primarily in the population aged over 40.
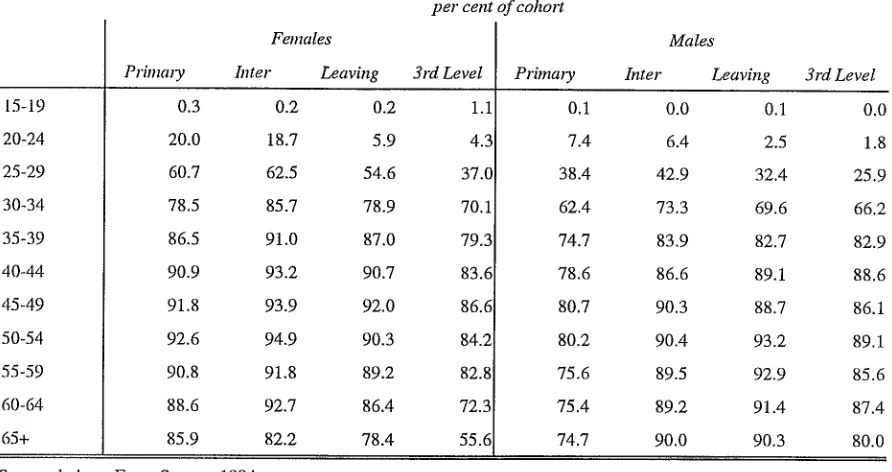
Table 2.1: Proportion of Population Married by Level of Education
15-19 20-24 25-29 30-34 35-39 40-44 45-49 50-54 55-59 60-64 65+
Females Primaly hTter Leaving
0.3 0.2 0.2
20.0 18.7 5.9
60.7 62.5 54.6
78.5 85.7 78.9
86.5 91.0 87.0
90.9 93.2 90.7
91.8 93.9 92.0
92.6 94.9 90.3
90.8 91.8 89.2
88.6 92.7 86.4
85.9 82.2 78.4
per cent of cohort
3rd Level Primary 1.1
4.3 37.0 70.1 79.3 83.6 86.6 84.2 82.8 72.3 55.6
Males
Inter Leaving 3rd Level
0.1 0.0 0.1 0.0
7.4 6.4 2.5 1.8
38.4 42.9 32.4 25.9
62.4 73.3 69.6 66.2
74.7 83.9 82.7 82.9
78.6 86.6 89.1 88.6
80.7 90.3 88.7 86.1
80.2 90.4 93.2 89.1
75.6 89.5 92.9 85.6
75.4 89.2 91.4 87.4
74.7 90.0 90.3 80.0
Source: Labour Force Survey, 1994
Figure 2.4: Marriage Rate 1970-1995
8 Marriages per thousand
7 ::: ...
!1111i 10 1 00°t
6 ::ii :.:~ ...
5 iil
i!i
ii i!!
~ ~!~i
ii~ ....
4
1970N
1975 1980 1985 1990 1995
Source: Vital Statistics
Table 2.1 shows the proportion of men and women married at different ages in 1994 classified by the level of education completed. This shows that the proportion of die older age groups (over 60) ever mara’ied is lower than for the 40 to 60 age group. This reflects the low marriage rate for those of "marriageable age" up to the 1960s. It is interesting that the lower incidence of marriage is particuhu’ly pronounced for those older women who have third level education. This may reflect the particularly difficult choice which laced highly educated women in the pre-1970 era. They had to choose between pursuing a career or marrying and
having children. The gap between the proportion of women with higher education who are married and the proportion of all other women who are married is somewhat smaller for the 30 to 60 age group but it is, none the less, significant, reflecting a continuing tension for such women.
the prospect of inheriting the farm may have been a further factor affecting the incidence of marriage mnong older men in rural areas.
Figure 2.5: Proportion of Women Ever Married, by Age
100 80 60 40 20 0
%
Source: Census of Population and ESRI Forecast
result of increased education as well as wider cultural change are clearly important.
In Figure 2.5 we show our tbrecast tbr the proportion of women married by age in 2011. Here we have assumed that changing patterns of educational participation and changing cultural factors will see some further postponement of marriage. However, we continue to assume that the bulk of the population do get malxied at some stage in their lives so that what we are forecasting is a postponement of marriage rather than an abandonment of it as a social institution.
As shown in Figure 2.5, even with the recent decline in the marriage rate for women in their 20s, the rate to-day for those aged 25-29 is not that different from what it was in 1961. Among women aged 30 and over, a significantly greater proportion are matlied now than was the case 30 years ago. It remains to be seen whether the proportions never man’ying will rise again in the future or whether the pattern of postponing marriage until alter age 30 will continue.
Research suggests that the rise in educational attainment has played a minor direct role in the l~alling marriage rate over the last 15 years.8 For the future the rising proportion of the population who are going on to third level education will contribute to a further tall in the marriage rate. The changes which we are observing are probably driven by many different factors which are interacting to produce the changing roles of women and men in society. Changing expectations as a
Fahey and Fitz Gerald, 1997, op. cit.
Fertility
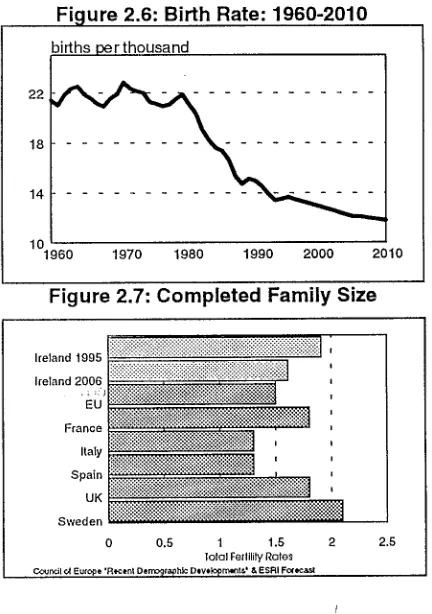
The decline in the birth rate has been one of the most important of the demographic changes to occur in Ireland in recent years. The year 1980 recorded the highest total number of births in the country in the present century (at 74,388). By the end of the 1980s, however, the total had fallen to the lowest on record at 51,669 in 1989. Since then it has fallen further to around 48,000 in 1995, representing a decline of more than a third in a
stabilise below file level which would ensure file natural replacement of the population.
[image:23.577.71.287.432.739.2]In file past, marriage patterns were a central influence oil trends ill fertility. Today, this is much less so as file link between marriage and file decision to have children is now much weaker. Many women have children outside marriage and many married women have few or no children. It is probable that both marriage and child-bearing decisions are al’fected by changes in tile role of women in society, with a far greater participation in the labour force by women of all ages. This clfange in participation is itself partly driven by the change in the educational attainment of tile population. Untbrtunately, dam are not currently available which would ’allow us to examine the pattern of fertility by the social class or educational attaimnent of the mother. Such data could help throw light on tile underlying causes of the rapidly changing pattern of behaviour in the field of marriage and fertility.
Figure 2.6: Birth Rate: 1960-2010
births per thousand 22
18 14
i
10
~geo ~97o ~98o ~99o 2000 2o~o
Figure 2.7: Completed Family Size
2.5
The rise in unmarried parenthood in recent decades has occurred mainly among mothers aged under 25. While overall fertility among young mothers declined during the 1980s, it was marked by a sharp "retreat from marriage" among that group -the majority of births to mo-thers under age 25 now occur outside marriage. Among mothers in their late twenties and thirties, by contrast, the vast majority of births occur within marriage. It also appears that many mothers who begin family formation outside of marriage in their teens or early twenties subsequently marry as they grow older. The decline in the role of marriage in family formation, therefore, is concentrated in the earliest stages of family formation and among those who begin child-bearing at a young age. Marriage retains its traditional place in family formation among those who have their first birth after age 25. It is also important as a somewhat delayed option among those who have their first birth outside marriage at a young age. While the role of marriage in family formation is changing, it would be easy to underestimate its continuing significance for family life in Ireland, even among those who begin their families outside of marriage.
mothers to marry them.9 Better educated women are more likely to defer fmnily formation until they have secured their labour market position and many choose not to have children at all. Well-educated women have always had lower marriage rates, so that their growing presence in the population tends to push overall marriage rates downwards. The increasing share of well-educated women mnong those of marriageable age thus goes some way towards explaining the decline in marriage rates in recent years. Better-educated women who do have children are more likely to have partners who are themselves reasonably secure in jobs - and thus to be more attractive as potential husbands and supporters of children. This helps explain the lower rate of unmarried parenthood mnong better educated women.
In forecasting fertility we have modelled separately the behaviour of married and single women. We have assumed that there is a continuing rapid decline in fertility of married women in their 20s reflecting the increased participation in education. However, we have assumed that there is little change in fertility for women in their 30s. It is possible that the rise in educational attainment could see an even more rapid decline in fertility of women in their 20s as they establish their careers in the labour market and that this could be counterbalanced by a rise in fertility in their 30s. However, in the absence of research on the factors driving fertility it is exceptionally difficult to forecast future patterns of behaviour.
Figure 2.7 shows the Total Fertility rates (TFRs) for a number of other EU countries in the early 1990s.1° This shows how Ireland’s current fertility rate lies within the range of experience of these other countries. In Sweden fertility fell to low levels in the 1970s recovering to the current position where fertility there is now at the top of the EU league. In Southern Europe - Italy, Portugal, Spain and Greece - fertility began to fall much later and is still at a very low level. There is no single explanation for these diverse trends which could help inform our forecast for Ireland. Postponement of having children was certainly a factor in Sweden but it was only one of many factors. The advent of more parent-friendly policies there in the 1980s may have helped facilitate the recovery in fertility. However, it is clear that in forecasting fertility each country’s experience must be considered separately.
Figure 2.8: Total Fertility Rate
o
1961 1966 1971 1981 1986 1991 1996 2OOl 2006 2Oll Source: Census of Population and Vital Statistics
9 Hannan, D., and S. O’Riain, 1993, Pathways to Adulthood in
h’elan& Causes and Consequences of Success and Failure in Transitions among Irish Youth, Dublin: The Econolnic and Social
Research institute General Research Series Paper No. 161.
Figure 2.9: Births to Single Mothers
% oftotalbiffhs 25
20 15 10 5 0
1961 1966 1971 1981 1986 1991 1994
Source: CSO, Vital Statistics
While there is some sign that the long-term fall in die fertility rate in Ireland (Figure 2.8) may have been halted in the last 2 years we feel that this is likely to be only temporary. We have assumed that the fertility rate will continue to decline over the next 10 years to a level of 1.6 children per mother in the middle of the next decade. This would lie between the upper and the lower bounds of the CSO l’orecast published in 1995. The resulting ilnplications for the total number of births and for the birth rate are shown in Table 2.2. Because of the relatively hu’ge size of the female population of child-bearing age, the number of births remains relatively high even as the TFR falls, as shown in Figure 2.8.
As shown in Figure 2.9, since the late 1970s there has been a rapid rise in the proportion of births to single mothers. Today they account for a quarter of all births. Unfortunately, we do not have satislhctory information on the educational or social background of these mothers so it is difficult to analyse the implications of these trends for labour market behaviour or for the demand for social services. We do not know to what extent these women and their children lack the support of the fathers and how long they are likely to remain a separate fmnily unit. It is clear that a substantial
[image:25.577.306.521.111.316.2]proportion of such mothers have in the ,past subsequently married.
Table 2.2: Assumptions on Fertility, Births, Deaths and Life Expectancy
1996 2001 2006 2011 Total Fertility 1.88 1.75 1.63 1.61 Rate
Births (Thousand) 49.5 47.7 45.6 45.7 Birth Rate (per 13.7 12.9 12.1 11.8 Thousand)
Deaths 30.3 31.6 31.5 31.9
(Thousand)
Death Rate (per 8.4 8.5 8.3 8.2 Thousand)
Male Life 73.3 74.0 74.7 75.4
Expectancy /
Female Life 78.6 79.4 80.2 81.1 Expectancy
Life Expectancy
hlcreases in life expectancy have been one of the factors contributing to population ageing in other countries. One of the reasons for the slower rate of population ageing in Ireland has been the limited increase in life expectancy at older ages which has occurred in this country. Life expectancy mnong older people in Ireland is now among the lowest in
the western world (excluding a number of eastern
European countries which recently have experienced catastrophic declines in life expectancy),la In the early part of the present century, Ireland not only had a comparatively high overall life expectancy by the standards of the day, it also had reasonably high levels of life expectancy among older people)2
Since the 1920s, life expectancy at birth has increased greatly in Ireland - from 57 years in
u Fahey, T. and P. Murray, 1994. Health and Autonomy Among
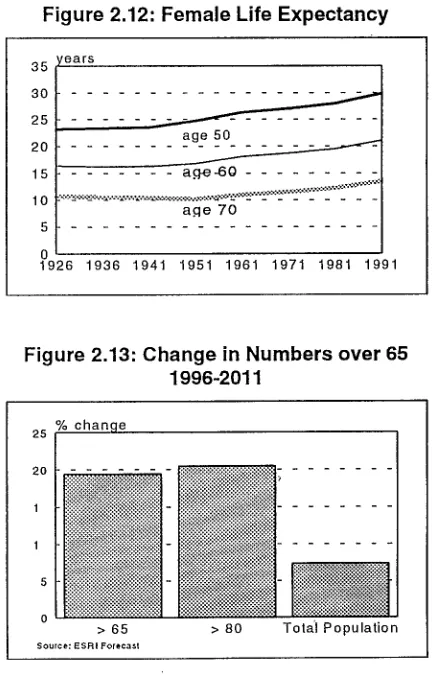
1926 to 72 years in 1991 for males and from 58 to 78 years for women over the same period (Figure 2.10). However, by far the largest share of this increase has been due to declines in mortality in childhood and early adulthood. Life expectancy increases at older ages have been very slight, principally because life expectancy for older men has scarcely increased at all (Figure 2.11). In 1986, life expectancy tbr men at age 65 (which was 12.6 years) was marginally lower than it had been in 1926 (when it was 12.8 years). Over the same period, life expectancy for women at the same age increased by only 2.8 years (from 13.4 in 1926 to 16.2 in 1986), a very modest increase by the standards of other countries. While mortality rates mnong children in Ireland are now among the lowest in the world, mortality rates among older people are comparatively high and constitute one of dae more important failures in public health in this country.
Older age mortality showed significant improvement in the late 1980s. In the period 1986-1991, life expectancy in Ireland increased by 0.8 of a year in d~e case of men at age 65 and by 0.9 of a year in the case of women at that age. For men, dais was an historically novel increase (and is retlected in Figure 2.11 by the sudden upward movement at die end of the trend-lines for males) and in the case
of wonlen represented a stronger rate of improvement than had occurred previously. However, these recent improvements still leave life expectancy in Ireland below the average of its ELI neighbours (Figure 2.10).
In forecasting the future we follow the pattern assumed by the CSO in making their population projections seeing a significant improvement in life expectancy tor both men aud women over the next
20 years (Figure 2.13). The CSO projections see life expectancy in Ireland rising over the next 30 years towards the highest levels seen in Europe to-day.13 However, a further rise can be expected in the best European figures from to-day’s levels leaving Ireland’s relative position more-or-less unchanged.
Figure 2.10: Life Expectancy at Birth, 1991
Denmark ~i!i!i~i!i!i~i!i!i~i!i~i!i~i~i!i~i~i~ili!i!iiiiiiiii!i~iiiiiii~i:i:i!i!ili!i!i!I ,
France m ~:;:~:i:~:i:i:i~:~:;:~:i:~:~:~:?~:~:!:}:! ’!:!:?~:;:;:i:??~:~:~:~:;:;i~:::i:i:i:i:;:~:~:~:!:!:!:::i:i:~:~:~ ::~:~:t
Ireland ¯ ’ ’ ’ ’
::::::::::::::::::::::::::::::::::::::::::::::::::::::::::::::::::::::::::::::::: ii
Netherlands ::::::::::::::::::::::::::::::::::::::::::::::::::::::::: ...i: ...!:!:::::::iil
Spain !!!i;i~i~i;i;i~:~i~i;:;:i:ii:~:~:}:i:i:::i:i:~:~:::::::’:i ...i: ...i:: !:!:!ii:i:iq
UK :~:~:~:~:~:~:;:~:;:~:i:;:i~:i:::i:i:i:;:i:~:~:~:~:~:~:~’:;~:~:~:~:~:~:~:~:~:~:~:~:~:~:~:~:i:;:i:!:] ’ 72 74 76 78 8’0 82
years I n Males ~ Female~t
Council of Europe ’Recent Demographic Developments" & ESRI Estimate
Figure 2.11: Male Life Expectancy
30 25 20 15
10 5 O
... a~eSO ... aqe 60 aqe 70
1926 1936 1941 1951 1961 1971 1981 1991
In spite of the improvement in life expectancy the overall number of people aged over 65 will grow relatively slowly over the next 15 years because of the continued impact on the population profile of the emigration of the 1950s. Figure 2.13 shows our forecast for the change in the numbers aged over 65 and aged over 80 between 1996 and 2011. While rising more rapidly than the population as a
whole, die change in numbers will still leave the
old-age dependency ratio in 2011 very low by EU
[image:27.583.72.288.106.451.2]standards.
Figure 2.12: Female Life Expectancy
ears 35
25
age 50 20 ...
15 ... a.q-e -60 ...
a.qe 70
5 0
1926 1936 1941 1951 1961 1971 1981 991
Figure 2.13: Change in Numbers over 65 1996-2011
25
20
1
1
5
O
Yo chan e
N- i-- ....
> 65 > 80 Total Population
Source: ESRI Forecast
Migration
Incorrect migration assumptions have been the
single most important source of error in previous
demographic prqiections for Ireland. The history of
hu’ge-scale emigration in Ireland goes back to the
18th century, but wide fluctuations in migration
rates have occurred over that period and migration
patterns have become even more unpredictable in
recent decades. While other European countries
also experienced extensive net emigration up to the
1930s (e.g. Norway), Ireland has been exceptional
in Western Europe in experiencing substantial net
emigration in the post-war era. In the 1950s
emigration peaked with up to a third of the cohort
of potential labour market entrants leaving for
employment elsewhere. The economic recovery of
the 1960s saw a fall off in emigration and in the
early 1970s the flow was reversed (Figure 2.14) as
many of those who left in the 1950s returned.
However, there was a continuing, though much
reduced, outflow of those entering the labour
market which was masked by the inflow of
returned emigrants.
Figure 2.14: Net Emigration
Thousands
6O
40
2O
0
-20
1955 1960 1965 1970 1975 1980 1985 1990 1995
With the deterioration in economic circumstances
in the 1980s there was a return to significant net
emigration. This emigration reached a peak in the
late 1980s. However, the exceptional performance
of the Irish economy in the 1990s has seen the
pattern of net emigration once again reversed to be
replaced by a small level of net immigration in the
intercensal period 1991-96.
Economic research has shown that net migration
from Ireland is sensitive, not only to labour market
circumstances in Ireland, but also to labour market
circumstances in the markets where migrants
traditionally go.t4 In the post-war years this has
14 Walsh, B., 1974, "Expectations, Infornration and Human Migration: Specifying an Econometric Model of Irish Migration",
Journal of Regional Science, Vol. 14. Honohan, P., 1992, "The
LinkBetween Irish and UK Unemploymelg", Quarterly Economic
Commentary, Spring, Dublin: The Economic and Social Research
been predominantly the UK. Tile models estimated on the post-war data suggested that migration has
tended to be outwards where the Irish unemployment is more than 4 percentage points above the level in the UK and inwards where it falls below that level. The peak in emigration in the late 1980s was driven as much by the improved htbour market circumstances in the UK as by the problems on the domestic labour market. Many of those who left already had jobs in Ireland but they felt their employment prospects would be better in the UK.
However, this traditional model has not proved a very good guide to migration patterns in recent years. While in file latest version of this model sepm’ate migration equations for men and women still fit file data tbr the last 20 years (with the equilibrium difference between the Irish and the UK unemployment rates still remaining at 4 per cent for both women and men) there is no certainty that it will hold good in the future in the lace of major changes in the Irish labour force.
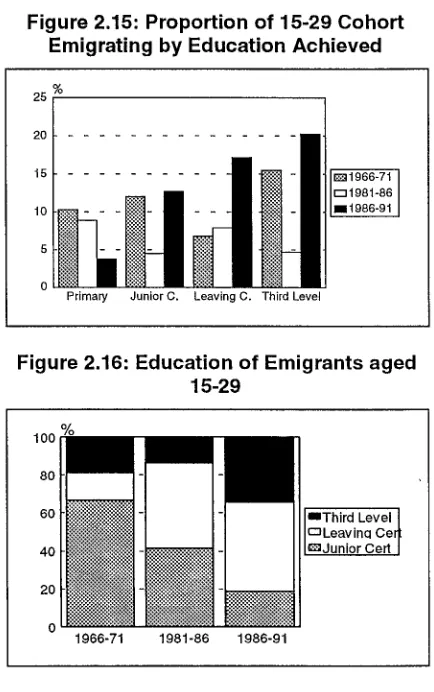
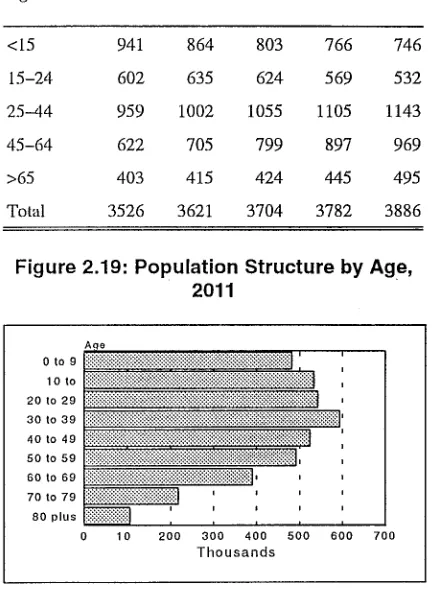
In file late 1960s between 10 per cent and 15 per cent of the cohort in their late teens or 20s left (Figure 2.15).15 The proportion was somewhat higher tor those with third level education but the difference in propensity to emigrate across the different levels of educational attainment was relatively small. By contrast, in the late 1980s up to 20 per cent of those with third level education appear to have emigrated while under 5 per cent of those aged 15 to 29 with only primary education left. Figure 2.16 illustrates this contrast between the late 1960s and the late 1980s: in the late 1960s
[image:28.585.296.513.137.483.2]two-thirds of emigrants had at most an Intermediate Certificate level of education whereas in the late 1980s they accounted for under 20 per cent of emigrants and about a third of emigrants had a third level education.
Figure 2.15: Proportion of 15-29 Cohort Emigrating by Education Achieved
25
20
15
10
5
0
Primary Junior C. Leaving C. Third Level
Figure 2.16: Education of Emigrants aged 15-29
Figure 2.17: Females who have Resided Abroad
35 30 25 20 15 10 5
Under 25 30-34 40-44 50-54
" --- m
25°29 35 39
vu&~l SoUme: census o PO~UI~IIon
60-64 70-74 65"69 75+
Figure 2.18: Comparative Unemployment Rates by Educational Attainment, 1994
% 20 [
15
10
5
°13elow Leaving Non Univ. 3rd Level
Leaving University
r~lreland =-UKI
Source: OECD Educat on at a Glance,
Irish.16 Figure 2.18 also shows that there was no difference in the low unemployment rates for graduates in the UK and Ireland in that year. This would suggest that for those with a good education they will expect similar labour market prospects in Ireland to those available elsewhere in the EU. For those with very limited education they have become increasingly dependent on the Irish welfare system and external labour market developments are increasingly irrelevant to them.
However, while the better educated have more recendy accounted tbr a disproportionate share of emigrants there is evidence that a much higher proportion of such einigrants subsequently return to Ireland. Figure 2.17 shows the proportion of men and women ill 1991 who had previously lived
abroad for at least a year. This shows that for die adult population as a whole over 10 per cent of men and women had lived abroad and had returned. However, tbr those with a third level education aged 40 and over, 30 per cent had such experience. This very high rate of return for the best educated emigrants is important in dispelling fears of a "brain drain". As discussed in Chapter 3, in returning these former emigrants bring with them enhanced skills and experience.
Looking to the future it seems likely that the model of behaviour which explained migration in the past will prove less reliable. Figure 2.18 shows that in 1994 file rate of unemployment for those with no education~d qualifications was substantially higher in Ireland than in the UK. It would appear that for this group file 4 percentage point gap between the
UK and Irish unemployment rates is no longer relewmt. This pardy reflects file reversal in die 1980s of the position in previous decades when the UK welfare system was more generous than the
As discussed later, in the light of the changing pattern of educational attainment it seems likely that the equilibrium gap between the Irish and the UK unemployment rates will narrow. However, given the prospective rate of growth in employment in Ireland (Chapter 6) it seems likely that this trend will still be consistent with zero net migration out to 2005. Thereafter, if economic growth were to continue above the rate experienced elsewhere in the ELI (as in the Central Forecast) there could be significant net immigration of around 7,000 a year to 2010.
However, as discussed later in Chapter 6, considerable uncertainty surrounds this forecast. The rapid rate of growth in Ireland and the character of some of the employment being generated now seems to attract in a greater number of immigrants, some not of an Irish background. A rise in unskilled wage rates might make employment in Ireland attractive to some categories of unskilled workers elsewhere in the EU while still not being sufficient to make employment worthwhile for those eligible for Irish
welfare rates. This might stimulate migration into Irehmd of marginal workers from other EU countries, such as those originating in poorer, non-EU countries who do not have full non-EU citizenship rights. The Irish welfare system may also prove attractive in the future for immigrants who can qualify for assistance.
As discussed in Chapter 6, while our Central Forecast envisages some net immigration alter 2005, it may well be the case that the slow-down in the growth in labour supply will result in rising labour costs and a related slow-down in the growth in output and employment. This could obviate the need for such net hnmigration.
As we move into the next decade, the stock of Irish emigrants abroad, which received a considerable boost in the late 1980s, will be ageing and they may by then have settled permanently in their new country of residence. This could also result in a drying up of returned emigrants. Whether they would be replaced by immigrants of similar skills who are not of Irish origin remains doubttul. Clearly, a range of issues concerning the factors driving migration remain to be researched. Until they are, the forecast for migration will remain the single most uncertain aspect of our demographic projections.
Population
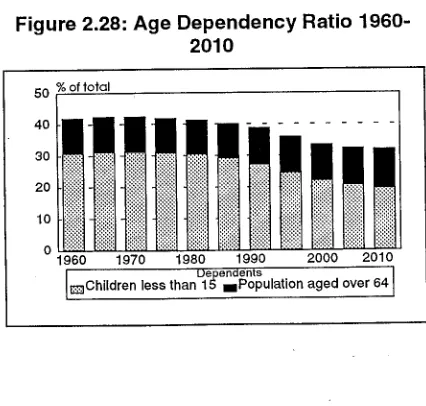
The assumptions set out above provide the backdrop to our forecast Ibr the population out to 2011 described in Table 2.3. This Central Forecast sees the population rising to 3.89 million in 2011. While this is within the range foreseen in the CSO’s projections published 2 years ago, the structure of the population is rather different. The
biggest single difference between these figures and the CSO forecasts arises from the changed assumptions on migration. The CSO figures assumed a lower bound for migration of 7,500 out to 2006 where we are assuming zero net migration over the period.
Figure 2.19 shows how the population structure will look in 2011. The assumption on migration is that there is a continued constant immigration of children (with their parents) over the period. These would be families formed abroad by former emigrants from an earlier period. While this has been an important feature of Irish migration experience in the past, it could prove different in the next decade as the stock of former emigrants still resident abroad falls. This assumption explains the fact that, even with a substantial fall in fertility and a reduction in the number of births, the numbers of children in Ireland may not show as rapid a decline as might otherwise have been expected.
The effects of the "baby boom" of the 1970s can be seen in the cohort which will be aged 30 to 39 in 2011 (Figure 2.19). This cohort is currently aged
15 to 24 and it has benefited from the high birth rate of the 1970s and the low rate of emigration of fmnilies in the intervening years. The size of this cohort relative to all others will continue to influence the Irish population profile for decades to come.