Summary
• Productivity growth is a key determinant of national competitiveness, enabling firms to compete
successfully in international markets by facilitating output to be produced more efficiently. It is, arguably, the most important factor determining long-term economic growth, sustainable wage rates and funding for public services.
• Labour productivity (output per hour worked) and total factor productivity (the efficiency by which
labour and capital are used together) are the two measures of productivity most commonly used.
• Ireland’s labour productivity has been catching up with the other developed countries since the mid-1990s, with GDP per hour worked above the OECD average and advanced economies. However, this aggregate measure of productivity masks a number of underlying issues.
• On a Gross National Income (GNI*) basis, Ireland’s labour productivity is below some selected
frontier economies (e.g. Germany and the US), although slightly above the UK, Japan and the OECD average.
• When the contribution from the 7 per cent rise in the capital intensity of firms is deducted from labour
productivity growth, Ireland’s total factor productivity stagnated over the period 2006-2014.
• At sectoral level, there is considerable heterogeneity with Ireland’s productivity performance built
upon a narrow base of highly-productive (mainly foreign-dominated) sectors such as Pharmaceuticals and ICT.
• In turn, within those sectors, Ireland’s performance is greatly affected by the influence of a small
cohort of large, highly-productive enterprises (‘frontier firms’).
• The narrow base of enterprises in high value-added sectors, and within sectors, disguises many
underperforming firms where productivity growth is stagnant or falling.
• This divergence is not uncommon in OECD countries but is more severe in Ireland; the OECD recently
published firm-level research showing that the labour productivity gap between frontier (mostly foreign-owned) and lagging (mostly domestically-owned) firms is widening over time, which indicates the difficulties the majority of firms face in order to catch up with rapidly-expanding global firms.
• These findings also reflect the highly-concentrated nature of Ireland’s economy showing that the
top 10 per cent of firms (in terms of sales) account for 87 per cent of valued-added in manufacturing and 94 per cent in services.
• Policy to enhance Irish enterprise productivity should be comprehensive and tackle multiple aspects
within firms (e.g. innovation and KBC), between firms (e.g. spillovers) and across industries (e.g.
Background
The National Competitiveness Council (NCC) was established in June 1997, and is an independent advisory body that reports to the Taoiseach and the Government, through the Minister for Business, Enterprise and Innovation, on key competitiveness issues facing the Irish economy and offers recommendations on policy actions required to enhance Ireland’s competitive position. In September 2016, the European Council issued a recommendation calling on the eurozone member states to establish National Productivity Boards and in March 2018, the Government mandated the NCC to assume the role as Ireland’s National Productivity Board.
The Council has a strong record of emphasising the importance of productivity as a key determinant of competitiveness, prosperity, wages and ability to finance public services. In 2006 and 2012, the Council published reports on Ireland’s productivity performance spanning the period 1980-2011 and its latest release in February 2017 benchmarks Ireland’s productivity performance for the period 2004-2014.
Following this research, and the data gaps identified, the Council recommended in its Challenge Report 2016 that the Central Statistics Office (CSO) produce comprehensive statistics and indicators on productivity for the Irish economy, which was successfully implemented in May 2018 with the first release of the CSO’s statistical publication, Productivity in Ireland 2016.
Following on from the March decision of Government, in its role as National Productivity Board, the NCC decided to produce an annual productivity statement to track the performance of the Irish economy in this regard. Building on the ongoing productivity research and publication by the Council, this document comprises the first NCC Productivity Statement.
Introduction
Productivity growth is a key factor of national competitiveness as it enables firms to compete successfully in international markets by facilitating output to be produced in a more efficient and effective manner. Ultimately, productivity is the engine of economic growth in the medium term, the main driver of improvements in living standards, a key determinant of the sustainable wage level, and a key factor determining our ability to finance public services.
Two measures of productivity are commonly used:
Labour Productivity, which is measured as output (e.g. GDP or GVA) per person engaged or output per hour worked, and
Total Factor Productivity (or multi-factor productivity), which measures the efficiency by which both labour and capital are used together in the production process. Total Factor Productivity distinguishes from labour productivity as it controls for the capital intensity of firms or capital deepening in the economy (i.e. capital per worker).
Global trends
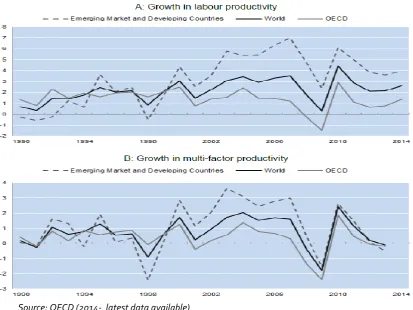
In recent years, advanced economies have experienced a trend decline in productivity growth, a phenomenon that predates the financial crisis (OECD 2015)1. The global productivity slowdown started in the 1990s but
accelerated before the 2008 economic crisis. As Figure 1 shows, the declining trend was more exacerbated in OECD countries than elsewhere and it was consistent across any measure of productivity.
[image:4.595.89.503.283.593.2]This ‘productivity puzzle’, so-called as it comes despite rapid technological advancement, is one of the factors behind the global low growth environment and, to the extent that labour productivity growth remains sluggish, will act as a drag on real wage growth (and hence in living standards) in the years to come.
Figure 1. Global trends in labour and multi-factor productivity growth, 1990-2014
Source: OECD (2014- latest data available)
Irish Productivity
Ireland’s labour productivity has been catching up with the rest of developed countries since the mid-1990s, with GDP per hour worked (both growth rates and levels) now clearly above the OECD average and advanced economies. However, this aggregate measure of productivity actually masks a number of underlying issues.
Figure 2. Labour Productivity, GDP and GNI* Per Hour Worked (USD - 2010 PPPs)
Source: CSO, OECD
First, on a Gross National Income (GNI*) basis, which strips out the impact of globalisation activities, Ireland’s labour productivity level is below some selected frontier economies (Germany and the US), although slightly above that of the UK, Japan and the OECD average, but only after the 2008 recession.
Figure 3. Contribution to Labour Productivity = Capital Deepening + Multifactor Productivity
Source: OECD (2014 latest data available)
Second, when the contribution from the substantial rise in capital deepening2 (7 per cent growth) is deducted from labour productivity growth, Ireland’s multi factor productivity actually stagnated (0.2 per cent growth) over the 2006-2014 period (Figure 3). These trends are further exacerbated if the 2015-2016 period is included in the analysis, according to the CSO3.
2 Ireland is the OECD country with the highest annual growth in total capital services (mostly due to intellectual property
investments) between 2001 and 2016. Due to diminishing returns, the country shows the second lowest growth rate (after Portugal) in capital productivity, i.e. output per unit of capital services, over the same period. This declining trend in the efficiency of capital is particularly exacerbated in domestically-dominated sectors.
3CSO (2018), “Productivity in Ireland 2016”, Central Statistics Office, Dublin.
30 40 50 60 70 80 90 199 6 199 7 199 8 199 9 200 0 200 1 200 2 200 3 200 4 200 5 200 6 200 7 200 8 200 9 201 0 201 1 201 2 201 3 201 4 201 5 201 6 201 7
France Germany Ireland (GDP)
Japan UK USA
[image:5.595.106.508.436.602.2]Although Irish labour productivity still grew at 2.3 per cent (on average) over the same period, the marked decline in multifactor productivity growth highlights slower efficiency improvements in production processes.
Third, beneath the aggregate trends there is a considerable heterogeneity across sectors to the extent that Ireland’s productivity performance is built upon a narrow base of highly productive (mainly foreign-dominated) sectors.
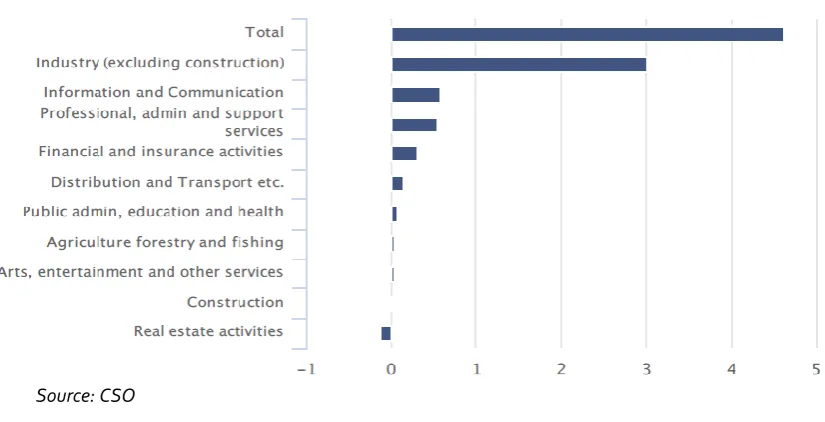
[image:6.595.89.502.296.507.2]Figure 4 shows that Industry (i.e. manufacturing) made the largest contribution to overall labour productivity growth over the period 2000-2016. This was followed by Information and Communication, Professional, administration and support services, and, to a lesser extent, Financial and insurance activities. The sectoral contribution is similar to that when the period 2015-2016 is excluded.
Figure 4. Sectoral Contribution to Labour Productivity Growth: 2000-2016, (average percentage contribution)
Source: CSO
This significant sectoral variation in Ireland relative to the euro area is considered in Figure 5. It shows that the Irish productivity gap is positive but fundamentally driven by only three sectors - Food products, beverages and tobacco, Chemicals and pharmaceuticals products and Information and communication activities. The gap in all the other manufacturing sectors is negative, while some other service sectors like Finance and Professional and Scientific activities show a positive gap.
Fourth, even within the manufacturing and ICT sectors, Ireland’s performance is greatly affected by the influence of a small cohort of large and highly productive enterprises (also known as ‘frontier firms’), which recovered relatively fast after the crisis. These firms tend to be foreign-owned and are not just the frontier firms in Ireland, but globally4.
The narrow base of enterprises in high-value added sectors, and within sectors, disguises the majority of underperforming companies (also known as ‘lagging firms’), where productivity growth is stagnant or falling. A large share of these companies tends to be domestically-owned.
4More data and research is needed to distinguish between firms operating at the international frontier and those
Figure 5. Sectoral Productivity Gap with respect to the Euro Area, 2014
Source: EU KLEMS (latest data available)
[image:7.595.162.449.496.652.2]Figure 6 shows that labour productivity in the foreign-dominated sectors grew by almost 140 per cent between 2000 and 2014 (or 6.5 per cent annually), while the Domestic and Other sector saw an increase in productivity of just 50 per cent over the same period (or 2.4 per cent annually). If the level shift in 2015 were included in the analysis, then the productivity gap between foreign- and domestic-dominated sectors would be even wider.
Figure 6. Foreign vs. Domestic and Other sector labour productivity, 2000-2016 (2000=100)
Source: CSO
From a more granular perspective, the OECD has recently published firm-level research5 showing that the
labour productivity gap between frontier (mostly foreign-owned) and lagging (mostly domestically-owned) firms is indeed widening over time in both the manufacturing and service sectors (Figure 7).
5Papa et al (2018), “Patterns of Firm Level Productivity in Ireland”, OECD Productivity Working Papers, 2018-15, OECD
Publishing, Paris.
-100% -80% -60% -40% -20% 0% 20% 40% 60% 80% 100% 120% 140% 160% 180% 200%
0 50 100 150 200 250 300 350 400 450 500
2000 2001 2002 2003 2004 2005 2006 2007 2008 2009 2010 2011 2012 2013 2014 2015 2016
Figure 7. Labour productivity trends for frontier (p90) and lagging (p10) firms
Source: Papa et al (OECD 2018) on the basis of CSO data
Note: The top (frontier), median and bottom (laggard) performers, respectively, correspond to the p90 (p97), p50 and p10 percentiles of the productivity distribution in Ireland.
The disparity in productivity levels between frontier and lagging firms has also tended to translate into gaps in skills and wages, contributing to Ireland’s high level of market income inequality.
These findings reflect the highly-concentrated nature of Ireland’s economy. While this is a feature in many OECD economies, it is more pronounced in Ireland. Indeed, the same empirical research also shows that the top 10 per cent of firms (in terms of sales) account for 87 per cent of valued-added in manufacturing and 94 per cent in services. This highlights Ireland’s exposure to firm-specific shocks and poses a challenge to the economy’s resilience in the medium term.
Drivers of Productivity Growth (Slowdown)
Internationally, the reasons behind the global aggregate productivity growth slowdown (see Figure 8) are generally attributed to:
(i) reduced innovation and productivity growth amongst frontier firms;
(ii) allocative inefficiency whereby resources (i.e. capital and labour) within a sector are not being deployed from the least productive to the most productive firms through competition; and
(iii) lack of technology diffusion (i.e. productivity spillovers) from FDI-related frontier firms to the rest of the economy through trade linkages, labour mobility and research collaboration.
Figure 8. Drivers of aggregate productivity growth (slowdown)
Moreover, resource allocation (from the least to the most productive firms) in Ireland already appears to be highly efficient when compared to other OECD countries, although these results are mainly driven by the foreign-dominated manufacturing sectors (Papa et al 2018). Further re-allocation of resources (e.g. labour) may lead to greater concentration and dualisation of the Irish economy and thus less diversification of Ireland’s competitive base.
More importantly, the widening productivity gap, which is behind the productivity slowdown, seem to be mainly caused since the mid-2000’s by the lack of technology diffusion from frontier (mostly foreign-owned) to lagging (mostly domestically-owned) firms.
Recent research by the ESRI 6 has found very limited evidence of positive productivity spillovers in Ireland. On
average, the productivity impact of having forward (foreign-owned firms supplying local firms) or backward (local firms supplying owned firms) trade linkages with industries that have a high share of foreign-owned firms is not discernible. In some cases, such impact is negative indicating that local firms may be crowded-out by multinational enterprises.
Positive productivity spillovers only seem to materialise (through backward trade linkages7) when indigenous
service firms invest in knowledge-based capital8 (KBC) such as R&D to augment their absorptive capabilities.
But even in this case, in Ireland the productivity spillovers depend on the origins of the multinational as they can be negative from non-EU services companies and EU manufacturing companies.
Since international competition to attract foreign multinationals is becoming increasingly strong, the long-term sustainability and competitive base of the Irish economy will depend more on the innovative performance of local business, their links with foreign-owned firms and the diversification across industries where both local and FDI-related firms operate. This should be the focus of Government policies.
6ESRI (2018), “Productivity spillovers form multinational activity to indigenous firms in Ireland”, ESRI Working Paper No.
587, Dublin.
7 This is local firms supplying foreign-owned firms.
Productivity-Enhancing Policies
Policy design to enhance Irish enterprise productivity should be comprehensive and tackle multiple aspects within firms (e.g. innovation and KBC), between firms (e.g. spillovers) and across industries (e.g. diversification) to ensure an effective, broad and sustained impact on Ireland’s competitive base.
Drawing on recommendations from the NCC, OECD and the Department of Business, Enterprise and Innovation, the following is a set of policy considerations that emerge from our findings in this Statement:
Policies to enhance productivity within firms (innovation & KBC)
Research by the ESRI for the Department of Business, Enterprise and Innovation (2017a)9 showed that Irish-owned firms’ innovation expenditure per employee is not much different from that of foreign-owned firms. Indeed, the propensity to invest in innovation is higher for Irish-owned firms. However, foreign-owned firms are systematically more productive than Irish-owned firms (including exporters) across all sectors, size, age and types of innovation investments. This is because many foreign-owned firms are not just the frontier firms in Ireland, but globally. They are global leaders in innovation and management practices and attract highly-skilled labour from across the world. The Irish operations of these companies, in turn, invest heavily in R&D and staff training to ensure they have the capacity to absorb fully, implement and optimise the innovations developed by the company globally.
From a policy perspective, it is important to understand why Irish-owned firms’ relatively large expenditure on innovation does not translate directly into productivity gains as strongly as in the case of foreign-owned firms. The reasons preventing innovative local firms from becoming global frontier firms may range, for example, from inadequate management practices to inadequate investment in tangible and intangibles assets.
International research indicates that there is a strong relationship between management practices and business performance. However, the Report of the Management Development Council (MDC 2010) found a poor level of management skills amongst Irish businesses. Therefore, further research linking management practices and productivity gains (ONS 2017)10 in Ireland should be carried out.
Policies should also aim to identify, and target, complementary investments between tangible and intangible assets such as R&D, skills, software, organisational know-how and other forms of knowledge-based capital (KBC) activity at firm level amongst Enterprise Ireland and IDA Ireland client companies. This should lead to tailoring the policy support to specific groups of firms with similar characteristics including ownership, size and sector.
Along these lines, research by the ESRI for the Department of Business, Enterprise and Innovation in 201711 showed that investments in R&D (per employee) seem to have a positive impact on Irish firms’ productivity, particularly in the food manufacturing sector, while investment in software seems to impact only foreign firms’
9ESRI (2017a), “The impact of investment in innovation on productivity: firm-level evidence from Ireland”, ESRI Working
Paper No. 571, Dublin.
10 Office for National Statistics –ONS (2018), “Management practices and productivity in British production and services
industries - initial results from the Management and Expectations Survey: 2016”, ONS, UK.
11ESRI (2017b), “The impact of investment in knowledge-based capital on productivity: firm-level evidence from Ireland”,
productivity in the non-food manufacturing sector. Investments in organisational capital are likely to have an impact on productivity across all firms while investments in intellectual property assets may only affect (slightly) the productivity of foreign firms in the non-food manufacturing sector. Further research is needed to understand the extent to which investments in specific types of KBC either complement, or substitute, investments in other intangible assets and how they can create more synergies with tangible assets.12
Policies to enhance productivity between firms (spillovers and collaboration)
As shown above, the best way to bridge the widening productivity gap between frontier and lagging firms would be to facilitate technology diffusion and knowledge spillovers through trade linkages, labour mobility and innovation collaboration, including augmenting the absorptive capacity of indigenous firms through closer links with public research institutions.
Policies to strengthen and intensify linkages between indigenous and multinational enterprises should include active engagement by the Enterprise Agencies to assist suitable indigenous firms to optimise supply-chain business opportunities and reviewing the impact of the Global Sourcing Initiative.
Similarly, while Ireland’s resource allocation is highly efficient compared to other OECD countries, one way to diversify Ireland’s competitive base would be to focus on policies that facilitate labour mobility and knowledge spillovers in indigenous firms, e.g. encourage the mobility of workers from foreign-owned enterprises. However, a significant obstacle is the level of pay in the indigenous sector. Indeed, the tightening labour market, and the presence of a large multinational cohort competing for skilled labour, results in Irish indigenous SMEs facing difficulties in offering market-level wages. In an effort to address this issue, the Irish Government introduced an SME-focussed, share-based incentive scheme for key employees (Key Employee Engagement Programme - KEEP) in January 2018. According to the European Commission, firms offering employee financial participation are more likely to experience significant increases in both productivity and employment and thereby competitiveness. The effectiveness of this incentive should be monitored.
Lastly, policies to promote innovation collaboration aimed at augmenting the absorptive capacity of indigenous firms should include improving awareness of the range of existing supports to foster greater levels of industry-knowledge producer collaboration and providing simple short-term collaborative activity - such as updating ICT capacity - to smaller firms, and increasing the use of direct public support for business R&D such as grants, equity, loans and loan guarantees in order to promote greater investment in knowledge based capital.
Policies to enhance productivity across industries (diversification)
The cornerstone of Ireland’s successful economic growth has been to attract highly-productive multinational enterprises. Foreign-owned enterprises now represent 2 per cent of all enterprises, and they account for 63 per cent of gross value added and 22 per cent of all persons engaged in work. Although this is a common feature for most OECD countries, it is particularly intense for Ireland.
This growth model, however, is challenging the country’s competitive base as productivity gains and export growth are increasingly relying on a narrower base of industries (e.g. ICT and Pharma), companies (i.e. mostly
12 Complementarity (substitutability) occurs if investment in one type of asset increases (decreases) the marginal or
foreign-owned), products (i.e. highly specialised) and markets (e.g. UK), where Irish local firms play a secondary role.
Economic concentration is certainly leading to a high degree of specialisation of activities and dualisation of the Irish economy with some high-tech and self-contained industrial clusters in the pharmaceuticals, electronics and ICT sectors, which are well connected globally but poorly connected to local firms and the rest of industries in general (O’Leary 2015) 13. Therefore, broadening Ireland’s enterprise and export base is critical
to ensuring the Irish economy is resilient and adaptable to both large firm- and industry-specific shocks, particularly in view of the global tax and trade environment (i.e. Brexit). One way to achieve this would be through the strategic diversification of enterprises (both FDI-related and local) into nearby industries with high potential for export growth and expansion into more complex products (e.g. food processing, agriculture and medical devices sectors). Diversification of FDI sources outside the US, as well as regional diversification outside Dublin (albeit challenging), should continue to be a core part of IDA’s new strategy from 2019 onwards. The continued attraction of investment from the global frontier firms across new and existing sectors, activities and geographies, should also be prioritised as part of IDA’s new strategy. Further research is needed to identify and map high-productivity sectors (in both manufacturing and services) with the highest potential for growth and spillovers between foreign- and Irish-owned firms.
Conclusion
Top-line productivity data for Ireland may appear reassuring regarding the sustainability of Ireland’s high economic growth rate. This Statement has shown, however, that there is a significant asymmetric performance amongst firms. A small number of large firms deliver most of productivity performance while it is concerning that the majority of Irish firms - the type of firms which provide the majority of employment in the State - show declining productivity. This threatens their competitiveness and threatens jobs. It also means the large engine powered by a small number of the MNCs will have to do more of the work to sustain the economy in the future. Fixing this is not easy - the National Competitiveness Council’s view is that a major effort is required to help indigenous firms to invest in innovation, obtain the necessary management talent and in-company training and ultimately grow and diversify into new markets. In addition, continued investment in productivity enhancing infrastructure – hard and soft – should remain a key pillar of government policy to enhance overall economic competitiveness. Foreign direct investment will continue to play a key role in Ireland’s future. While we should not switch attention away from the attraction, support and development of multinational operations in Ireland, which are a critical pillar of the the Irish economy, the focus should be on the continued diversification of the FDI base of industries and, equally important, further embedding their activities in the rest of the Irish economy. This should be done through more MNC trade, labour mobility and innovation collaboration linkages with indigenous firms, thereby enhancing knowledge diffusion in the economy. Enhancing these spillovers will require policy support to help indigenous firms build up their absorptive capacity, to learn from, and catch up, with global frontier firms, as well as a strategic orientation towards emerging industries with a high potential for productivity growth to ensure an effective, broad and sustained impact on Ireland’s competitive economic base.
13O’ Cleary, N. (2015) “A tale of two clusters: the evolution of Ireland’s economic complexity since 1995”, Journal of the