ETS: Discriminative Edit Models for Paraphrase Scoring
Michael Heilman and Nitin Madnani
Educational Testing Service 660 Rosedale Road Princeton, NJ 08541, USA
{mheilman,nmadnani}@ets.org
Abstract
Many problems in natural language process-ing can be viewed as variations of the task of measuring the semantic textual similarity be-tween short texts. However, many systems that address these tasks focus on a single task and may or may not generalize well. In this work, we extend an existing machine transla-tion metric, TERp (Snover et al., 2009a), by adding support for more detailed feature types and by implementing a discriminative learning algorithm. These additions facilitate applica-tions of our system, called PERP, to similar-ity tasks other than machine translation eval-uation, such as paraphrase recognition. In the SemEval 2012 Semantic Textual Similar-ity task, PERP performed competitively, par-ticularly at the two surprise subtasks revealed shortly before the submission deadline.
1 Introduction
Techniques for measuring the similarity of two sen-tences have various potential applications: auto-mated short answer scoring (Nielsen et al., 2008; Leacock and Chodorow, 2003), question answering (Wang et al., 2007), machine translation evaluation (Przybocki et al., 2009; Snover et al., 2009a), etc.
An important aspect of this problem is that sim-ilarity is not binary. Sentences can be very seman-tically similar, such that they might be called para-phrases of each other. They might be completely different. Or, they might be somewhere in between. Indeed, it is arguable that all sentence pairs (except exact duplicates) lie somewhere on a continuum of
similarity. Therefore, it is desirable to develop meth-ods that model sentence pair similarity on a contin-uous, or at least ordinal, scale.
In this paper, we describe a system for measuring the semantic similarity of pairs of short texts. As a starting point, we use the Translation Error Rate Plus (Snover et al., 2009a), or TERp, system, which was specifically developed for machine translation eval-uation. TERp takes two sentences as input, finds a set of weighted edits that convert one into the other with low overall weight, and then produces a length-normalized score. TERp also has a greedy, heuris-tic learning algorithm for inducing weights from la-beled sentence pairs in order to increase correlations with human similarity scores.
Some features of the original TERp make adap-tation to other semantic similarity tasks difficult, in-cluding its largely one-to-one mapping of features to edits and its heuristic, greedy learning algorithm. For example, there is a single feature for lexical sub-stitution, even though it is clear that different types of substitutions have different effects on similarity (e.g., substituting “43.6” with “17” versus substitut-ing “a” for “an”). In addition, the heuristic learn-ing algorithm, which involves perturblearn-ing the weight vector by small amounts as in grid search, seems un-scalable to larger sets of overlapping features.
Therefore, here, we use TERp’s inference algo-rithms that find low cost edit sequences but use a dis-criminative learning algorithm based on the Percep-tron (Rosenblatt, 1958; Collins, 2002) to estimate edit cost parameters, along with an expanded fea-ture set for broader coverage of the phenomena that are relevant to sentence-to-sentence similarity. We
refer to this new approach as Paraphrase Edit Rate with the Perceptron (PERP).
In addition to describing PERP, we discuss how it was applied for the SemEval 2012 Semantic Textual Similarity (STS) task.
2 Problem Definition
In this work, our goal is to create a system that can take as input two sentences (or short texts)x1andx2
and produce as output a predictionyˆfor how simi-lar they are. Here, we use the 0 to 5 ordinal scale from the STS task, where increasing values indicate greater semantic similarity.
The STS task data includes five subtasks with text pairs from different sources: the Microsoft Research Paraphrase Corpus (Dolan et al., 2004) (MSRpar), The Microsoft Research Video corpus (Chen and Dolan, 2011) (MSRvid), statistical machine transla-tion output of parliament proceedings (Koehn, 2005) (SMT-eur). For each of these sources, approxi-mately 750 sentence pairsx1andx2and gold stan-dard similarity valuesywere provided for training and development.
In addition, there were two surprise data sources revealed shortly before the submission deadline: pairs of sentences from Ontonotes (Pradhan and Xue, 2009) and Wordnet (Fellbaum, 1998) (OnWN), and machine translations of sentences from news conversations (SMT-news). For all five sources, the held-out test set contained several hundred text pairs. See the task description (Agirre et al., 2012) for additional details.
3 TER, TERp, and PERP
In this section, we briefly describe the TER and TERp machine translation metrics, and how the PERP system extends them in order to better model semantic textual similarity.
TER (Snover et al., 2006) uses a greedy search al-gorithm to find a set of edits to convert one of the paired input sentences into the other. We can view this set of edits as an alignmentabetween the two input sentencesx1 andx2, and when two words in
x1andx2, respectively, are part of an edit operation,
we say that those words are aligned.1 Unlike
tradi-1For machine translation evaluation with TERp and PERP,
x1is a system’s hypothesis andx2is a reference translation. For
tional edit distance measures, TER allow for shifts— that is, edits that change the positions of words or phrases in the input sentencex1. Essentially, TER
searches among a set of possible shifts of the phrases inx1 to find a set of shifts that result in the least
cost alignment, using edits of other types, between x2and the shifted version ofx1. TER allows one to specify costs for different edit types, but it does not include a method for learning those costs from data. TERp (Snover et al., 2009b; Snover et al., 2009a) extends TER in two key ways. First, TERp in-cludes new types of edits, including edits for substi-tution of synonyms, word stems, and phrasal para-phrases extracted from a pivot-based paraphrase ta-ble (§3.1). Second, it includes a heuristic learning algorithm for inferring cost parameters from labeled data. TERp includes 8 types of edits: match (M), in-sertion (I), deletion (D), substitution (S), stemming (T), synonymy (Y), shift (Sh), and phrase substitu-tion (P). The edits are mutually exclusive, such that synonymy edits do not count as substitutions, for ex-ample. TERp has 11 total parameters, with a single parameter for each edit except for phrase substition, which has four.
PERP has a general framework similar to that of TERp. It extends TERp, however, by includ-ing additional edit parameters, and by usinclud-ing a dis-criminative learning algorithm (see§5) to learn pa-rameters rather than the heuristic technique used by TERp. Thus, PERP uses the same greedy algorithm as TERp for finding the optimal sets of edits given the cost parameters, but it allows the cost for an indi-vidual edit to depend on multiple, overlapping fea-tures of that edit. For example, costs for substitu-tion edits depend on whether the aligned words are pronouns, whether the aligned words represent num-bers, the lengths of the aligned words, etc. See§4 for the full list of features in PERP.
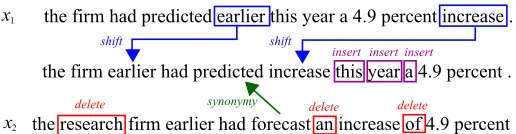
An alignment from the MSRpar portion of the STS training data is illustrated in Figure 1.
3.1 Phrasal Paraphrases
PERP uses probabilistic phrasal substitutions to align phrases in the hypothesis with phrases in the
the research firm earlier had forecast an increase of 4.9 percent . the firm earlier had predicted increase this year a 4.9 percent . the firm had predicted earlier this year a 4.9 percent increase .
synonymy
shift shift
insert
delete delete delete
insert insert
x1
[image:3.612.176.434.56.123.2]x2
Figure 1: An example of a PERP alignment for a sentence pair from the Microsoft Research Paraphrase Corpus. The search algorithm first performs shifts onx1and then performs other edits onx2. The zero cost edits that match individual words are not shown.
reference. It does so by looking up—in a pre-computed phrase table—paraphrases of phrases in the reference and using its associated edit cost as the cost of performing a match against the hypoth-esis. The paraphrase table used in PERP was iden-tical to the one used by Snover et al. (2009a). It was extracted using the pivot-based method as de-scribed by Bannard and Callison-Burch (2005) with several additional filtering mechanisms to increase the precision of the extracted pairs. The pivot-based method utilizes the inherent monolingual semantic knowledge from bilingual corpora: we first iden-tify phrasal correspondences between English and a given foreign languageF, then map from English to English by following translation units from English to the other language and back. For example, if the two English phrasese1 and e2 both correspond to the same foreign phrasef, then they may be consid-ered to be paraphrases of each other with the follow-ing probability:
p(e1|e2)≈p(e1|f)p(f|e2)
If there are several pivot phrases that link the two English phrases, then they are all used in computing the probability:
p(e1|e2)≈X
f0
p(e1|f0)p(f0|e2)
We used the same phrasal paraphrase database as in TERp (Snover et al., 2009a), which was extracted from an Arabic-English newswire bitext containing a million sentences. A few examples of the para-phrase pairs used in the MSRpar portion of the STS training data are shown below:
(commission→panel)
(the spying→espionage)
(suffered→underwent)
(room to→space for)
(per cent→percent)
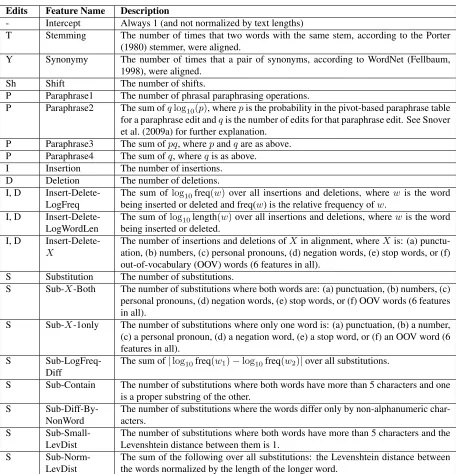
4 Features
As discussed in§3, PERP expands on TERp’s origi-nal features in order to better model semantic textual similarity.
PERP models a pair of sentences x1 and x2
us-ing a feature functionf(a) that extracts a vector of real-valued features from an alignment a between x1 and x2. This alignment is found with TERp’s inference algorithm and consists of a set of edits of various types along with information about the words on which those edits operate. For example, the alignment might contain an edit with the infor-mation, “The token ‘the’ inx1 was substituted for
the token ‘an’ inx2.” This edit would increment the
features inf(a)for the number of substitutions and the number of substitutions of stopwords, along with other relevant substitution features.
The set of features encoded inf(a)are described in Table 1.2 It includes general features that always fire for edits of a particular type (e.g., the “Substi-tution” feature) as well as specific features that fire only in specific situations (e.g., the “Sub-Pronoun-Both” edit, which fires only when one pronoun is substituted for another).
The function f(a) is normalized for sentence
2
Edits Feature Name Description
- Intercept Always 1 (and not normalized by text lengths)
T Stemming The number of times that two words with the same stem, according to the Porter (1980) stemmer, were aligned.
Y Synonymy The number of times that a pair of synonyms, according to WordNet (Fellbaum, 1998), were aligned.
Sh Shift The number of shifts.
P Paraphrase1 The number of phrasal paraphrasing operations.
P Paraphrase2 The sum ofqlog10(p), wherepis the probability in the pivot-based paraphrase table for a paraphrase edit andqis the number of edits for that paraphrase edit. See Snover et al. (2009a) for further explanation.
P Paraphrase3 The sum ofpq, wherepandqare as above. P Paraphrase4 The sum ofq, whereqis as above.
I Insertion The number of insertions. D Deletion The number of deletions. I, D
Insert-Delete-LogFreq
The sum oflog10freq(w)over all insertions and deletions, where wis the word being inserted or deleted and freq(w) is the relative frequency ofw.
I, D Insert-Delete-LogWordLen
The sum oflog10length(w)over all insertions and deletions, wherewis the word being inserted or deleted.
I, D
Insert-Delete-X
The number of insertions and deletions ofXin alignment, whereX is: (a) punctu-ation, (b) numbers, (c) personal pronouns, (d) negation words, (e) stop words, or (f) out-of-vocabulary (OOV) words (6 features in all).
S Substitution The number of substitutions.
S Sub-X-Both The number of substitutions where both words are: (a) punctuation, (b) numbers, (c) personal pronouns, (d) negation words, (e) stop words, or (f) OOV words (6 features in all).
S Sub-X-1only The number of substitutions where only one word is: (a) punctuation, (b) a number, (c) a personal pronoun, (d) a negation word, (e) a stop word, or (f) an OOV word (6 features in all).
S Sub-LogFreq-Diff
The sum of|log10freq(w1)−log10freq(w2)|over all substitutions.
S Sub-Contain The number of substitutions where both words have more than 5 characters and one is a proper substring of the other.
S Sub-Diff-By-NonWord
The number of substitutions where the words differ only by non-alphanumeric char-acters.
S Sub-Small-LevDist
The number of substitutions where both words have more than 5 characters and the Levenshtein distance between them is 1.
S
Sub-Norm-LevDist
[image:4.612.78.534.53.527.2]The sum of the following over all substitutions: the Levenshtein distance between the words normalized by the length of the longer word.
Table 1: The set of features in PERP. The first column lists which edits for which each feature is relevant.
lengths by dividing all the values in Table 1 by the sum of the number of words inx1andx2, except for
the intercept feature that models the base similarity value in the training data and always has value 1.
There are 36 features and corresponding parame-ters in all, compared to 11 for TERp.
It is worth pointing out that while the mutual ex-clusivity between most of the original TERp edits is preserved, PERP does have shared features be-tween insert and delete edits (e.g.,
“Insert-Delete-Number”), and could in principle share features be-tween substitution, stemming, and synonymy edits.
5 Learning
Given a training set consisting of paired sentences
Algorithm 1learn(w,T,α,x1,x2,y):
An Averaged Perceptron algorithm for learning edit cost parameters. T is the number of iterations through the dataset. α is a learning rate. x1 and
x2 are paired lists of sentences, and y is a list of similarities that correspond to those sentence pairs.
wsum =0
fort= 1,2, . . . , T do
x1,x2,y= shuffle(x1,x2,y)
fori= 1,2, . . . ,|y|do
a= TERpAlign(w, x1i, x2i) ˆ
y=w·f(a)
w=w+α(yi−yˆ)f(a)
w= applyShiftConstraint(w)
wsum=wsum+w
end for end for
return wsum
T|y|
of cost parameters for its various features.3 The al-gorithm is a fairly straightforward application of the Perceptron algorithm described by Collins (2002).4 The only notable difference is that the algorithm constrains PERP’s shift parameter to be at least 0.01 in the step labeled “applyShiftConstraint.” We found that TERp’s inference algorithm would fail if the shift cost reached zero.5 In our experiments, we ini-tialized all weights to 0, except for the following: the “Substitution,” “Insertion,” and “Deletion” weights were initialized to1.0, and the “Shift” weight was initialized to0.1. Following Collins (2002), the al-gorithm returns an averaged version of the weights, though this did not appear to substantially impact performance.
3
The “shuffle” step shuffles the lists of sentence pairs and scores together such that their orderings are randomized but that they stay aligned with each other.
4
There are a few hyperparameters in the learning algorithms. For our experiments, we set the number of iterations through the training dataTto 200. We set the learning rateαto 0.01 to avoid large oscillations in the parameters. We did not system-atically tune the hyperparameters. Other values might lead to better performance.
5
With zero cost shifts, TERp would enter a loop and even-tually exceed the amount of available memory. We also set the same minimum cost of 0.01 for shifts in our experiments with the original TERp.
6 Experiments
In this section, we report results for the STS shared task. For a full description of the task, see Agirre et al. (2012).
The task consisted of three known subtasks (MSRpar, MSRvid, and SMT-eur) and two surprise subtasks (On-WN, SMT-news). For the known sub-tasks, we trained models with task-specific data only. For the On-WN subtask, we used the model trained for MSRpar. For SMT-news, we used the model trained for SMT-eur.
Our submissions to the task included results from two variations, one using the full system (PERP-phrases) and one with the paraphrase substitution edits disabled (PERP), in order to isolate the effect of including phrasal paraphrases. In our original submission, the PERPphrases system included a mi-nor bug that affected the calculation of the phrasal paraphrasing features. Here, we report both the orig-inal results and a corrected version (“PERPphrases (fix)”), though the correction only minimally af-fected performance. We also tested two variations of the original TERp system: one with the weights set as reported by Snover et al. (2009a) (“TERp (default)”), and one tuned in the same task-specific manner as PERP (“TERp (tuned)”). We multiplied TERp’s predictions by −1 since it produces costs rather than similarities.
The results, in terms of Pearson correlations with test set gold standard scores, are shown in Table 2. In addition to correlations for each subtask, we in-clude the three aggregated measures used for the task. The “ALL” measure is the Pearson correlations on the concatenation of all the data for all five sub-tasks. It was the original measured used to aggregate the results for the different subtasks. The second ag-gregated measure is the “Allnrm” measure, which we view as an oracle because it uses the gold stan-dard similarity values from the test set to adjust sys-tem predictions. The final aggregate measure is the mean of the correlations for the subtasks, weighted by the number of examples in each subtask’s test set (“Mean”). See Agirre et al. (2012) for a full descrip-tion of the metrics.
Aggregated Measures Subtask Measures
ALL ALLnrm Mean MSRpar MSRvid SMT-eur On-WN SMT-news
UKP (top-ranked) .8239 .8579 .6773 .6830 .8739 .5280 .6641 .4937 PERPphrases (fix)† .7837 — .6405 .6410 .7209 .4852 .7127 .5312
PERPphrases .7834 .8089 .6399 .6397 .7200 .4850 .7124 .5312
PERP .7808 .8064 .6305 .6211 .7210 .4722 .7080 .5149
TERp (tuned)† .5558 — .5582 .5400 .6099 .4967 .5862 .5135
TERp (default) .4477 .7291 .5253 .5049 .5217 .4748 .6169 .4566
baseline .3110 .6732 .4356 .4334 .2996 .4542 .5864 .3908
[image:6.612.76.538.58.184.2]mean of submissions .5864 .7773 .5286 .4894 .7049 .3958 .5557 .3731
Table 2: Pearson correlations between predictions about the test data and gold standard scores. “†” marks experiments that were not parts of the official SemEval task 6 evaluation. The highest correlation in each column is given in bold. ALLnrm results are not included for all runs because we did not have an implementation of that measure.
[image:6.612.85.290.355.481.2]baseline from the organizers (Agirre et al., 2012), and the means across all 88 submissions (not includ-ing the baseline).
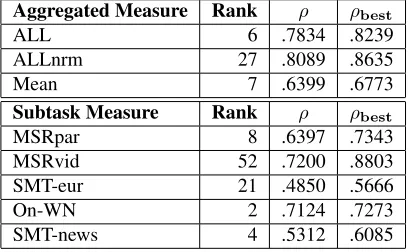
Table 3 shows the rankings in the official results of the PERPphrases submission, for each subtask and overall, along with Pearson correlations from PERP and the best submission for each subtask.
Aggregated Measure Rank ρ ρbest
ALL 6 .7834 .8239
ALLnrm 27 .8089 .8635
Mean 7 .6399 .6773
Subtask Measure Rank ρ ρbest
MSRpar 8 .6397 .7343
MSRvid 52 .7200 .8803
SMT-eur 21 .4850 .5666
On-WN 2 .7124 .7273
SMT-news 4 .5312 .6085
Table 3: The ranking and correlation (ρ) obtained by PERPphrases for each of the five datasets as well for all datasets combined. The STS task had a total of 88 sub-missions.ρbestshows the correlation for the best
submis-sion, across all submissions, for each dataset.
7 Conclusion
From the results in §6, PERP appears to be com-petitive at measuring semantic textual similarity. It performed particularly well on the surprise subtasks, indicating that it generalizes well to new data. Fi-nally, with the exception of the SMT-eur machine translation evaluation subtask, PERP outperformed the TERp system for all of the STS subtasks.
Acknowledgments
We would like to thank the organizers of SemEval and the Semantic Textual Similarity task. We would also like to thank Matt Snover for making the origi-nal TERp code available.
References
E. Agirre, D. Cer, M. Diab, and A. Gonzalez-Agirre. 2012. SemEval-2012 task 6: A pilot on semantic tex-tual similarity. InProc. of the 6th International Work-shop on Semantic Evaluation (SemEval 2012), in con-junction with the First Joint Conference on Lexical and
Computational Semantics (*SEM 2012).
C. Bannard and C. Callison-Burch. 2005. Paraphrasing with bilingual parallel corpora. InProc. of ACL, pages 597–604.
D. Chen and W. B. Dolan. 2011. Collecting highly par-allel data for paraphrase evaluation. InProc. of ACL, pages 190–200.
M. Collins. 2002. Discriminative training methods for hidden Markov models: Theory and experiments with the perceptron algorithm. InProc. of EMNLP.
W. Dolan, C. Quirk, and C. Brockett. 2004. Unsuper-vised construction of large paraphrase corpora: Ex-ploiting massively parallel news sources. InProc. of
COLING, pages 350–356, Geneva, Switzerland.
C. Fellbaum. 1998. WordNet: An Electronic Lexical
Database. Bradford Books.
P. Koehn. 2005. Europarl: A parallel corpus for statisti-cal machine translation. InProc. of Machine
Transla-tion Summit.
R. D. Nielsen, W. Ward, and J. H. Martin. 2008. Clas-sification errors in a domain-independent assessment system. In Proc. of the Third Workshop on Innova-tive Use of Natural Language Processing for Building
Educational Applications.
M. F. Porter. 1980. An algorithm for suffix stripping.
Program, 3(14):130–137.
S. S. Pradhan and N. Xue. 2009. OntoNotes: The 90% solution. InProc. of Human Language Technologies: The 2009 Annual Conference of the North American Chapter of the Association for Computational
Linguis-tics, Companion Volume: Tutorial Abstracts, pages
11–12.
M. A. Przybocki, K. Peterson, S. Bronsart, and G. A. Sanders. 2009. The NIST 2008 metrics for machine translation challenge - overview, methodology, met-rics, and results. Machine Translation, 23(2-3):71– 103.
F. Rosenblatt. 1958. The perceptron: A probabilistic model for information storage and organization in the brain.Psychological Review, 65.
M. Snover, B. Dorr, R. Schwartz, L. Micciulla, and J. Makhoul. 2006. A study of Translation Edit Rate with targeted human annotation. InProc. of the Con-ference of the Association for Machine Translation in
the Americas (AMTA).
M. Snover, N. Madnani, B. Dorr, and R. Schwartz. 2009a. Fluency, adequacy, or HTER? Exploring dif-ferent human judgments with a tunable MT metric. In
Proc. of the Fourth Workshop on Statistical Machine Translation at the 12th Meeting of the European Chap-ter of the Association for Computational Linguistics
(EACL-2009), March.
M. Snover, N. Madnani, B. Dorr, and R. Schwartz. 2009b. TER-Plus: Paraphrase, semantic, and align-ment enhancealign-ments to Translation Edit Rate.Machine
Translation, 23(2–3):117–127.