THRESHOLD LEARNING FROM SAMPLES DRAWN FROM THE NULL HYPOTHESIS
FOR THE GENERALIZED LIKELIHOOD RATIO CUSUM TEST
C. Hory, A. Kokaram
∗University of Dublin, Trinity College
EEE Department
College Green, Dublin 2 Ireland
W. J. Christmas
University of Surrey
Centre for Vision Speech and Signal Processing
Guilford GU2 7XH, UK
ABSTRACT
Although optimality of sequential tests for the detection of a change in the parameter of a model has been widely dis-cussed, the test parameter tuning is still an issue. In this communication, we propose a learning strategy to set the threshold of the GLR CUSUM statistics to take a decision with a desired false alarm probability. Only data before the change point are required to perform the learning process. Extensive simulations are performed to assess the validity of the proposed method. The paper is concluded by open-ing the path to a new approach to multi-modal feature based event detection for video parsing.
1. INTRODUCTION
Change detection in the temporal evolution of a signal is of key importance in a wide range of applications from system failures control and diagnosis to event detection in video streams. Event detection in video streams is important for parsing the media to create keyframes, or edit points or sum-maries [1]. The essential idea is that changes in the nature of measured features reflect a change in the semantics of the video event. For instance, in sports like snooker and tennis, a change in geometry of the scene generally reflects a change in camera view, which itself is an indicator for fur-ther analysis [2].
Obviously, using both audio and video features, would yield much better performance in video parsing and recently sev-eral efforts have been made to exploit that power [3]. The Hidden Markov Model has been the principal framework for inference with temporally varying multimodal data thus far. Mainly offline algorithms exploiting the HMM are consid-ered for video parsing with mixed audio and visual features. Gish [4] proposed a distance measure for speech detection which can be linked to the offline approach described in [5] of the CUSUM (for CUmulative SUM) algorithm. Here again, Boreczky and Wilcox proposed to use this distance
∗This work was partly supported by ERCIM within the MUSCLE
Eu-ropean Network of Excellence.
in a HMM framework for video parsing.
However, the HMM treats audio and visual features as com-ponents of the state vector with no discrimination regarding the nature of the data. In this paper, the parsing problem is decomposed into two parts: i) citing thatsomeevent has occurred by detecting a change in the statistical model of the audio data and then ii) identifying that event by process-ing ofsomerelevant visual features. In so doing it is more easy to attribute varying weights to the power of inference for each feature. It transpires that for sport, quite often the audio stream is more beneficially used in this manner than as a component of an HMM state space. A good example is tennis, in which the sound of a ball hitting the racket is an essential feature of the game.
pa-rameter space. Some reinforcement is then to be provided to perform the isolation task.
Solutions to the simple and multiple hypothesis testing prob-lems exist which are shown to be optimal with respect to certain criterion [5, 9]. For the composite hypothesis test-ing, a sequential optimal equivalent to the Generalized Like-lihood Ratio test has not been found so far. However, some algorithms are commonly accepted as almost optimal. One can cite for example the Generalized Likelihood Ratio (GLR) CUSUM test proposed by Lorden [10]. Another drawback of the current state-of-the-art in change detection is the test parameter tuning issue. A sequential learning scheme has been proposed by Bershad and Sklansky where the thresh-old was considered as solution of a diffusion equation con-troled by positive and negative reinforcement [11]. Besides the need for a training sample drawn from both hypotheses, this approach provides analytic solutions in only few sim-ple cases. Usually, thresholds are manually set, assuming a priori knowledge on the analysed data [5].
In this communication we propose an approach to auto-matically set the threshold to apply to the GLR CUSUM statistics. Optimality criteria of sequential tests such as the CUSUM test are defined as a lower bound on a detection performance index for a given false alarm index. Thus, it is possible to tune the threshold in order to perform a test with upper-bounded false alarm by using a training sample only drawn from the PDF under null hypothesis (i.e. PDF before the change point). We make use of the formulation of the CUSUM test as a set of parallel open-ended SPRT [10] to perform a jackknife-like estimation of the threshold.
After reviewing necessary results on sequential analysis in section 2, we propose three criteria for the tuning of the threshold in section 3. In section 4 we perform Monte-Carlo simulations for comparing and validating the efficiency of the proposed criteria. We conclude in section 5 by propos-ing a potential application of the presented results to event detection in tennis broadcasting.
2. BACKGROUND ON SEQUENTIAL ANALYSIS
In this section, we recall the results of theory of change de-tection that are used to derive the threshold criteria proposed in this paper.
2.1. Sequential Probability Ratio Test
Suppose a set of independent and identically distributed ran-dom variablesx1, x2, ...are sequentially sampled from the
parent random variableXhaving PDFfθ(x)parameterized
by the scalarθ. the problem is to decide as soon as possible between the two hypotheses:
½
H0: xi ∼fθ0(x), ∀i H1: xi ∼fθ1(x), ∀i
(1)
Let
Sn
1(θ0, θ1) =
n X
i=1
ln
½
fθ1(xi) fθ0(xi)
¾
, (2)
be the log-likelihood ratio of thenfirst sampled data. The dependence of the test statistic on the parameters of the problemθ0 andθ1 is omitted when no confusion is
possi-ble. Set two constantsAandBand the sequence of instants
T1, T2, ...such thatS1Tk ≥AorS1Tk ≤B. Then the
stop-ping time T of the SPRT is defined as T = mink{Tk}.
HypothesisH0is accepted ifS1T ≤ Band hypothesisH1
is accepted if ST
1 ≥ A. Wald has shown that the false
alarm probability α and miss detection probability β and the boundAandBsatisfy the following inequalities [6]:
A≤ln
n
1−β α
o
,
B≥ln
n β
1−α o
, (3)
Under specific conditions widely accepted in practice, in-equalities (3) can be replaced by approximations and are called the Wald’s approximations. A special case of SPRT is the open-ended test for which the test statistic presents no lower boundB. In other words, the stopping time of an open-ended test depends only on the upper thresholdAof the log likelihood ratio statistic.
The SPRT is said to be optimal in the sense that for given error probabilities, it provides a minimum Average Sample NumberEθ1{T}.
2.2. CUSUM test
Suppose now that we are to decide whether a change in the distribution of the sampled data has occurred at instantt0.
The null and alternative hypotheses are now:
H0: xi∼fθ0(x), ∀i H1: xi∼fθ0(x), i < t0,
xi∼fθ1(x), i≥t0,
(4)
The statisticScnof the CUSUM test is built from the partial log-likelihood ratio Sln = Sn1 −S1l−1 of the first ndata sampled:
Sn
c = max1≤l≤n{Sln}. (5)
Given thresholdA, the stopping timeT is defined byT =
min{Tk, k = 1,2...}where theTk are such thatSTck ≥A
[5].
optimality of the CUSUM test under a minimax type of cri-terion.
Consider now that there is less a priori information on
θ1. More specifically, parameterθafter the change point is
only known to belong to a domainΘ1such thatθ0 ∈/ Θ1.
The problem is to decide as fast as possible between the two hypotheses:
H0: xi ∼fθ0(x), ∀i H1: xi ∼fθ0(x), i < t0,
xi ∼fθ1∈Θi(x), i≥t0,
(6)
The GLR CUSUM test resolves this problem by applying a thresholdAto the test statistics
Sng = max1≤l≤n{θ∈maxΘ
1
{Snl(θ, θ0)}}. (7)
The CUSUM test is a special case of the GLR CUSUM test in the case whereΘ1reduces to the singleton{θ1}.
3. THRESHOLD LEARNING IN PRESENCE OF SAMPLE DRAWN FROM THE NULL HYPOTHESIS
Suppose independent identically distributed random vari-ablesx1, x2, ...are sequentially sampled from a PDFfθ(x)
of the exponential family with varying but unknownθ. Sup-pose also it is known that for theN first samplesθ = θ0.
Some unknown changes inθoccur at unknown instantsti>
N,i= 0,1, . . .The problem is to detect each change of pa-rameterθ.
A CUSUM-like algorithm is obviously the best solution to this problem since each decision has to be taken as soon as possible, i.e. before a new change occurs. Moreover, the parameter after the change point can take any value so we have to apply a GLR CUSUM test whereΘ1⊂IR\θ0.
Since no information is available concerning domainΘ1, it
is impossible to assess a threshold valueAto the test which will satisfy a desired mean time delay to take a decision for a given rate of false alarm. We propose to use the N first samples drawn from the known PDFfθ0(x)to set a
thresh-old that ensures at most a required false alarm probability.
3.1. Principle of the learning procedure
The Kulback-Leibler (KL) informationI(θ0, θ1)shared by
two PDF’sfθ0(x)andfθ1(x)is defined by:
I(θ0, θ1) =E1
½
ln
½
fθ1(x) fθ0(x)
¾¾
(8)
The KL information is the mean increment of the likelihood ratio statistic under hypothesis for data drawn fromfθ1(x).
It can be seen as a degree of detectability between hypothe-ses H0 : θ = θ0 andH1 : θ = θ1 [5]. Whenθ0 = θ1,
the Kulback-Leibler information is null; performing a test of detection is actually meaningless in such a case.
It is easy to see that up to instantN, the GLR CUSUM ping rule defined previously is equal to the extended stop-ping time ofN parallel open-ended SPRT triggered at in-stantsk= 1,2, ...N[10]. When performing a GLR CUSUM test as a set of parallel open-ended tests,N(N−1)/2 statis-tics are computed. So, considering the GLR CUSUM test as a set of open-ended tests allows straightforwardly to place ourselves in a jackknife [12] approach: we consider that the statistics and the maximum likelihood estimates ofθ1under
null hypothesis are samples of the corresponding random variables. We propose to tune the GLR CUSUM parame-ters by evaluating a minimum degree of detectability using the jackknife approach.
3.2. Threshold selection criteria
Consider that the parameter after the change point is known to belong to domainΘ1and define:
θm=argmin
θ∈Θ1
{I(θ0, θ)}, (9)
i.e. the minimum measure of detectability of the change. There exists the following relation between false alarm prob-abilityαof the open-ended SPRT and thresholdA[5]:
A= ln
−3 ln{α}
h
1 + 1
I(θ0,θm)
i2
α
. (10)
However, as no information is available about the parameter after the change point,θmis unknown in our problem. So,
during the learning session, we propose to look forθmsuch
thatI(θ0, θm)is a measure of affordable detectability.
Denoteθˆn
l = argmaxθ∈Θ1{S
n
l(θ0, θ)}, the maximum
likelihood estimator ofθcomputed from samples between instantlandn. We propose three criteria for evaluatingθm:
• first criterion:mean parameter criterion.
Parameterθmin (9) is the mean of theN(N −1)/2
estimatesθˆn
l required to compute the test statistics:
θm1 =
2 N(N−1)
X
l,n
ˆ
θln. (11)
• second criterion:mean information criterion. Parameterθmin (9) is the mean of the KL
informa-tion betweenfθ0(x)andfθ(x)for eachθ= ˆθ
n l:
I(θ0, θ2m) =
2 N(N−1)
X
l,n
• third criterion:bound criterion.
For an open ended test with threshold A, and PDF of the exponential family, it can be shown using the Wald’s approximation that forN = A
I(θ0,θm)the false
alarm probability of an open ended test can be ap-proximated by:
Pθ0(T ≤N)≈Nexp{−A}. (13)
So we choose theθmwhich minimizes the difference
between the left and right hand sides of approxima-tion (13):
θ3
m = argminˆ θn
l
{Nexp{−N I(θ0,θˆnl)}
−card{S
n
g ≥nI(θ0,θˆn)}
N }, (14)
whereθˆn = n1Pnl=1θˆnl. The choice of the second term in the right-hand side of (14) to estimate the probability of false alarm is motivated by considering
Sn
g as the test statistic of a reverse-time sequential test
performed up to timen.
4. EXPERIMENTAL VALIDATION
An experiment has been conducted to compare the learning capability of the method when applied with the three pro-posed criteria. We focussed on Gaussian data of constant mean presenting a change in the variance. As discussed in section 5, this model is relevant for event detection from the audio recording of a video clip.
6000trials with data sets consisting of800samples hav-ing a Gaussian distribution with zero-mean have been per-formed. For each trial, change in the varianceσ2of the dis-tributions occurred at instantt0 = 301. Before the change
[image:4.612.331.538.106.608.2]pointσ2 = σ02 = 1. The6000valuesσ21 of the variance after the change point were drawn from a uniform distribu-tionU([1,15]). During the experiment, a change was con-sidered as not being detected if no decision was taken after 500 samples. So, the experiment is performed as a trun-cated sequential test. It is most likely that both false alarm probability and detection probability should be higher if the stopping time could tend to infinity. However, in this case, the false alarm probability would increase less than the de-tection probability [13].
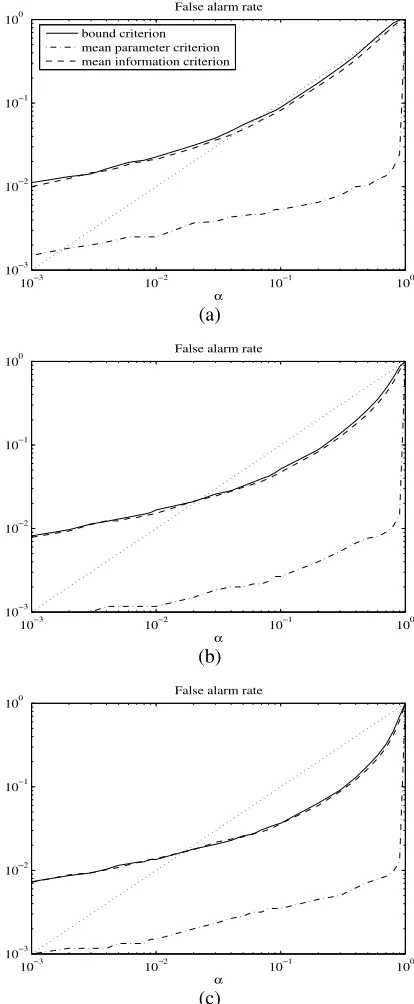
Fig. 1 shows the rate of false alarm computed from the
6000GLR CUSUM tests performed versus the probability of false alarmα of the open-ended tests. Three different length N = 100,200,300 points of the learning set have been tested. The three criteria presented in the previous section are considered. The thresholdAcomputed with the
mean parameter criteria offers the smaller rate of false alarm while the threshold Abound criterion provides the higher rate of false alarm.
10−3 10−2 10−1 100
10−3 10−2 10−1 100
False alarm rate
α
bound criterion mean parameter criterion mean information criterion
(a)
10−3 10−2 10−1 100
10−3 10−2 10−1 100
False alarm rate
α
(b)
10−3 10−2 10−1 100
10−3 10−2 10−1 100
False alarm rate
α
(c)
Fig. 1. False alarm probability of the GLR CUSUM test with respect to the false alarm probability αof the corre-sponding open-ended tests. The data set is of800samples. The learning length is N = 100 samples (a), N = 200
However, for bound criterion and mean information crite-rion the probability of false alarm is closed toα. For small
αthe probability of false alarm get higher thanα. We are not able to provide a definite explanation for such a behav-ior event though we suspect that the small number of trials performed (6000) can be considered as partly responsible.
To apply the bound criterion or the mean information criterion provides a probability of false alarm which is closed toα. However, it seems that when the learning lengthN in-creases, the difference betweenαand the actual probability of false alarm increases too. The mean parameter criterion provides a much smaller probability of false alarm. Further-more, to apply the mean parameter ensures a loose upper bound to the actual probability of false alarm. This is to the expense of the probability of detection which in turn, is smaller. Indeed, on Fig. 2 is presented the detection rate for
250 trials performed from Gaussian data with a parameter after the change pointσ2
1 = 1.5. The probability of
detec-tion of the GLR CUSUM performed using the mean param-eter criterion is smaller than when applying any of the two other criteria.
10−4 10−3 10−2 10−1 100
10−0.4 10−0.3 10−0.2 10−0.1
Detection rate
α
bound criterion mean parameter criterion mean information criterion
Fig. 2. Detection rate of the GLR CUSUM test versus the false alarm probabilityαof the corresponding open-ended tests.250experiments have been run withσ2
0= 1andσ12=
1.5.
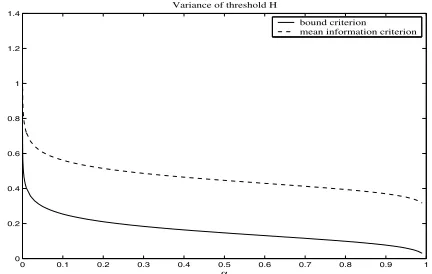
On Fig. 3 is plotted the variance of thresholdA com-puted using the bound criterion and the mean information. It appears that when applying the bound criterion, the vari-ance of A is smaller than when applying the mean infor-mation criterion. That makes the bound criterion a more reliable criterion.
5. DISCUSSION ON APPLICATION TO VIDEO PARSING
We have proposed a scheme for automatically tuning the threshold of a GLR CUSUM test to meet a desired
proba-0 0.1 0.2 0.3 0.4 0.5 0.6 0.7 0.8 0.9 1 0
0.2 0.4 0.6 0.8 1 1.2 1.4
Variance of threshold H
α
bound criterion mean information criterion
Fig. 3. Variance of the thresholds evaluated using the bound criterion and the mean information criterion. The learning length isN = 200samples.
bility of false alarm. It is only required that the learning set is drawn from the distribution before change. Three criteria have been proposed to evaluate the threshold, namely, the bound criterion, the mean parameter criterion and the mean information criterion. These criteria evaluate a minimum degree of detectability of a change in the parameter of inter-est from the learning set.
Experimental comparison of the three criteria has been con-ducted on simulated data. It turns out that the mean param-eter criterion provides a probability of false alarm which is much smaller than the desired probability of false alarm. Since this implies a lowest probability of detection, we con-clude that this criterion is not relevant. The two other crite-ria perform similarly in terms of probability of false alarm. However the bound criterion provides a smaller variance of the derived threshold than the mean information criterion. That makes this criterion eligible as the standard criterion.
Racket hit detection in tennis broadcast.We present now a methodology for video parsing which involves a sequen-tial detection of event using the tuned GLR CUSUM. We consider the problem of detecting racket hits in a tennis rally from the sequential analysis of the audio recording. A racket hit is characterized by a very impulsive waveform with high energy. Thus we aim at detecting a change in the variance of the data when a racket hit occurs.
Fig.4 presents a typical audio recording of a rally. Five racket hits are to be detected. Moreover, one of the player shouted before the third racket hit. Before processing, data were subsampled so that independency could be assumed. In order to take account of echoes due to the acoustical char-acteristics of the tennis court, we assumed the durationt1of
a racket hit wast1 = 450ms. The GLR CUSUM test was
performed recursively as follows: denoteTk the instant of
[image:5.612.326.542.49.186.2] [image:5.612.70.282.323.471.2]us-0 1 2 3 4 5 6 7 8 −1
−0.8 −0.6 −0.4 −0.2 0 0.2 0.4 0.6 0.8 1
Tennis rally
Time (sec.) Racket hit
Shout
Fig. 4. Parsing of the audio recording of a tennis rally.
ing the maximum likelihood estimator:
ˆ
t[0k]=argmax
l {S Tk
l }. (15)
A new test is performed from starting pointtin= ˆt[0k]+t1.
ThresholdHwas tuned so that the probability of false alarm
α= 10−3is met. The threshold was trained from the200
first samples. This corresponds to a learning time of 453 ms.
The algorithm has detected7change pointsˆt[0k]in the vari-ance of the data. On Fig.4, the7segments[ˆt[0k],ˆt[0k]+t1]are
plotted in grey color. The five racket hits were successfully detected. The shout was also detected as well as a small variation in the variance of the noise, due to a variation in the recording system tuning. The times of occurrence of the first, second and fifth racket hits were accurately estimated. The two errors are due to the detection of a slight variation of the magnitude of the signal. The first error is due to the detected shout around instantt= 4seconds. The other er-ror is due to an unidentified event happening at instant5.5
ms.
In spite of the diversity in the magnitude of the wave-form characterizing the detected events, the threshold was correctly tuned for insuring a good rate of detection. How-ever, additional information is required to isolate the differ-ent evdiffer-ents in the sense defined by Nikiforov [8]. For exam-ple, specific to a tennis game, an a priori probability for a shout to happen right before a racket hit can allow to dis-criminate the voice shout happening at instant4ms and the subsequent racket hit. In a multi-modal cooperation frame-work [14], we are currently investigating reinforcement pro-vided by visual features such as player or ball tracking or motion field estimate to isolate the detected events.
6. REFERENCES
[1] C. Colombo, A. Del Bimbo, and P. Pala, “Semantics in Visual Information Retrieval,” IEEE Multimedia, vol. 3, no. 6, pp. 38–53, 1999.
[2] R. Dahyot, N. Rea, and A. C. Kokaram, “Sport Video Shot Segmentation and Classification,” in Proceed-ings of Visual Communications and Images Process-ing, Lugano, Ch., July 2003.
[3] Yao Wang, Zhu Liu, and Jin-Cheng Huang;, “Multi-media Content Analysis Using Both Audio and Visual Clues,” IEEE Signal Processing Magazine, vol. 17, no. 6, pp. 12 – 36, November 2000.
[4] H. Gish, M. Siu, and R. Rohlicek, “Segregation of Speakers for Speech Recognition and Speaker Identifi-cation,” inProceedings of IEEE ICASSP’91, Toronto, Ca., April 1991, vol. 2, pp. 873–876.
[5] M. Basseville and I. Nikiforov, Detection of abrupt changes. Theory and applications, Information and system sciences series. Englewood Cliffs, NJ: Prentice Hall, 1993.
[6] A. Wald, Sequential Analysis, Wiley and Sons, New-York, 1947.
[7] E. S. Page, “Continuous Inspection Schemes,” Biometrika, vol. 41, no. 1/2, pp. 100–115, June 1954.
[8] I. V. Nikiforov, “A Generalized Change Detection Problem,” IEEE Trans. on Info. Theory, vol. 41, no. 1, pp. 171–187, 1995.
[9] T. L. Lai, “Sequential analysis: some classical prob-lems and new challenges,” Statistica Sinica, vol. 11, pp. 303–408, 2001.
[10] G. Lorden, “Procedures for Reacting to a Change in Distribution,” Ann. Math. Stat., vol. 42, pp. 1897– 1908, December 1971.
[11] N. J. Bershad and J. Sklansky, “Threshold Learning and Brownian Motion,” IEEE Trans. on Information Theory, vol. 17, no. 3, pp. 350–352, May 1971.
[12] B. Efron and R. Tibshirani, An Introduction to Boot-strap, Chapman & Hall, New York, 1993.
[13] D. Siegmund, Sequential Analysis, Springer-Verlag, 1985.
[image:6.612.70.285.50.190.2]