Exploring Optimal Voting in Native Language Identification
Cyril Goutte
Multilingual Text Processing National Research Council Canada 1200 Montr´eal Rd, Ottawa, ON, Canada
Serge L´eger
Human Computer Interaction National Research Council Canada 100 Aboiteaux, Moncton, NB, Canada
Abstract
We describe the submissions entered by the National Research Council Canada in the Native Language Identification Shared Task 2017. We mainly explored the use of voting, and various ways to optimize the choice and number of voting systems. We also explored the use of features that rely on no linguistic preprocessing. Long ngrams of characters obtained from raw text turned out to yield the best perfor-mance on all textual input (written es-says and speech transcripts). Voting en-sembles turned out to produce small per-formance gains, with little difference be-tween the various optimization strategies we tried. Our top systems achieved ac-curacies of87%on theESSAYtrack,84% on theSPEECHtrack, and close to92%by combining essays, speech and i-vectors in theFUSIONtrack.
1 Introduction
This paper describes the system entered by the National Research Council Canada in the Native Language Identification (NLI) Shared Task 2017 (Malmasi et al.,2017).
The task of Native Language Identification con-sists of predicting the native (L1) language of a foreign speaker, from textual and speech clues in a second (L2) language. Applications of this task are mostly in language learning and foren-sic/security, see (Malmasi,2016, Section 1.1) for a good overview. This is an interesting exam-ple of a task that is difficult to perform for hu-mans, especially when the number of target na-tive languages is large. In fact, in a comparison between automated and human evaluation, Mal-masi et al.(2015) could only use 5 L1 languages,
whereas the automated classifier covered 11 lan-guages. They also found that, even in these lim-ited settings, humans generally under-performed the automated systems.
An international evaluation in 2013 (Tetreault et al.,2013) showed that statistical methods could reach a high level of performance on this task (close to 84% accuracy) using a mixture of sur-face form features, linguistic features, and model combination. Ensemble methods, in particular, have proved crucial to reach top performance on this task and other related document categoriza-tion tasks like the discriminacategoriza-tion of language vari-ants (Goutte et al., 2014). Recent work has con-firmed this; we refer the reader to Malmasi and Dras (2017) for an overview and evaluation of many combination approaches.
Our best attempts at the NLI-2013 evaluation used model combination by voting, a simple strat-egy in which each base model contributes a vote towards a category, and final prediction goes to the category with the most votes. In this evalu-ation, we therefore explore this strategy further, looking into important aspects of the process: se-lecting the models to add to the combination, as well as their number. An attractive perk of the voting/combination approach is that it provides a natural way to handle multimodal data such as the text and speech data available in the evaluation. One can train models using either modality, and combine their predictions using voting. This is known as thelate fusion approach. By contrast, theearly fusionapproach combines different sets of features and trains a single model on those. We test and compare a simple early fusion model in theFUSIONtrack below.
Our second investigation is on the feature side. In particular, we investigate the use of long char-acter ngram, without any other linguistic process-ing. Previous work reached state-of-the-art
mance on the 2013 NLI Shared Task using string kernels (Ionescu et al., 2016), considering sub-sequences of 5 to 9 characters. On the task of discriminating similar languages (Goutte et al., 2016), long character ngrams also reach top per-formance (Goutte and L´eger, 2016) using subse-quences of 5 and 6 characters. We looked in more detail into how useful this type of feature could be in the context of NLI. This contrasts with many systems used in the 2013 evaluation, includ-ing ours, which used a combination of lexical and syntactic features, including short character and word ngrams, part-of-speech and syntactic depen-dencies. We test character ngrams up to 6grams, extracted from raw text without any linguistic pre-processing (no tokenization or casing normaliza-tion).
In the following section, we quickly review the data and introduce the approaches we tested for the NLI Shared Task 2017. Section3presents our results, both during development and evaluated on the final test data.
2 Data and Methods 2.1 Data
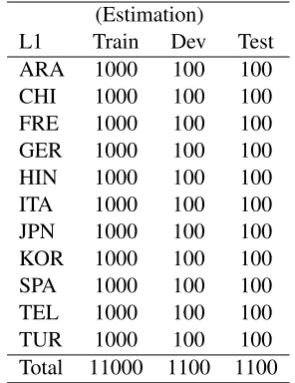
The NLI-2017 collection covers 11 native lan-guages: Arabic, Chinese, French German, Hindi, Italian, Japanese, Korean, Spanish, Telugu and Turkish, stratified across categories (Table1). It was obtained from a standardized assessment of English proficiency for academic purposes. Each document contains three parts:
1. The text of an essay written in English by a native L1 speaker, in response to a prompt;
2. The orthographic transcript of a 45-second English spoken reply given by the native L1 speaker in response to a prompt;1
3. 800-dimensional i-vectors, computed from the 45s audio file recording the spoken reply.
The i-vectors (Verma and Das,2015) are a com-pact representation of the audio signal, typically used in speaker recognition. The raw audio file is not available for this task. The prompts for the text and spoken replies are also provided for both training and test data, but we did not use that in-formation in our work.
1Speech and text prompts are different.
(Estimation)
L1 Train Dev Test
ARA 1000 100 100
CHI 1000 100 100
FRE 1000 100 100
GER 1000 100 100
HIN 1000 100 100
ITA 1000 100 100
JPN 1000 100 100
KOR 1000 100 100
SPA 1000 100 100
TEL 1000 100 100
TUR 1000 100 100
[image:2.595.342.490.62.254.2]Total 11000 1100 1100 Table 1: NLI-2017 collection: #doc per L1.
In the NLI Shared Task 2017, the ESSAY track uses the text of the essay alone; TheSPEECHtrack uses the transcript as well as the i-vectors; In the FUSION track, all information can be used. Fi-nally, note that we only participated in the closed data condition, where only the provided collection may be used for modelling.
2.2 Features
For the text data (essays and transcripts), we gen-erated a number of fairly standard textual features. Each type of feature results in a specific feature space that we denote by a tag indicating the type of feature, and a number indicating the size, e.g. char3for trigrams of characters.
Characters: We extracted subsequences of 3 to
6 characters from the text. This was done first on the tokenized text (as provided by the orgnizers), resulting in 4 feature spaces: char3, char4, char5 and char6. We extracted the same features from the raw, un-tokenized text, resulting in another four sets of features: rchar3, rchar4, rchar5 andrchar6.
Words: We extracted subsequences of 1 to 4
words from the tokenized text, ignoring punctuation, resulting in 4 feature sets: bow1,bow2,bow3andbow4.
POS: We extracted subsequences of 1 to 3
part-of-speech tags, as produced by the freely available Stanford POS tagger,2v3.7.0
(Toutanova et al.,2003). This produced three feature sets:pos1,pos2,pos3.
For the character and word ngrams, we use a
tf-idf weighting corresponding to the ltc weight-ing scheme (i.e. log term frequency, (log) inverse document frequency, and cosine normalization) in SMART (Manning et al., 2008, Fig. 6.7). Be-cause most part-of-speech tags tend to occur in most documents, we did not use idf on the part-of-speech ngrams, and only perform scaling to unit length (nncweighting in SMART).
Finally, in the SPEECHandFUSION tracks, the i-vectors were used as provided, either alone or in conjunction with another transcript feature. In that case, we scaled the i-vectors to unit length (cosine normalization).
2.3 Models
Equipped with multiple ways to generate features from documents, we will now review the models we estimated on those, as well as the approaches we investigated to improve the voting combina-tion.
Model Estimation
We addressed the problem of identifying the na-tive language as a document categorization prob-lem with 11 classes (one per native language). We use 11 binary classifiers trained in a one-versus-all fashion, with a calibration layer on the classifier output in order to provide proper multilabel pre-dictions.
Each of the base one-vs-all classifier is a Support Vector Machine trained using SVMlight (Joachims, 1998) with linear kernels, all default parameters and cost factor (-j) set to 10 in order to balance positive and negative examples. Once a classifier is trained, its output is calibrated in or-der to output proper probabilities, using a mixture of Gaussian distributions (Bennett,2003). This al-lows the output of the 11 classifiers to be well-behaved probabilities that we can compare in or-der to predict the most probable class, or use in further post-processing in combination with other classifier’s outputs.
Our first submission in each of Tables 2–4is a single model trained that way, all other submis-sions are voting combinations, as described below.
Model Combination
Leveraging ensembles of models has proven ef-fective in order to improve performance on
Na-tive Language Identification (Tetreault et al.,2013; Malmasi and Dras, 2017) and many other NLP tasks (Goutte et al., 2014). Among many alter-natives, we focus on voting, a conceptually and practically simple approach where each model in the ensemble casts a vote towards a class, votes are tallied and prediction goes to the most voted class. In plurality voting, all models cast a sin-gle, identical vote towards one class. Other vari-ants weigh votes according to, for example, how confident each model is in its prediction. Two important hyper-parameters influence the result-ing prediction and its quality: 1) the number of voting systems, and 2) the way these systems are selected.
In a typical learning setup, it makes sense to let both of these choices be led by the resulting esti-mated prediction error. In previous work, we sim-ply ranked models according to prediction error, estimated on either a separate validation/dev set or by cross-validation, and selected models in de-scending order of performance until the resulting combined performance started to drop.
For this evaluation, we experimented with a greedy selection approach: instead of considering all models in descending order of performance, we 1. Start with an ensemble containing only the highest performing model; place all remain-ing models in a candidate pool.
2. Add each candidate from the pool in turn to the current ensemble; compute resulting esti-mated performance.
3. Pick the candidate that produce the best per-formance, remove it from the pool and place it in the ensemble.
4. Iterate Steps2–3until pool is empty.
This greedy algorithm performs the optimal choice at each step but does not reconsider pre-vious choices in order to further improve the model. It provides a one-step-optimal order in which models are added to the ensemble. In or-der to pick the number of models to include in the ensemble, we again look at the estimated predic-tion error. The simplest method is to look again at dev set or cross-validation performance. There are two issues with this, however:
esti-mate, these choices are clearly not indepen-dant, so our results will be biased. Typically, the number of models will be over-estimated. 2. We are essentially performing multiple com-parisons between ensembles based on the same performance estimate. Unless we cor-rect for multiple comparison, this will again lead to overestimate the ensemble size. In order to partly address these concerns, we proceed with a selection method inspired byhalf sampling(Mccarthy, 1969). We split the evalua-tion data in two balanced halves (half the dev set, or half the full set in cross-validation). We use one half to estimate the best models to add to the en-semble, as above, and use the other half to get an unbiased estimate of the gain in performance from each addition, in order to select the best ensemble size. Of course we can swap the two halves, and there are many (correlated) ways to split the eval-uation data. In our experiment we only considered one split in half, and swapped the two halves, re-sulting in two ensembles (last two submissions in Table4).
Another combination approach is stacking
(Wolpert,1992), where a meta-classifer is trained to predict on the basis of base model scores. This approach was shown to be effective on Native Lan-guage Identification (Malmasi and Dras, 2017), and when several meta-classifiers are available, they can again be combined for further gains. The main drawback is that there are more parameters to estimate than in a simple ensemble combination approach.
3 Results 3.1 Explorations
In our preliminary experiments, we validated all design decisions by evaluating performance in two ways:
1. Building models on the official train set, and testing on the official dev set containing 1100 examples;
2. Joining the official train and dev data into one training set on which we run 10-fold cross-validation.
We later present both performance estimates for our submitted systems, together with the official test performance.
Dev CV Test
System Acc. Acc. m-F1 Acc.
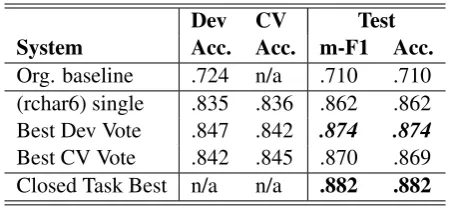
[image:4.595.305.530.62.166.2]Org. baseline .724 n/a .710 .710 (rchar6) single .835 .836 .862 .862 Best Dev Vote .847 .842 .874 .874 Best CV Vote .842 .845 .870 .869 Closed Task Best n/a n/a .882 .882
Table 2: Results for the closedESSAYtrack: orga-nizer’s baseline, our three submissions (our best result emphasized, best results in bold) and the best ranked system. ’Acc.’ is accuracy and ’ m-F1’ is macro-averaged F1.
3.2 ESSAYtrack
Our three submissions to theESSAYtrack are sim-ple and typical illustrations of the ideas we ex-plored for this evaluation:
1. Best single feature set (rchar6): the use of 6-grams on raw text (no tokenization or cas-ing) provides the best performance estimates on both the dev set and in cross-validation.
2. The best vote, optimized on dev set perfor-mance, includes 10 models trained on the following feature sets: rchar6, char6, pos3,bow2,bow4,char3,bow1,bow3, char4,pos2.
3. The best vote, optimized on cross-validation performance, includes 7 models trained on the following feature sets:rchar6,char6, bow3,rchar3,bow1,bow2,pos3.
The performance of our three submissions on the test set is shown in Table 2. The first out-come is that the single model based on raw text character 6-grams performs very significantly above the organizer-provided baseline. It is also our best performing single system, outperforming bag-of-words, bag of wordngrams, part-of-speech
ngrams, or character ngrams extracted from to-kenized text. This suggests that large character
ngrams, without any linguistic pre-processing, are more than competitive with any of the typical tex-tual features. The test performance of this simple model is around 86%, which is higher than any performance reported at the NLI-2013 evaluation (on a different dataset, of course).
Dev CV Test
System Acc. Acc. m-F1 Acc.
Org. baseline .755 n/a .798 .798 (rchar6+ivec) .826 .737 .845 .845
[image:5.595.308.531.63.218.2]Best Dev vote .843 .810 .841 .841 Closed Task Best n/a n/a .876 .876
Table 3: Results for the closedSPEECHtrack: or-ganizer’s baseline, our two submissions (our best result emphasized, best result in bold) and the best ranked system. ’Acc.’ is accuracy and ’m-F1’ is macro-averaged F1.
however: our best voting combination reached
87.4%accuracy, a gain of1.2%over our best sin-gle system. This was obtained by optimizing the number of voting systems on the dev set, although the cross-validation-optimized vote performs less than0.5%below our top submission on this track. Our best result is 0.78% below the top ranked system in the closedESSAYtrack, a difference that is not statistically significant and places our result in a set of 7 groups tied for first (out of 17 groups). We believe that this shows both how sophisticated and how mature statistical models for NLI have become. The confusion table for our best entry in shown in Figure1(left).
3.3 SPEECHtrack
For theSPEECHtrack, we only considered the use of transcripts and i-vectors, either together in a joint feature space, or within a voting ensemble. Also, we do not present the results of our first three submissions, due to an incorrect scaling of the i-vectors. The two systems we report here are:
1. A system with a single feature set (rchar6) together with the unit-scaled i-vectors: the use of 6-grams alone on the transcript clearly under-performs, topping at58%in our exper-iments; the addition of i-vectors proved nec-essary to get competitive performance.
2. The best vote, optimized on dev set perfor-mance, includes 9 models: five with scaled i-vectors (withrchar6,bow2,pos3,bow1, pos2) and four using transcripts alone (pos2, rchar5, rchar3, char3). This shows that even though transcript features underperform, they may be useful in an en-semble.
Dev CV Test
System Acc. Acc. m-F1 Acc.
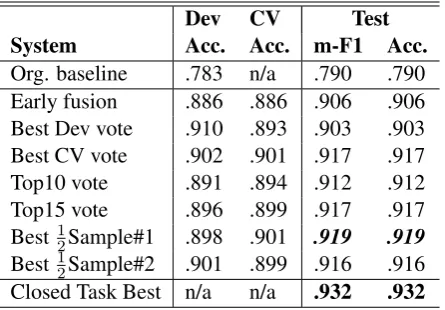
Org. baseline .783 n/a .790 .790 Early fusion .886 .886 .906 .906 Best Dev vote .910 .893 .903 .903 Best CV vote .902 .901 .917 .917
Top10 vote .891 .894 .912 .912
Top15 vote .896 .899 .917 .917
Best 1
2Sample#1 .898 .901 .919 .919
Best 1
2Sample#2 .901 .899 .916 .916
[image:5.595.70.297.64.151.2]Closed Task Best n/a n/a .932 .932
Table 4: Results for the closedFUSION track: or-ganizer’s baseline, our two submissions (our best result emphasized, best result in bold) and the best ranked system.
Results from Table 3 show that both submis-sions outperform the baseline. The voting ensem-ble actually achieved slightly lower performance than the single system (by a handful of examples), the accuracy of which is2.9%below our best ES-SAYtrack submission.
Our best result is 3.07% below the top ranked system in the closed SPEECH track, a difference that is statistically significant and places our result alone below a set of 3 groups tied for first (out of 10 groups). The confusion table for our best entry in shown in Figure1(middle).
3.4 FUSIONtrack
For the FUSION track, we submitted several sys-tems, as this was the core of our investigation:
1. A simple early fusion system plays the role of the “single feature set” for theFUSIONtrack: it usesrchar6on the essay text,char6on the transcripts and scaled i-vectors.
2. The best ensemble, selected to maximize dev set performance (both order and number of base models), contains 23 base models mix-ing essay, transcripts and i-vector features. 3. The best ensemble, selected to maximize
cross-validation performance, contains 24 base models mixing essay, transcripts and i-vector features.
CHI JPN KOR HIN TEL FRE ITA SPA GER ARA TUR Predicted label CHI JPN KOR HIN TEL FRE ITA SPA GER ARA TUR True label
89 3 1 3 1 1 1 1
3 94 2 1
2 9 84 1 1 1 2 1 84 15
17 81 2 1 1 1 88 2 4 3
1 4 89 4 1 1 1 1 2 1 2 91 1 1
1 1 1 3 94 2 1 2 2 2 3 86 2
2 2 3 1 2 1 3 2 3 81
Confusion Matrix 0.0 0.1 0.2 0.3 0.4 0.5 0.6 0.7 0.8 0.9
CHI JPN KOR HIN TEL FRE ITA SPA GER ARA TUR
Predicted label CHI JPN KOR HIN TEL FRE ITA SPA GER ARA TUR True label
95 3 1 1
1 88 5 1 1 2 2 2 4 89 1 1 2 1
70 29 1
19 79 1 1 1 2 2 82 3 2 6 1 1 1 1 1 4 86 2 4 1 1 2 4 4 2 82 4 1
1 1 1 2 1 94 2 2 1 1 8 3 1 3 77 2
1 1 2 1 1 2 5 87
Confusion Matrix 0.0 0.1 0.2 0.3 0.4 0.5 0.6 0.7 0.8 0.9
CHI JPN KOR HIN TEL FRE ITA SPA GER ARA TUR
Predicted label CHI JPN KOR HIN TEL FRE ITA SPA GER ARA TUR True label
97 1 1 1 97 1 1 1
1 2 94 2 1
80 20
10 88 1 1 1 1 91 2 3 2
1 4 92 2 1 1 2 1 95 1
1 2 97 1 2 1 3 1 1 1 88 2
1 1 2 4 92
[image:6.595.84.527.63.195.2]Confusion Matrix 0.0 0.1 0.2 0.3 0.4 0.5 0.6 0.7 0.8 0.9
Figure 1: Confusion tables of our best system in each track:ESSAY(left),SPEECHandFUSION(right).
the ensemble on the same performance in-deed overestimates the ensemble size.
5. Two half-sample ensembles, estimated by splitting the cross-validated predictions in halves, as described in Section2.3and swap-ping the halves for ordering and selecting the models.
Table 4 shows that most ensembles gain over the early fusion approach, but the improvement is limited to less than 1.5%. Only the “Best Dev vote” ensemble displays a drop in performance. This suggests that, as expected, the smaller dev set provides a less reliable estimate of performance, and performance improvements, than the cross-validation or half-sampling approaches. The Top-15 ensemble yields the same performance as the “Best CV” vote, which contains 24 base models. This shows that several of those base models bring no actual gain in predictive performance, confirm-ing that selectconfirm-ing the order and number of base models in the ensemble tends to over-estimate the ensemble size. The best overall result is provided by the first half-sampling ensemble, which reaches
91.9%accuracy. This is less than.3%above, and likely not significant compared to the three clos-est following ensembles (“Bclos-est CV”, “Top15” and “Best 1
2Sample#2”).
We also note that allFUSIONsystems, even the simple early fusion, are clearly above the ESSAY and SPEECHresults, suggesting that using multi-ple sources of information is indeed beneficial.
Our best result is 1.26% below the top ranked system in the closed FUSION track, a difference that is not statistically significant and places our result in a set of 4 groups tied for first (out of 4 groups). Again, this shows that several approaches are able to yield high accuracy and
state-of-the-art results on this difficult NLI task. The confu-sion table for our best entry in shown in Figure1 (right). This suggest a high level of predictive per-formance, except for the confusion between Hindi and Telugu, which was already noted in the 2013 evaluation.
4 Discussion
4.1 Voting and Optimal Ensembles
Our results confirm that ensemble methods, and voting in particular, provide small, but system-atic gains in predictive performance. Our work suggests, however, that there is some variability in results depending on how the ensemble is esti-mated, and in particular on what estimator of pre-dictive performance is used. For example, the as-sessment of performance improvement is hardly consistent across the dev, CV and test estimators, although each estimator usually will produce en-sembles that gain over a single system. We feel that there may be room to improve the design on ensembles, and voting ensembles in particular.
4.2 Are Characters the New Words?
Our work on Native Language Identification con-firms that long character ngrams can yield state-of-the-art performance, and often outperform word ngrams. This confirms earlier work on similar tasks such as Discriminating Similar Languages. Clearly, the fact that we are able to handle large
on which word-based approaches typically suffer. The downside is the need to index many ngrams. This is partly offset by 1) the fact that the number of actually observed ngrams grows much slower than the number of possible ngrams, and 2) mod-ern indexing techniques such as hashing are essen-tially insensitive to the theoretical feature set size. Working with long ngrams offers the prospect of developping versatile document categorizers that work on several languages and character sets with no prior linguistic tools (eg no segmentation for Chinese or no vowelization for Arabic).
Acknowledgements
This work was carried out as part of the Multi-media Analytics Tools for Security (MATS) pro-gram at the National Research Council Canada. We wish to thank the organizers for providing use-ful baselines and formatting results in a way that made our work so much easier.
References
Paul N. Bennett. 2003. Using asymmetric
distri-butions to improve text classifier probability es-timates. In Proceedings of the 26th Annual In-ternational ACM SIGIR Conference on Research and Development in Informaion Retrieval. ACM, New York, NY, USA, SIGIR ’03, pages 111–118.
https://doi.org/10.1145/860435.860457.
Cyril Goutte and Serge L´eger. 2016. Advances in ngram-based discrimination of similar languages. In
Proceedings of the Third Workshop on NLP for Sim-ilar Languages, Varieties and Dialects. pages 178– 184.
Cyril Goutte, Serge L´eger, and Marine Carpuat. 2014. The NRC system for discriminating similar
lan-guages. In Proceedings of the First Workshop on
Applying NLP Tools to Similar Languages, Varieties and Dialects (VarDial). Dublin, Ireland, pages 139– 145.
Cyril Goutte, Serge L´eger, Shervin Malmasi, and Mar-cos Zampieri. 2016. Discriminating similar
lan-guages: Evaluations and explorations. In
Proceed-ings of the 10th International Conference on Lan-guage Resources and Evaluation (LREC 2016). Radu Tudor Ionescu, Marius Popescu, and Aoife
Cahill. 2016. String kernels for native language identification: Insights from behind the curtains.
Computational Linguistics42(3):491–525.
Thorsten Joachims. 1998. Text categorization with Su-port Vector Machines: Learning with many relevant features. In Claire N´edellec and C´eline Rouveirol,
editors, Proceedings of ECML-98, 10th European
Conference on Machine Learning. Springer, volume
1398 ofLecture Notes in Computer Science, pages
137–142.
Shervin Malmasi. 2016. Native Language
Identifica-tion: Explorations and Applications. Ph.D. thesis, Macquarie University Center for Language Technol-ogy. http://hdl.handle.net/1959.14/1110919. Shervin Malmasi and Mark Dras. 2017. Native
lan-guage identification using stacked generalization.
arXiv preprint arXiv:1703.06541.
Shervin Malmasi, Keelan Evanini, Aoife Cahill, Joel Tetreault, Robert Pugh, Christopher Hamill, Diane Napolitano, and Yao Qian. 2017. A Report on the 2017 Native Language Identification Shared Task. In Proceedings of the 12th Workshop on Building Educational Applications Using NLP. Association for Computational Linguistics, Copenhagen, Den-mark.
Shervin Malmasi, Joel Tetreault, and Mark Dras. 2015. Oracle and Human Baselines for Native Language
Identification. In Proceedings of the Tenth
Work-shop on Innovative Use of NLP for Building Edu-cational Applications (BEA-10). pages 172–178. Christopher D. Manning, Prabhakar Raghavan, and
Hinrich Sch¨utze. 2008. Introduction to Information Retrieval. Cambridge University Press.
P. J. Mccarthy. 1969. Pseudo-replication: Half sam-ple. Review of the International Statistical Institute
37(3):239–264.
Joel Tetreault, Daniel Blanchard, and Aoife Cahill. 2013. A report on the first native language
identi-fication shared task. InProceedings of the Eighth
Workshop on Innovative Use of NLP for Building Educational Applications. Association for Compu-tational Linguistics, Atlanta, GA, USA.
Kristina Toutanova, Dan Klein, Christopher Manning,
and Yoram Singer. 2003. Feature-rich
part-of-speech tagging with a cyclic dependency network. InProceedings of the HLT-NAACL 2003. pages 252– 259.
Pulkit Verma and Pradip K. Das. 2015. i-vectors in
speech processing applications: a survey. Interna-tional Journal of Speech Technology18(4):529–546.
https://doi.org/10.1007/s10772-015-9295-3.
David H. Wolpert. 1992. Stacked generalization.