A method to predict residues conferring functional
differences between related proteins:
Application to MAP kinase pathways
DANIEL R. CAFFREY,1,2LUKE A.J. O’NEILL,2andDENIS C. SHIELDS1
1Department of Clinical Pharmacology, Royal College of Surgeons in Ireland, 123 St. Stephens Green, Dublin 2, Ireland 2Department of Biochemistry and Biotechnology Institute, Trinity College, University of Dublin, Dublin 2, Ireland ~ReceivedNovember 11, 1999;Final RevisionJanuary 18, 2000;AcceptedJanuary 20, 2000!
Abstract
Physicochemical properties are potentially useful in predicting functional differences between aligned protein subfam-ilies. We present a method that considers physicochemical properties from ancestral sequences predicted to have given rise to the subfamilies of interest by gene duplication. Comparison between two map kinases subfamilies, p38 and ERK, revealed a region that had an excess of change in properties after gene duplication followed by conservation within the two subfamilies. This region corresponded to that experimentally defined as important for substrate and pathway specificity. The derived scores for the region of interest were found to differ significantly in their distribution compared to the rest of the protein when the Kolmogorov–Smirnov test was applied~p50.005!. Thus, the incorporation of ancestral physicochemical properties is useful in predicting functional differences between protein subfamilies. In addition, the method was applied to the MKK and MAPK components of the p38 and JNK pathways. These proteins showed a similar pattern in their evolution and regions predicted to confer functional differences are discussed.
Keywords: MAP kinase; physicochemical properties; protein evolution and structure; sequence analysis
Evolution of novel protein function often occurs by gene duplica-tion from a common ancestor, which is followed by divergence of the two subfamily sequences. It is of great interest to be able to identify the residues or regions of a protein that confer specificity. The difficulty in simply comparing the two proteins is that differ-ing residues may merely be unimportant. Some measure of the extent of constraint is required. Frequently, there is a good deal of sequence information that gives an indication of the level of con-straint at a given residue. More distantly related proteins may also be available for study. In addition, since the duplication of the functionally divergent proteins, there has been evolutionary change between species among the two groups of sequences. A useful objective is to develop methods that can quantify and visualize such evolutionary comparisons. Livingstone and Barton presented a method of visualizing regions that are specific to a subfamily
~Livingstone & Barton, 1993!. This allows the degree of constraint
within two subfamilies to be compared and can provide some clues. They did not attempt to validate the utility of this method. The mitogen activated protein kinases ~MAPKs! represent a group of related and interacting signaling proteins, whose func-tional roles are incompletely characterized. There is some exper-imental evidence assigning functional specificity to particular regions. Therefore, it would be of great interest to predict regions conferring functional specificity, both to validate the computer methods relying on available experimental data, and to provide computer generated models of which regions are functionally im-portant, which can, in turn, be validated by subsequent experi-mental analysis. These proteins have undergone noticeable gene duplications with associated diverged functions. For example, p38 and c-jun N-terminal kinase~JNK!have evolved distinct functions since the divergence of multicellular mammals from fungi. In ad-dition, there are deeper levels of duplications~giving rise to the hyperosmolarity and pheromone pathways in Saccharomyces
ce-revisiae!, which have apparent orthologues in the mammalian stress
~p380JNK! and classical0ERK pathways, respectively. There are also more recent duplications in vertebrate lineages, for which the protein sequences have different tissue distributions or subtle dif-ferences in activating ability that may account for the maintenance of these so-called isoforms.
A typical MAPK module consists of a MAPK that is activated by an upstream MEK~MAPK0ERK kinase! by dual phosphory-Reprint requests to: Denis Shields, Department of Clinical
Pharmacol-ogy, Royal College of Surgeons in Ireland, 123 St. Stephens Green, Dublin 2, Ireland; e-mail: [email protected].
Abbreviations: AC, ancestral conservation; BAD, burst after duplication; BADT, burst after duplication total; Ci, conservation number; ERK, extra-cellular regulated kinase; FC, family conservation number; JNK, c-jun N-terminal kinase; MAPK, mitogen activated protein kinase; RC, recent conservation; SC, subfamily conservation number; SS, subfamily score; SST, subfamily score total.
Protein Science~2000!, 9:655–670. Cambridge University Press. Printed in the USA. Copyright © 2000 The Protein Society
lation. This MEK is activated by its upstream MEKK~MEK ki-nase!such that a cascade of kinases~MEKKrMEKrMAPK! can be activated by various extracellular signals and upstream kinases that, in turn, lead to phosphorylation of transcription fac-tors and various other substrates~Cobb & Goldsmith, 1995!. In animals and yeast, there are several parallel and distinct MAPK modules that appear to be activated by different extracellular sig-nals, and thus lead to activation of different transcription factors and other proteins leading to different phenotypes. Recent evi-dence suggests that the MEK and MAPK components of the mam-malian JNK and p38 pathways arose from the duplication of common ancestors~2K9and 1K9!that was likely to be activated in a similar manner to the present-day yeast hyperosmolarity pathway
~Caffrey et al., 1999!. This duplication occurred prior to the di-vergence of Caenorhabditis elegans and mammals, but after the divergence of fungi from C. elegans.
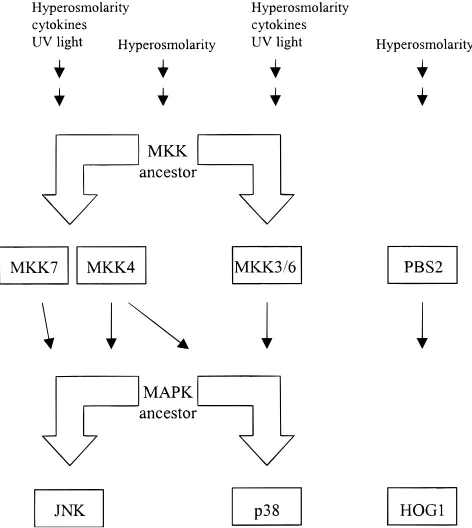
The JNK and p38 pathways appear to have evolved distinct biochemical properties since their duplication~Figs. 1, 2A, 2B!. In the p38 pathway, the MEK components~MKK3 and MKK6! spe-cifically activate p38 isoforms but not JNK isoforms~Raingeaud et al., 1996!. Activated p38 translocates to the nucleus and acti-vates a number of transcription factors including ATF-2~Raingeaud et al., 1995!and CHOP0GADD153~Wang & Ron, 1996!. In the JNK pathway, the MEK component MKK7 specifically activates JNK isoforms. MKK4~a MEK! activates JNK, although it also activates the p38 isoforms, and so the pathways are not entirely distinct~Moriguchi et al., 1997!. Activated JNK also translocates to the nucleus where it can activate transcription factors such as ATF2 and c-jun~Livingstone et al., 1995!. It is thought that JNK
[image:2.612.322.553.55.556.2]and p38 bind different regions of ATF2 ~Treisman, 1996!. JNK isoforms and splice variants can also vary in their ability to acti-vate a particular transcription factor~Kallunki et al., 1994; Gupta et al., 1996!. The resulting activation of the p38 and JNK pathways can lead to expression of cytokines, apoptosis, and mitotic arrest, depending on the cell type and stress conditions. The p38 and JNK pathways can be activated by similar extracellular stresses that Fig. 1. Schematic diagram of the stress-induced MAP kinase pathways in
animals and yeast at the MAPK and MKK levels. Upstream and intermedi-ate activators are described in the text and reviews. Black arrows represent protein phosphorylation and activation. The large arrows represent gene duplication events from a common ancestor as deduced from Figure 2.
A
B
[image:2.612.62.298.411.675.2]C
Fig. 2. Phylogenetic trees for the JNK0p38 pathway gene duplications at the~A!MAPK and ~B!MEK levels. ~C!This shows the tree used to analyze differences between p38 and ERK. Branch lengths correspond to inferred rates of evolution. The bold lines correspond to the respective period in time that pathways are likely to have evolved into distinct path-ways since their gene duplications from a common ancestor.
lead to similar phenotypes, but it is clear that these pathways are not completely redundant. The absence or disruption of MAPK or MKK components in the fly, mice, and different cell lines can have dramatic effects~Dong et al., 1998; Ganiatsas et al., 1998; Ip & Davis, 1998; Lu et al., 1999; Nishina et al., 1999!. Furthermore, it is likely that the ability or inability of these respective pathways to interact with scaffolding proteins will provide additional specific-ity~Whitmarsh & Davis, 1998!.
Since the divergence of mammals from C. elegans and
Dro-sophila melanogaster, these kinases have duplicated to give
vari-ous isoforms of p38 and JNK. Likewise, at the MEK level, MKK3 and MKK6 could also be considered isoforms. It is not entirely clear that all these isoforms provide additional enzymatic speci-ficity or function. The JNK and p38 pathways had evolved into specific pathways prior to the divergence of D. melanogastor and mammals. In fact, the presence of orthologous sequences in C.
elegans suggests that these distinct pathways existed prior to the
divergence of C. elegans, insects, and mammals, although these pathways have yet to be experimentally characterized in C. elegans
~Caffrey et al., 1999!. In Drosophila, HEP activates DJNK, which is mirrored by the orthologous MKK7rJNK pathway in mam-mals~Sluss et al., 1996!. The p38 pathways are also very similar for mammals and Drosophila~Han et al., 1998!. It follows that the evolutionary changes that occurred after the duplication of the p38 and JNK pathways contributed to the majority of present-day spec-ificity. Although there is clear experimental evidence showing that the p38 and JNK pathways had diverged prior to the split of mam-mals and Drosophila, the pattern of gene duplication indicates that the pathways arose prior to divergence of C. elegans and mammals. Here we present a novel method that compares protein evolution immediately following gene duplication vs. evolution in the more recent period. A duplicated gene is more likely to be retained if it can rapidly acquire a novel and beneficial function by altering the amino acid sequence that it codes for. This method is validated by comparison with experimental data defining regions conferring specificity for p38 and ERK~extracellular regulated kinase! chi-meras. We then focus on the evolutionary events that occurred after the gene duplications of the p380JNK, and upstream MKK 3060 407 progenitors.
Results
Comparison of p38 and ERK
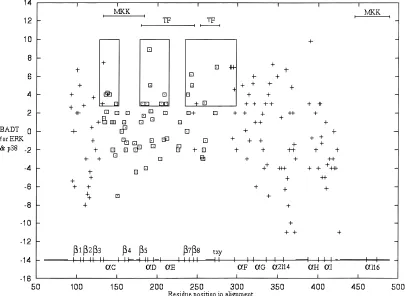
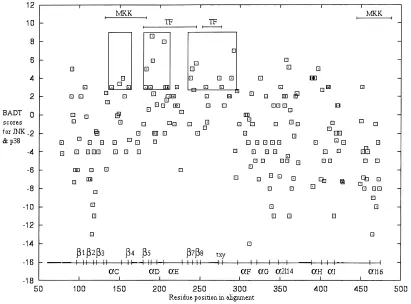
The average accuracy for predicted ancestral sequences p389, ERK9, and their common ancestor 1K0was 0.8 in each case. A subset of sites was classed as important for pathway specificity based on experimental evidence~see Materials and methods!. In practice, the regions represent an almost continuous stretch within the pro-tein sequence, which is largely associated with substrate binding and interaction with upstream MKKs. However, it must be em-phasized that experiments indicate that regions and not any one residue confer specificity. BAD ~burst after duplication! scores were calculated separately for ERK and p38, with high scores indicating residues that have undergone many physicochemical changes on the ancestral branch but are subsequently conserved to a high degree since speciation events within the subfamily clade. These were summed to give a BADT score and are shown in Figure 3. Sites involved in pathway specificity are found between position 134 and 275. Residues within this region tend to have noticeably different BADT values. This difference mainly reflects
an absence in highly negative scores. This indicates that sites in this region are either conserved for both p38 and ERK, or they have undergone many changes in physicochemical properties since gene duplication that have subsequently been conserved for p38 and0or ERK. The difference in distributions between experimen-tally important and other sites was determined to be significant
~p50.005!, using the Kolmogorov Smirnov two-sample test. In contrast, the SST method, which does not use ancestral informa-tion~see Materials and methods!, fails to show a pattern as distinct
~Fig. 4!, and the distributions were not significantly different~p5
0.625!. Likewise, the individual p38 SS values and the ERK SS values that are summed to give SST did not have significantly different distributions between experimentally important and other sites~data not shown!.
The experimentally important region is also more conserved than other regions of the protein. It is important to demonstrate that evolutionary conservation across p38 and ERK does not simply account for the difference in BADT values. The family conserva-tion~FC! score differentiates somewhat between the experimen-tally important and other regions, but not as strongly~p50.047! as the BADT score. Thus, BADT is a better predictor of the ex-perimentally important region and unlike FC, it has the additional capacity to identify individual sites that are likely to contribute to pathway specificity. Other components of the BADT score~e.g., the p38_BAD, ERK_BAD, and the components RC~recent con-servation!and AC~ancestral conservation!scores for each!did not differentiate experimental and other sites as efficiently as BADT. This indicates that the approach of comparing the ancestral and recent patterns of evolution is worthwhile. A simpler calculation of BAD using the most likely ancestral residues, rather than summing over all likely ancestral residues did not differ markedly. However, the method incorporating the ancestral residue probabilities is likely to be more informative in the assessment of a site.
The highest scoring residues are potentially of particular impor-tance in determining kinase function. However, because the ex-perimental assessment of function has generally been limited to regional chimeras rather than systematically replacing individual residues of p38 with ERK~and vice versa!, it is not clear whether these residues are indeed of particular importance. However, high BADT values generally cluster along the primary sequence~boxed regions, Fig. 3!. The boxed regions are of interest given that they are found in a region that has few negative scores and is known to be experimentally important. The first box contains a cluster of residues that includes Tyr620His64, Glu640Lys66, and Leu670 Tyr69 of a-helix c in the ERK0p38 structures. This region has been shown to direct interaction with the upstream MKKs for p38 and ERK ~Brunet & Pouyssegur, 1996; Horiuchi et al., 1998!. These residues have not been examined individually for specific-ity. The highest scoring site in this boxed region corresponds to His590Ser61 in the ERK0p38 structures. It has not been shown to direct functional differences between p38 and ERK but is located at the C terminus of loop 4 that joinsa-helix c. The second box contains sites belonging tob5, loop 7,a-helix d, loop 8, and the beginning ofa-helix e~Domains V-VIA!. The two highest scoring sites are Tyr1110Asn114 and Lys1120Asn115 ina-helix d of the ERK0p38 structures. The entire region was shown to be important for recognition of downstream substrates~Brunet & Pouyssegur, 1996!. The third box contains sites belonging tob7, loop 11,b8, with high scoring sites in b7 and loop 11, that correspond to Leu1540Ala157, Thr1570Glu160, and Thr1580Asp161 in the ERK0 p38 structures. These are also likely to be important for
tion of downstream substrates ~Brunet & Pouyssegur, 1996!. Interestingly, the highest scoring residue in this region is residue “X” of the TXY motif ~BADT 5 7!, where the threonine and tyrosine are phosphorylated by MKKs. This residue does not solely contribute to recognition by upstream MKKs. However, it is be-lieved to direct downstream substrate recognition in combination with other domains and residues from loop12~Jiang et al., 1997!. Unfortunately, many of the residues in loop 12 could not be as-sessed due to alignment gaps, but are also likely to contribute to differences in substrate recognition.
Visualization of these high scoring residues on the three-dimensional structure of p38 reveals that they cluster in particular regions. These regions are near the ATP binding region and also close to a region corresponding to the peptide binding groove identified in the kinases cAPK~Knighton et al., 1991!and twitchin
~Hu et al., 1994! ~see Discussion!. This provides circumstantial evidence that these residues are indeed more likely to be function-ally important. Table 1 describes the relationship between sites of interest and their structural interaction. With the exception of po-sition 296, secondary structure is conserved despite the observed changes in physicochemical properties since gene duplication. Like-wise, solvent accessibility is mostly conserved. Residues that are
[image:4.612.107.513.62.358.2]hydrogen bonded to the site of interest are described for main chain to main chain, side-chain to main-chain amide, side-chain to main-chain carbonyl, and side chain to side chain. The former are generally represented in secondary structure, while the latter~in order of importance!are generally involved in conformation and structural interaction~Mizuguchi et al., 1998!. There are several examples of hydrogen bond pairs that are unique to a given sub-family and may have been gained or lost as a result of the observed mutations. Some of the residues involved in hydrogen bonding are of particular interest in that they also have a high BADT and suggest correlated evolution between sites. Position 133 and 136 are close in primary sequence and join loop 4 and a-helix c. Hydrogen bonds between position 136 and 138 also contribute to the a-helix c secondary structure. In the p38 structure, site 141 forms a hydrogen bond with site 136 and is likely to influence structural differences between p38 and ERK fora-helix c. Ina-helix e, the hydrogen bonded sites 209 and 205 both have a high BADT, and their interactions in both p38 and ERK could contribute to differences in structural function. There are several other residues forming hydrogen bonds to only one of the subfamilies for a given site. Sites that are hydrogen bonded to sites with high BADT values but are distant in primary structure do not themselves have Fig. 3. Prediction of regions conferring functional differences between ERK and p38. The burst after duplication~BAD!scores for ERK and p38 are summed to give a BAD total~BADT!, and are plotted on the vertical axis. Sites identical across p38 and ERK are not plotted. The residue positions plotted on the horizontal axis are those of the multiple alignment and also Figure 8. The more positive values will reflect sites in which one or both subfamilies have undergone significant evolution~after gene duplication from 1k0! followed by high conservation~more recently!. High scores that cluster along the primary sequence and are found in the region with few negative scores are boxed.▫{indicates that the site has been experimentally implicated in pathway specificity, and1indicates that the site has yet to be implicated in pathway specificity. The major structural elements are illustrated below the scores, and alignment gaps are in bold. Regions important in directing specific MKK and transcription factor~TF!interactions for p38 and ERK are also shown. Differences in distribution for experimentally important sites and other sites were significant using the Kolmogorov–Smirnov two sample test~p50.005!.
high BADT values. The total number of changes in a property for all sites of each subfamily is given in the bottom 2 rows. Hydro-phobicity, polarity, smallness, and charge are the most common changes. This is probably due to the large number of residues that have these properties. Most noticeably, there are a large number of changes in charge~102!and relatively few sites that retain charge
~*!. This may be consistent with observation that compensating amino acid changes within proteins often conserve overall charge
~Neher, 1994!. For example, positions 133, 136, 138, and 141 interact and show a gain and loss in charge in ERK since the duplication.
High scoring residues are not confined to the region defined to be experimentally important. These may represent false positives based on the following observations. First, experiments involving regional chimeras designed to identify functional differences be-tween ERK and p38 did not detect these regions. Furthermore, Figure 3 shows that such regions also include sites that have rel-atively large negative scores, meaning that they lack constraint for p38 or ERK. With the exception of sites that direct specificity for a particular subfamily, we would generally expect the recognition sites to be relatively conserved. Taken together, this suggests that a high BADT can predict functional differences when it is in a region lacking many negative scores.
Comparison of p38 and JNK
In our analysis we do not assume that JNK0p38 pathway speci-ficity evolved prior to the split of D. melanogaster and C. elegans,
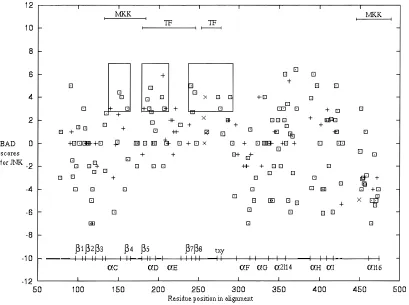
despite the gene duplication occurring prior to this event. Instead, pathway specificity is considered to have occurred prior to the split of D. melanogaster and mammals. The average accuracy for pre-dicted ancestral sequences p389, JNK9, and 1K9 ~JNK0p38 com-mon ancestor!was 0.9 in all cases. The long branch that leads to the JNK family indicates that the majority of the evolution has occurred in the JNK family~Fig. 1A!, because the duplication of p38 and JNK from their common ancestor~1K9!. This is reflected in higher BAD scores for JNK ~Fig. 5! than for p38 ~Fig. 6!. BADT~Fig. 7!has a similar pattern to JNK BAD scores, but may be a better measure of pathway specificity for a given site. Resi-dues 134 to 275 ~region identified from ERK0p38 studies! are again strikingly different from the rest of the protein for both p38, JNK, and the combined BADT score~Figs. 5–7!. Scores are higher in this region than for the rest of the protein. That is, sites are either highly conserved or have undergone a burst of evolution after duplication, followed by high conservation. This is reflected in a highly significant p-value distinguishing this region from the rest of the protein using the Kolmogorov–Smirnov test of unequal distributions~p50.012 for BAD_JNK, p50.000 for BAD_p38, and p50.000 for BADT!.
[image:5.612.96.510.59.364.2]BAD scores of 3 or greater have been boxed into proposed clusters. In JNK~Fig. 5!, the first box corresponds toa-helix c, loop 5, andb4~domains III–IV!that contribute to p38 and ERK interaction with upstream MKKs~Brunet & Pouyssegur, 1996!. The two highest scoring sites are Asn1190Lys79 and Lys1210 Glu81 in loop 5~JNK0p38 structure!. The second box spansb5, loop 7,a-helix d, loop 8, anda-helix e~domains V–VIa!. The four Fig. 4. The subfamily score~SS!for p38 and ERK is summed to give a total~SST!that is plotted on the vertical axis and the graph is plotted similar to Figure 3. The region deemed experimentally important did not differ significantly in its distribution from other sites ~p50.625!.
Table 1. Relationships between evolutionary change in physicochemical properties and structural function for selected residues across ERK (top) and p38 (bottom)a
Position
Ancestor
residue Hydrophobic Polar Small Proline Tiny Aliphatic Aromatic 1 2 Charged a Loop b Hydrogen bonds Exposed
H59 133 NrH 1 * 2 1 1 1 • 130 135 136 137 •
S61 133 NrS * * 1 • 131 135 136 137 •
Y62 136 FrF * * • 133 140 •
H64 136 FrH * 1 * 1 1 • 133 138 139 140 •
Q64 138 KrQ 2 * 2 2 • 134 135 142 454
K66 138 KrK * * * * • 134 135 136 140 141 142 452 •
L67 141 LrL * * • 137 143 144 145
Y69 141 LrY * 1 2 1 • 137 138 139 143 144 145
Y111 190 HrY * * * 2 2 • 188 192 193 194 234 •
N114 190 HrN 2 * 1 2 2 2 • 188 192 193 194 •
K112 191 KrK * * * * • 188 193 194 •
N115 191 KrN 2 * 1 2 2 • 188 189 193 195 •
C125 209 QrC 1 2 1 • 205 207 213 417 •
Q128 209 QrQ * • 205 213 •
L154 238 LrL * * • 247 •
A157 238 LrA * 1 1 2 • 247 •
T157 242 ErT 1 * 1 2 2 • •
E160 242 ErE * * * • 244 •
T158 243 NrT 1 * * • 240 245 •
D161 243 NrD * * 1 1 • 240 245 •
E184 274 ErE * * * • •
G181 274 ErG 1 2 1 1 2 2 • 276 279 •
K201 291 QrK 1 * 1 1 • 261 262 •
M198 291 QrM 1 2 • 293 •
G202 292 GrG * * * • 262 290
H199 292 GrH * 1 2 2 1 1 1 • •
K205 295 TrK * * 2 1 1 • 223 297 298 299 •
Q202 295 TrQ 2 * 2 • 223 227 297 298 •
S206 296 ArS 2 1 * * • 294 300 406 •
T203 296 ArT * 1 * 2 • 294 298 299 300 403 406 •
ERK total 7 2 4 0 0 0 1 5 1 6
P38 total 5 6 6 0 5 2 3 4 2 6
aSites correspond to those with a BADT of 4 or greater in the boxed regions of Figure 3 that are important for pathway specificity. The structural position and alignment position are given in the first column.
The common family ancestor residue and ancestor residues for the respective subfamilies are given in column 2.1indicates that a given property has been acquired,2indicates that a given property has been lost,pindicates that the property has been retained for a given mutation. • indicates that the residue belongs to aa-helix , loop,b-sheet, or is exposed when present. Residues that are hydrogen bonded to a given residue are denoted by their alignment position. Hydrogen bonds considered are side-chain to main-chain amide, side-chain to main-chain carbonyl, side chain to side chain, and main chain to main chain. Residues with a BADT of 3 or more are in italics, and those with a BADT of 4 or more are in bold. The final two rows show the sum of changes~1and2!for each property across all sites for each subfamily.
660
D.R.
Caffr
ey
et
highest sites are Asp1500Gly110 of loop 7, Cys1540Asn114 of helix d, Asp1620Thr123 of loop 8, and His1630Asp124 of
a-helix e. These residues are most likely to be involved in the recognition of downstream transcription factors~Brunet & Pouys-segur, 1996!. The third box spans loop 11, b8, loop 12 ~ do-main VII!. Scores greater than 4 include: Lys1980Asn159 and Thr2020Glu163 of loop 11, Gly0Asp176, Pro2220Gly181, and Gly2370Asn196 of loop 12. Loop 12 contains the phosphorylation lip, and ERK0p38 studies would suggest that this region contrib-utes along with other domains to the recognition of downstream substrates~Jiang et al., 1997!. The N-terminal region also has a lot of high scoring sites. These were not boxed as there are also many negative scores, and data from the ERK and p38 study would suggest that such regions are not important for functional differences. In p38~Fig. 6!, scores are generally lower, and this is consistent with the p38 subfamily having a shorter branch than the JNK subfamily since gene duplication. The higher scores are all surface exposed, and this is not always the case for JNK. This suggests that JNK may have undergone structural reorganization after gene du-plication. The boxed region spansb5~His1070Glu147!, loop 7, and a-helix d ~Asn1140Cys154 and Asn1150Gln155!. The sites correspond to a region defined in p380ERK chimeras to be im-portant in recognition of specific downstream transcription factors. This region also scores high for JNK~Fig. 5!and is reflected in the BADT score~Fig. 7!. In addition, the site corresponding to His1990 Gly239 in the C-terminal region of loop 12 scores high.
The BADT values have also been boxed~Fig. 7!. The three regions are a-helix C to b4 ~domains III–IV!, b5 to a-helix e
~domains V–VIa!, and b7 to loop 12 ~domains Vib–VII!, and are likely to be important for functional differences between p38 and JNK. Some of these sites are described in relation to their structural interaction and amino acid function in Table 2. Again, secondary structure and solvent accessibility are primarily con-served despite the obcon-served mutations. The p38 sites form hy-drogen bonds with more residues than JNK. Some of the residues with high BADT score interact with each other. Site 188 of loop 7 has a high BADT and forms hydrogen bonds with site 190
[image:7.612.100.509.59.364.2]~a-helix d! in both structures and with site 205 ~a-helix e! in JNK. In the JNK structure, site 205 also forms hydrogen bonds with site 207 and 209, and are likely to influence the overall structure of a-helix e. Sites 240 and 245 are at opposite ends of loop 11 and are part of theb hairpin formed byb7 and b8. There are several other residues forming hydrogen bonds to only one of the subfamilies for a given site. Again, as for the ERK0 p38 comparison, sites listed that are quite distant in primary structure do not have a high BADT. The total number of changes in a property for all sites of each subfamily is given in the last two columns. Hydrophobicity, smallness, and charge are the most common changes. This is probably due to the large num-ber of residues that have these properties. There are very few changes in polarity given the number of residues that have this property.
Fig. 5. Prediction of regions that have evolved functional differences in JNK since its duplication from the 1k0ancestor. Burst after duplication~BAD!scores for the JNK subfamily are plotted on the vertical axis, and the graph is plotted similar to Figure 3.▫{indicates that the site is exposed,1indicates that the site is buried, and3indicates that the residue was disordered in structure. The same region corresponding to experimentally important in Figure 3 is distinguished by a highly significant p-value also~p50.012!.
The BAD scores for individual subfamilies are not in themselves highly correlated ~e.g., JNK and p38 BAD scores only have a correlation of 0.2!. This suggests that the identified region is not simply a consequence of a high degree of interdependence be-tween the statistics calculated at a residue from the same alignment for different subfamilies.
Relationships between BAD0BADT scores and structure
Exposed residues for p38 and JNK have BAD scores that are a lot more variable than buried residues ~Figs. 5, 6!. This indicates exposed sites have a greater degree of freedom to evolve. The JNK and p38 structures can be superposed with little rotation~Xie et al., 1998!. The similarities and differences in structure for p38, ERK, and JNK are summarized in Figure 8. Sites that have a BADT of 4 or greater for p380JNK or p380ERK have been boxed. There are more high BADT scores for the p380ERK comparison than the p380JNK comparison~Fig. 8!, and this is a reflection of the more ancient duplication. Table 3 shows the relationship between BADT and residues buried or exposed in p38 and JNK. High BADT scoring sites~score of 4 or greater! are primarily exposed. It is expected that exposed sites will be more variable than buried sites. However, such sites have remained highly conserved since the divergence of D. melanogaster from humans, despite the initial burst in evolution that occurred after the divergence of fungi from animals. This is consistent with a role in functional specificity,
because exposed sites that are conserved are more likely to interact with substrates or activators. However, BADT scores of24 or less are primarily exposed also. A possible interpretation is that ex-posed sites are generally unconstrained unless they are involved in directing functional specificity. Many of these unconstrained sites may form part of a general protein–protein interface, but active sites directing specificity are generally conserved~Grishin & Phil-lips, 1994!.
Sites identified in MKK306, MKK4, and MKK7
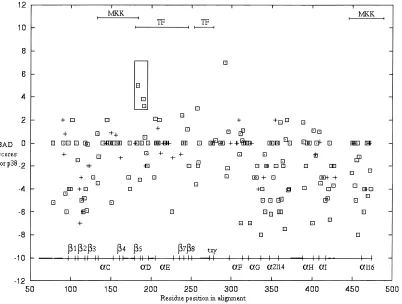
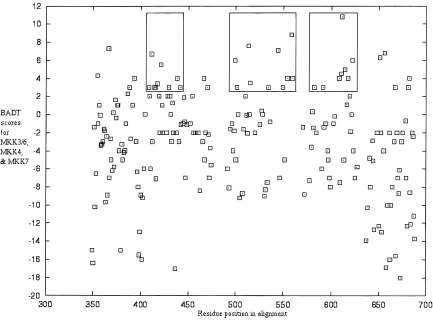
[image:8.612.111.513.60.364.2]The average accuracy for predicted ancestral sequences MKK39, MKK49, MKK79, and their common ancestor was 0.7 in all cases. The individual BAD scores for each MKK subfamily~see Supple-mentary material in Electronic Appendix! were difficult to inter-pret as the common ancestor ~2K9! has given rise to three subfamilies. The majority of the high BAD scores is found in the MKK7 subfamily~data not shown!, which has undergone accel-erated evolution in the same period as its downstream JNK. MKK4, which can also activate JNK, has some high BAD scores~data not shown!. The MKK306 subfamily has few high BAD scores, and like its downstream p38, more closely resembles the MKK that existed in the ancestral stress pathway~data not shown!. Other-wise, the patterns of BAD score distribution along the primary sequences of MKK7, MKK4, and MKK306 are too complex to interpret. These are most easily summarized by considering the Fig. 6. Prediction of regions that have evolved functional differences in p38 since its duplication from the 1k0ancestor. Burst after duplication~BAD!scores for the p38 subfamily are plotted on the vertical axis, and the graph is plotted similar to Figure 3.▫{indicates that the site is exposed, and1indicates that the site is buried in the structure. The same region corresponding to experimentally important in Figure 3 is distinguished by a highly significant p-value~p50.000!.
totals for the three ~Fig. 9!. A region between 403 and 640 is distinguished in having high scores with few negative scores. This pattern resembles that observed in Figure 3 for experimentally important regions in ERK and p38. Region 375– 688 of the MKK alignment aligns to the ERK-p38 alignment~93– 419!. The exper-imentally important region in the ERK0p38 data set ~134–275! corresponds to positions 416–554 in the MKK alignment. Thus, there is a degree of overlap in these observed patterns for MAPKs and MKKs. If we were to extrapolate from the MAPK model, we might suppose that this region is important for functional differ-ences that direct upstream and downstream interactions. To date, groups have focused on the N-terminal deletions and insertions that are only found in the MKK subfamily members. The first 43 to 45 residues that are unique but not conserved in MKK4~thus, not included in analysis!have been suggested to interact with JNK, p38, as well as upstream MEKK1~Xia et al., 1998!. Similarly, an N-terminal region unique~but not conserved!in MKK7 members has been shown to interact with JNK~Tournier et al., 1999!.
Discussion
The observation that the same or overlapping region of protein, corresponding to the putative substrate and upstream kinase bind-ing sites, is distbind-inguished when each of three protein data sets are investigated~p380ERK, JNK0p38, MKK3060407!is of great in-terest. In the case of the MKK3060407 data, the region of overlap is not exact, and there has been no experimental analysis carried
out on this region of the protein. Our results suggest that a high BADT score alone for a single residue does not in itself correctly predict a site involved in pathway specificity. However, a residue with a high BADT value that is also found in a region highly conserved for the entire family is likely to be important. This is consistent with the idea that critical sites remain highly conserved among subfamilies with the exception of those residues that pro-vide subfamily specificity. We have identified several of these sites that belong to regions or structural elements thought to direct p380ERK specificity~see Results!. The derived statistics for each protein are not entirely independent, because they are based to some extent on common evolutionary events. However, they are intended to distinguish events on independent lines. We believe the correlation is not merely due to the possible statistical dependence of these separate analyses, but actually reflects a biologically in-teresting region that is conserved except when the substrate, or possibly the activator specificity of the protein, undergoes a marked change associated with gene duplication and functional diver-gence. One of the lines of evidence favoring this interpretation is that the BAD scores for individual proteins are not in themselves highly correlated ~e.g., JNK and p38 BAD scores only have a correlation of 0.2!, yet the identified structural regions overlap strongly.
[image:9.612.98.509.59.363.2]To date, groups have focused primarily on functional differences between ERK and p38~Brunet & Pouyssegur, 1996; Jiang et al., 1997; Horiuchi et al., 1998; Wilsbacher et al., 1999!. However, the more recent gene duplications giving rise to p38 and JNK along Fig. 7. Prediction of regions conferring functional differences between JNK and p38. The burst after duplication~BAD!scores for JNK and p38 are summed to give a BAD total~BADT!and are plotted on the vertical axis. The graph is plotted similar to Figure 3. The same region corresponding to experimentally important in Figure 3 is distinguished by a highly significant p-value~p50.000!.
Table 2. Relationships between evolutionary change in physicochemical properties and structural function for selected residues across JNK (top) and p38 (bottom)a
Position
Ancestor
residues Hydrophobic Polar Small Proline Tiny Aliphatic Aromatic 1 2 Charged a Loop b Hydrogen bonds Exposed
K121 154 ErK 1 * 1 2 * • 426 247 •
E81 154 ErE * * * • 217 247 •
E147 183 ErE * * * • 247 •
H107 183 ErH 1 * 1 1 2 * • 120 185 •
C154 190 HrC * 2 1 2 2 2 • 188 194 235 •
N114 190 HrN 2 * 1 2 2 2 • 188 192 193 194 •
Q155 191 KrQ 2 * 2 2 • •
N115 191 KrN 2 * 1 2 2 • •
H163 205 NrH 1 * 2 1 1 1 • 188 189
D124 205 NrD * * 1 1 • 207 208 209 388 417 •
V196 238 VrV * * * • 247
A157 238 VrA * * 1 2 • 247 •
K198 240 NrK 1 * 2 1 1 • 243 244 245 •
N159 240 NrN * * • 243 244 245 •
T202 245 DrT 1 * * 2 2 • 240 243 •
E163 245 DrE * 2 * * • 240 243 •
P222 274 GrP 2 * 1 2 • •
G181 274 GrG * * * • 276 279 •
G237 289 NrG 1 2 * 1 • •
N196 289 NrN * * • 285 286 •
G239 292 GrG * * * • •
H199 292 GrH * 1 2 2 1 1 1 • •
JNK total 7 2 3 1 2 0 2 5 2 5
P38 total 3 1 4 0 2 1 3 4 2 4
aSites correspond to those with a BADT of 4 or greater in the boxed regions of Figure 7 and are presented as described in Table 1.
664
D.R.
Caffr
ey
et
with their upstream activators have not been considered. It is likely that p38, ERK, and JNK have similar binding interfaces. However, residues conferring functional differences between p38 and ERK are unlikely to be the same ones contributing to differences
be-tween JNK and p38. Thus, the evolutionary events leading to these kinases should be taken into account.
[image:11.612.111.499.54.600.2]It is possible that some of the high BADT values are more important in structural folding and stability rather than directly Fig. 8. JNK, ERK, and p38 are aligned as in alignments used for ancestral analysis. Uppercase5buried, lowercase5exposed,a5 alpha helix,b5beta strand, 353–10 helix, bold5hydrogen bond to main chain amide, underline5hydrogen bond to main-chain carbonyl, italic5positive phi, tilde5hydrogen bond to the other side chain. Residue positions in brackets refer to the structural positions, and alignment positions used in the ancestral analysis are given above the sequence. The approximate position of subdomains is given above the sequence also. Residues disordered in the JNK3 structure are in a smaller font. Sites that have a BADT of four or more for the p380ERK or p380JNK comparison are boxed.
participating in protein–protein interactions. Given that the major-ity of high BADT values were exposed, it is unlikely that they are more important in correct folding. It is also likely that residues that are both exposed and conserved within a subfamily are likely to direct a specific activity rather than contributing to part of the generic protein–protein interface. Some groups of residues de-scribed in Tables 1 and 2 often interact with each other. It is not clear if these are simply compensatory changes~Neher, 1994!, or if they play a more direct role in protein–protein interactions. In Table 1, there are several residues in and arounda-helix c that have undergone significant changes. It is unlikely that these are just compensatory changes, as this region of p38 and ERK do not superpose very well, suggesting that overall protein shape is af-fected~Wang et al., 1997!. Other residues described do not interact with other sites having a high BADT, and occasionally interact with residues that are quite distant in primary structure but not in tertiary structure. Until structures are available for the interacting proteins, it is difficult to speculate on their function in protein– protein interactions. It will be of interest to determine whether the evolution of novel protein–protein interactions is dominated by individual isolated residues making contacts between proteins, by alterations in structural conformation~such asa-helix C!that cre-ate larger scale changes in the interacting surface, or if both of the Table 3. The relationship between BADT values
and exposed0buried for JNK and p38
Protein BADT Exposed Buried Total
p38
BADT. 54 18 1 19
4.BADT. 53 11 4 15
3.BADT. 51 25 8 33
1.BADT. 21 75 62 137
21. 5BADT. 23 15 10 25
23. 5BADT. 24 11 5 16
24. 5BADT 57 7 64
Totals 212 97 309
JNK
BADT. 54 15 4 19
4.BADT. 53 8 6 14
3.BADT. 51 20 12 32
1.BADT. 21 63 71 134
21. 5BADT. 23 15 9 24
3. 5BADT. 24 11 5 16
24. 5BADT 57 6 63
[image:12.612.93.526.374.694.2]Totals 189 113 302
Fig. 9. Prediction of regions conferring functional differences between MKK7, MKK4, and MKK306. The burst after duplication ~BAD!scores for MKK7, MKK4, and MKK306 are summed to give a BAD total~BADT!and are plotted on the vertical axis. The graph is plotted similar to Figure 3.
above contribute equally. Figure 10 maps residues with a high BADT~for p38 and ERK!to the regions that direct pathway spec-ificity. There is no clear pattern to the distribution of residues in the three-dimensional space, although they tend to surround the cleft that lies between the N-terminal domain ~composed largely of
b-sheets!and C-terminal domain~composed largely ofa-sheets!. This cleft contains the ATP binding site and is fairly conserved for most kinases. Sites highlighted ona-helix d anda-helix e are of interest, as the corresponding helices contribute to substrate inter-faces for cAPK~Knighton et al., 1991! and twitchin~Hu et al., 1994!where structural information is available.
Other methods have also been designed to address similar ques-tions using primary sequence information alone. Pollock et al.
~1999!used tree information to help identify coevolving or corre-lated sites in myoglobin sequences that might be close in three-dimensional structure or share functional similarities. A similar approach that relies on predicted ancestral residues has also been employed~Shindyalov et al., 1994!. Correlated mutations have also been used to try and predict residues involved in protein–protein in-teractions~Pazos et al., 1997!. The challenge is to combine these different methods and the alternative perspective presented here into a unified approach that can provide multiple models of protein func-tion and interacfunc-tion with appropriate means to test their validity.
Materials and methods
Multiple alignment and prediction of ancestral sequences
Three data sets ~Table 4! were aligned using the CLUSTALX package~Thompson et al., 1997!. The ERK0p38 group was
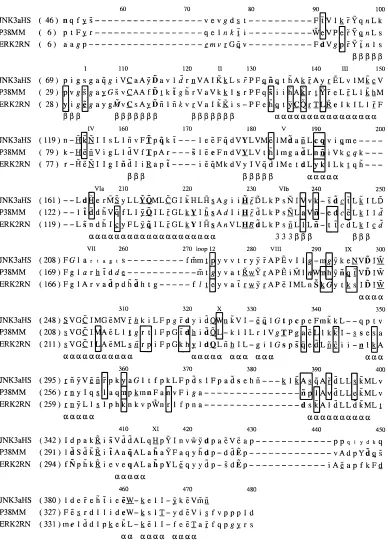
in-vestigated first, as most mutagenesis work on the MAPK family has been achieved by constructing p38 and ERK chimeras. The other two data sets were used to analyze the evolution of the JNK and p38 pathways at the MAPK and upstream MKK level. Each data set has at least one outgroup that provides additional infor-mation for prediction of ancestral sequences. All alignments were carefully edited using seaview~Galtier et al., 1996!. Tree structures were determined by the neighbor joining method~Saitou & Nei, 1987!. The trees were tested by bootstrap analysis ~1,000 repli-cates!, and all branches had a bootstrap support of 60% or greater. The unrooted tree structure and present day sequences were pro-vided as input for the ANCESTOR program~Zhang & Nei, 1997!. All Ancestral sequences were derived from the MAPK and MEK alignments using the distance method computed by the ANCES-TOR program~Zhang & Nei, 1997!. The ANCESTOR program requires a predetermined tree topology but estimates branch lengths using the least-squares method before calculating the ancestral sequence by a posterior probability method. ANCESTOR outper-forms parsimony techniques and gives similar results to maximum likelihood and other bayesian methods~Zhang & Nei, 1997!. AN-CESTOR does not account for multiple amino acid replacement, and this may be a caveat associated with the prediction of the deeper ancestral nodes. In other words, the method predicts prob-abilities that particular amino acids are ancestral, but assumes that the ancestral residue is found in at least one of the present-day descendents. ANCESTOR does not predict ancestral residues for gapped positions. The addition of outgroups to the MAPK and MEK alignments introduced the occasional gap. The ancestral se-quences that correspond to the nodes outlined in Figure 2 were identified. The key ancestral sequences were aligned to the present-day sequences. Consistent with Figure 2, the common family an-cestral sequences leading to the JNK0p38 pathway components are called 1K9 and 2K9, while the subfamily ancestor sequences are called JNK9, p389, MKK39, MKK49, and MKK79. In the case of the ERK and p38 data set, the common ancestor is called 1K0, and the subfamily ancestors are called p389and ERK9. The multiple align-ments are available from our website at http:00acer.gen.tcd.ie0
;dcaffrey0sapk0.
Calculation of burst after duplication (BAD) scores
The general approach is to compare changes in physicochemical properties for each residue position along certain evolutionary branches with those changes on other branches. This is achieved by predicting the most likely ancestral residues and their associ-ated probabilities at each ancestral node within the tree. Clearly, the method requires accurate alignment and reasonably accurate estimation of tree topology and branch lengths. Specifically, we calculate an AC~ancestral conservation!score for each protein in turn by comparing the changes in physicochemical properties be-tween the duplication node and the node, which is ancestral to the orthologous subfamily sequences. Then, for each protein an RC
~recent conservation! score is calculated comparing the ortho-logues with their subfamily ancestor. The difference of these scores defines the burst after duplication score, BAD5RC2AC. For purposes of predicting what residue positions confer functional differences between subfamilies, the BAD for each protein can be summed to give a BAD total~BADT!.
Conservation of physicochemical properties is calculated from a property index~Zvelebil et al., 1987!. The number of differences in amino acid properties~where the properties are defined as hy-Fig. 10. Catrace of the p38 structure~Guex & Peitsch, 1996!. The
glycine-rich phosphate anchor loop is in yellow, and the region defined as exper-imentally important for pathway specificity is in green. Sites within the region important for pathway specificity between p38 and ERK are colored purple~BADT$3!and red~BADT$4!. Some of the main secondary structural elements are also labeled.
[image:13.612.61.289.61.313.2]drophobicity, polarity, small, proline, tiny, aliphatic, aromatic, pos-itive, negative, charged!are subtracted from 9. Thus, the lower the conservation number, the greater number of differences in phys-icochemical properties. In the case of 100% identity, a conserva-tion number is set equal to 10, but is equal to 9 when residues are not identical but share the same properties. As an arbitrary guide, a conservation number above 7 indicates strong conservation of physicochemical properties, while a conservation number below 7 represents a significant change in physicochemical properties.
However, ancestral residues are not always predicted with high confidence at all sites. Therefore, it was necessary to incorporate the probability of a particular residue occurring at the ancestral node. The probabilities of each residue P~ancestor residue! was determined from the ANCESTOR program, and an example with multiple probabilities at the gene duplication site is given in Fig-ure 11. Equation 1 describes the summing of all possible ACs
[image:14.612.91.527.76.584.2]~incorporating their probabilities!for all possible candidate ances-tral residues to give a final corrected AC:
Table 4. Sequences used in analysis
Tree abbreviation Protein name~s! Species Accession no.
ERK0p38 tree
JNK1_HS JNK10SAPK1 Homo sapiens SP P45983
JNK_DM JNK Drosophila melanogaster GB U73196
P38_DM p38 Drosophila melanogaster GB U86867
P38A_HS p38a0SAPK2a Homo sapiens SP Q16539
STY1_SP STY10SPC1 Schizosaccharomyces pombe SP Q09892
HOG1_SC HOG1 Saccharomyces cerevisiae SP P32485
ERK1_HS ERK1 Homo sapiens SP P27361
ERK2_HS ERK2 Homo sapiens SP P28482
SUR1_CE SUR1 Caenorhabditis elegans SP P39745
SPK1_SP SPK1 Schizosaccharomyces pombe SP P27638
KSS1_SC KSS1 Saccharomyces cerevisiae SP P14681
ERK1_CA ERK1 Candida albicans SP P28869
CDC2_OS CDC2 Oryza sativa SP P45984
JNK0p38 tree
JNK3_RN JNK30SAPK3 Rattus norvegicus SP P49187
JNK1_HS JNK0SAPK1 Homo sapiens SP P45983
JNK_CC JNKA Cyprinus carpio GB D83273
JNK2_HS JNK2 Homo sapiens SP P45984
JNK_DM JNK Drosophila melanogaster GB U73196
P38_DM p38 Drosophila melanogaster GB U86867
P38_MM p38 Mus musculus SP P47811
P38_XLM PK2 Xenopus laevis SP P47812
P38_CC p38 Cyprinus carpio SP Q90336
P38A_HS p38a0SAPK2a Homo sapiens SP Q16539
STY1_SP STY10SPC1 Schizosaccharomyces pombe SP Q09892
HOG1_CA HOG1 Candida albicans SP Q92207
HOG1_SC HOG1 Saccharomyces cerevisiae SP P32485
HOG1_ZR Zhog1p Zygosaccharomyces rouxii GB AB012146
HOG2_ZR Zhog2p Zygosaccharomyces rouxii GB AB012088
ERK1_HS ERK1 Homo sapiens SP P27361
MKK tree
PBS2_SC PBS2 Saccharomyces cerevisiae SP P08018
STE7_SC STE7 Saccharomyces cerevisiae SP P06784
WIS1_SP WIS1 Schizosaccharomyces pombe SP P33886
MEK2_XL MEK2 Xenopus laevis SP Q07192
MKK4_DM MKK4 Drosophila melanogaster GB AF035552
MKK4_MM SEK10MKK4 Mus musculus SP P47809
MKK4_HS SEK10MKK4 Homo sapiens SP P45985
MKK6_MM SKK30MKK6 Mus musculus SP P70236
MKK6_HS SKK30MKK6 Homo sapiens SP P52564
MKK3_HS MEK30SKK2 Homo sapiens SP P46734
MKK3_MM MEK30SKK2 Mus musculus SP O09110
MKK3_DM MKK3 Drosophila melanogaster GB AF035549
MKK7_HS MKK70JNKK2 Homo sapiens GB AF022805
HEP_DM HEP0HEM Drosophila melanogaster SP Q23977
aThe JNK0p38 and MKK groups were used in the analysis of the JNK and p38 pathways. The ERK0p38 tree was used to validate the method for prediction of sites important for kinase pathway specificity. The trees for these groups are shown in Figure 2.
Corrected AC5
(
Candidate family ancestor residue(
Candidate subfamily ancestor residueP~Family ancestor residue!
*P~Subfamily ancestor residue!*AC. ~1! Equation 2 similarly describes the summing of all possible RCs to give a final corrected RC:
Corrected RC5
(
Candidate subfamily ancestorresidue
P~Subfamily ancestor residue!*RC. ~2!
From Figure 11 and Equation 1, AC_JNK5@~N50.334*C51* AC57!1~H50.586*C51*AC54!1~Y50.08*C51*AC56!#5 5.2. From Figure 11 and Equation 2, RC_JNK5@~C51*RC510!#5 10. In this case, there is only one possible subfamily ancestor residue and BAD_JNK51025.25 4.8. Along the p38 branch, AC_p38 5 @~N50.334*N51*AC510! 1 ~H50.586*N51* AC54! 1 ~Y50.08*N51*AC56!# 5 6.2, RC_p385 @N51* RC510#510, BAD_p3851026.253.8. To assess the site as a whole, all BAD values are summed to give a BADT58. Both subfamilies have undergone a rapid burst of evolution after dupli-cation that is then followed by high conservation.
Calculation of subfamily scores (SS) that ignore ancestral nodes
For comparison, we also the calculated the conservation num-bers of the present-day sequences alone as proposed by Living-stone and Barton ~1993!, which uses the same property index. At each residue position, a conservation number was calculated for each subfamily within the tree and compared with the con-servation number for all sequences in the family. In the exam-ples analyzed here, subfamily refers to the single clade of orthologues, and “family” refers to all the subfamilies being compared, rather than the entire kinase protein family. We will refer to these as the subfamily conservation number ~SC! and the family conservation number ~FC!, respectively. It was pro-posed that subfamilies that had a high SC, but a lower FC
would be of interest in predicting sites that are involved in sub-strate specificity for a given subfamily ~Livingstone & Barton, 1993!. To identify such sites, we subtracted the family conser-vation number from each of the subfamily conserconser-vation numbers
~SC-FC!to yield a subfamily score~SS!. The residue position as a whole is also assessed by summing SS for both subfamilies, as it is possible that only one of the two subfamilies concerned is highly conserved. This will be referred to as the SS total
~SST!.
The BAD and SS values differ in a few ways. The former selects for residue positions that have undergone significant evolutionary changes within a set period of time but are subsequently conserved to a high degree. Using the property index described of Zvelebil et al., an AC will range between 2~His, Pro! and 10, while RC ranges between 0 and 10. In contrast, SS describes the number of properties that a given subfamily differs from another subfamily at a given residue position. SS will range between 0 and 10. In both cases, the score across the protein will be influenced by both the relative amount of evolutionary time on the ancestral branch, and by the total number of orthologous sequences included from dif-ferent species.
Analysis of BADT and SST predictions vs. experimental evidence
The majority of mutagenesis and chimera studies defining re-gions conferring functional specificity in kinases involve p38 and ERK. Experimental studies for p38 and ERK were exam-ined before assigning BADT and SST sites as either important or unimportant in specificity~Brunet & Pouyssegur, 1996; Jiang et al., 1997; Horiuchi et al., 1998; Wilsbacher et al., 1999!. In the majority of cases, an entire region rather than a particular residue was designated important, as very few studies have ex-amined or found individual residues to be important. Therefore, it is likely that some residues have been incorrectly designated important, but despite our crude designation of a site, it was hoped that the information would aid in evaluating the method. All residue positions that were identical for both ERK and p38
~FC 510! were not included in the analysis, as they are non-informative, and it is safe to assume that they are not important for specificity. Loop 16 has been implicated in pathway speci-ficity ~Wilsbacher et al., 1999!, but this region could not be aligned to a suitable outgroup ~which is required for prediction of ancestral residues!. Wilsbacher et al. also refer to unpublished data whereby the MAPK insert was deleted from ERK and was no longer activated by its upstream MEK. However, they have not shown that insertion of the MAPK insert ~from ERK! into p38 allows it to be activated by ERKs upstream MEK. Thus, it is possible that the ERK deletion has simply folded incorrectly, and so we did not designate this region important. The BADT and SST scores were plotted along the alignment for sites ex-perimentally implicated and not implicated in pathway specific-ity. Differences between the distributions of BADT scores for experimentally important and other residues were assessed by the Kolmogorov–Smirnov two sample test, with corrected p val-ues estimated using the STATA statistical package, version 5
[image:15.612.68.285.62.205.2]~StataCorp, 1997!. This is not very sensitive to residues with markedly extreme values and is correspondingly more sensitive to broad differences in the means and central spread of the distributions. It is fairly accurate in detecting clusters in a data set.
Fig. 11. Example of ancestral residues with multiple probabilities for a site. The site is an example of a burst of evolution after duplication fol-lowed by high conservation within subfamilies.
Solvent accessibility
The atomic structures of mouse p38~1p38!, rat ERK2,~1ERK!, and human JNK3a ~1JNK! were fetched from the Protein Data Bank~Zhang et al., 1994; Wang et al., 1997; Xie et al., 1998!. The solvent accessibility of each residue was determined using JOY
~Mizuguchi et al., 1998!, which implements the algorithm of Lee and Richards ~Lee, 1971!. Residue positions were assigned as exposed~lowercase!or buried~uppercase!for JNK and p38 and compared with the BADT values.
Supplementary material in Electronic Appendix
The multiple alignments of extant and ancestral sequences are provided in CLUSTAL format as supplementary material. The BAD and BADT scores for all data sets are included. This infor-mation is also available from our website at http:00acer.gen.tcd.ie0
;dcaffrey0sapk0.
Acknowledgments
This work was supported by Enterprise Ireland basic research grant SC0 970265 and by the Higher Education Authority of Ireland.
References
Brunet A, Pouyssegur J. 1996. Identification of MAP kinase domains by re-directing stress signals into growth factor responses. Science 272:1652–1655. Caffrey DR, O’Neill LAJ, Shields DC. 1999. The evolution of the MAP kinase pathways: Coduplication of interacting proteins leads to new signaling cas-cades. J Mol Evol 49:567–582.
Cobb MH, Goldsmith EJ. 1995. How MAP kinases are regulated. J Biol Chem 270:14843–14846.
Dong C, Yang DD, Wysk M, Whitmarsh AJ, Davis RJ, Flavell RA. 1998. Defective T cell differentiation in the absence of Jnk1. Science 282: 2092–2095.
Galtier N, Gouy M, Gautier C. 1996. SEAVIEW and PHYLO_WIN: Two graphic tools for sequence alignment and molecular phylogeny. Comput Appl Biosci 12:543–548.
Ganiatsas S, Kwee L, Fujiwara Y, Perkins A, Ikeda T, Labow MA, Zon LI. 1998. SEK1 deficiency reveals mitogen-activated protein kinase cascade cross-regulation and leads to abnormal hepatogenesis. Proc Natl Acad Sci USA 95:6881– 6886.
Grishin NV, Phillips MA. 1994. The subunit interfaces of oligomeric enzymes are conserved to a similar extent to the overall protein sequences. Protein Sci 3:2455–2458.
Guex N, Peitsch MC. 1996. Swiss-PdbViewer: A fast and easy-to-use PDB viewer for Macintosh and PC. Protein Data Bank Q Newslett 77:7. Gupta S, Barrett T, Whitmarsh AJ, Cavanagh J, Sluss HK, Derijard B, Davis RJ.
1996. Selective interaction of JNK protein kinase isoforms with transcrip-tion factors. EMBO J 15:2760–2770.
Han ZS, Enslen H, Hu X, Meng X, Wu IH, Barrett T, Davis RJ, Ip YT. 1998. A conserved p38 mitogen-activated protein kinase pathway regulates Dro-sophila immunity gene expression. Mol Cell Biol 18:3527–3539. Horiuchi KY, Scherle PA, Trzaskos JM, Copeland RA. 1998. Competitive
in-hibition of MAP kinase activation by a peptide representing the alpha C helix of ERK. Biochemistry 37:8879–8885.
Hu SH, Parker MW, Lei JY, Wilce MC, Benian GM, Kemp BE. 1994. Insights into autoregulation from the crystal structure of twitchin kinase. Nature 369:581–584.
Ip YT, Davis RJ. 1998. Signal transduction by the c-Jun N-terminal kinase ~JNK!—From inflammation to development. Curr Opin Cell Biol 10:205– 219.
Jiang Y, Li Z, Schwarz EM, Lin A, Guan K, Ulevitch RJ, Han J. 1997. Structure– function studies of p38 mitogen-activated protein kinase. Loop 12 influ-ences substrate specificity and autophosphorylation, but not upstream kinase selection. J Biol Chem 272:11096–11102.
Kallunki T, Su B, Tsigelny I, Sluss HK, Derijard B, Moore G, Davis R, Karin M. 1994. JNK2 contains a specificity-determining region responsible for efficient c-Jun binding and phosphorylation. Genes Dev 8:2996–3007. Knighton DR, Zheng JH, Ten Eyck LF, Xuong NH, Taylor SS, Sowadski JM.
1991. Structure of a peptide inhibitor bound to the catalytic subunit of cyclic adenosine monophosphate-dependent protein kinase. Science 253:414– 420. Lee BRF. 1971. The interpretation of protein structures: Estimation of static
accessibility. J Mol Biol 55:379– 400.
Livingstone C, Patel G, Jones N. 1995. ATF-2 contains a phosphorylation-dependent transcriptional activation domain. EMBO J 14:1785–1797. Livingstone CD, Barton GJ. 1993. Protein sequence alignments: A strategy for
the hierarchical analysis of residue conservation. Comput Appl Biosci 9:745–756.
Lu HT, Yang DD, Wysk M, Gatti E, Mellman I, Davis RJ, Flavell RA. 1999. Defective IL-12 production in mitogen-activated protein~MAP!kinase ki-nase 3~Mkk3!-deficient mice. EMBO J 18:1845–1857.
Mizuguchi K, Deane CM, Blundell TL, Johnson MS, Overington JP. 1998. JOY: Protein sequence–structure representation and analysis. Bioinformatics 14:617– 623.
Moriguchi T, Toyoshima F, Masuyama N, Hanafusa H, Gotoh Y, Nishida E. 1997. A novel SAPK0JNK kinase, MKK7, stimulated by TNFalpha and cellular stresses. EMBO J 16:7045–7053.
Neher E. 1994. How frequent are correlated changes in families of protein sequences? Proc Natl Acad Sci USA 91:98–102.
Nishina H, Vaz C, Billia P, Nghiem M, Sasaki T, De la Pompa JL, Furlonger K, Paige C, Hui C, Fischer KD, et al. 1999. Defective liver formation and liver cell apoptosis in mice lacking the stress signaling kinase SEK10MKK4. Development 126:505–516.
Pazos F, Helmer-Citterich M, Ausiello G, Valencia A. 1997. Correlated muta-tions contain information about protein–protein interaction. J Mol Biol 271:511–523.
Pollock DD, Taylor WR, Goldman N. 1999. Coevolving protein residues: Max-imum likelihood identification and relationship to structure. J Mol Biol 287:187–198.
Raingeaud J, Gupta S, Rogers JS, Dickens M, Han J, Ulevitch RJ, Davis RJ. 1995. Pro-inflammatory cytokines and environmental stress cause p38 mitogen-activated protein kinase activation by dual phosphorylation on ty-rosine and threonine. J Biol Chem 270:7420–7426.
Raingeaud J, Whitmarsh AJ, Barrett T, Derijard B, Davis RJ. 1996. MKK3- and MKK6-regulated gene expression is mediated by the p38 mitogen-activated protein kinase signal transduction pathway. Mol Cell Biol 16:1247–1255. Saitou N, Nei M. 1987. The neighbor-joining method: A new method for
re-constructing phylogenetic trees. Mol Biol Evol 4:406– 425.
Shindyalov IN, Kolchanov NA, Sander C. 1994. Can three-dimensional contacts in protein structures be predicted by analysis of correlated mutations? Pro-tein Eng 7:349–358.
Sluss HK, Han Z, Barrett T, Davis RJ, Ip YT. 1996. A JNK signal transduction pathway that mediates morphogenesis and an immune response in Drosoph-ila. Genes Dev 10:2745–2758.
StataCorp. 1997. Stata statistical software. College Station, Texas.
Thompson JD, Gibson TJ, Plewniak F, Jeanmougin F, Higgins DG. 1997. The CLUSTAL:X windows interface: Flexible strategies for multiple sequence alignment aided by quality analysis tools. Nucleic Acids Res 25:4876– 4882. Tournier CW, Cavanagh AJ, Barrett T, Davis RJ. 1999. The MKK7 gene encodes a group of c-jun NH2-terminal kinase kinases. Mol Cell Biol 19:1569–1581. Treisman R. 1996. Regulation of transcription by MAP kinase cascades. Curr
Opin Cell Biol 8:205–215.
Wang XZ, Ron D. 1996. Stress-induced phosphorylation and activation of the transcription factor CHOP~GADD153! by p38 MAP Kinase. Science 272:1347–1349.
Wang Z, Harkins PC, Ulevitch RJ, Han J, Cobb MH, Goldsmith EJ. 1997. The structure of mitogen-activated protein kinase p38 at 2.1-A resolution. Proc Natl Acad Sci USA 94:2327–2332.
Whitmarsh AJ, Davis RJ. 1998. Structural organization of MAP-kinase signaling modules by scaffold proteins in yeast and mammals. Trends Biochem Sci 23:1481–1485.
Wilsbacher JL, Goldsmith EJ, Cobb MH. 1999. Phosphorylation of MAP ki-nases by MAP0ERK involves multiple regions of MAP kinases. J Biol Chem 274:16988–16994.
Xia Y, Wu Z, Su B, Murray B, Karin M. 1998. JNKK1 organizes a MAP kinase module through specific and sequential interactions with upstream and down-stream components mediated by its amino-terminal extension. Genes Dev 12:3369–3381.
Xie X, Gu Y, Fox T, Coll JT, Fleming M. 1998. Crystal structure of Jnk3: A kinase implicated in neuronal apoptosis. Structure 6:983–991.
Zhang F, Strand A, Robbins D, Cobb MH, Goldsmith EJ. 1994. Atomic structure of the MAP kinase ERK2 at 2.3 A resolution. Nature 367:704–711. Zhang J, Nei M. 1997. Accuracies of ancestral amino acid sequences inferred by
the parsimony, likelihood, and distance methods. J Mol Evol 44:S139–S146. Zvelebil MJ, Barton GJ, Taylor WR, Sternberg MJ. 1987. Prediction of protein secondary structure and active sites using the alignment of homologous sequences. J Mol Biol 195:957–961.