Biofiltration of Nitrous Oxide Using Cow-Manure Based
Compost as Medium Filter
Tania Surya Utami, Heri Hermansyah, Mohamad Nasikin
Department of Chemical Engineering, Faculty of Engineering, Universitas Indonesia, Depok, Indonesia. Email: [email protected]
Received February 7th,2012; revised March 6th, 2012; accepted April 9th, 2012
ABSTRACT
Nitrous oxide (N2O) gas is a fourth contributor in the greenhouse effect after CO2, CH4, and water vapor. Although its
concentration is relatively low, but very difficult to be decomposed in the atmosphere. A laboratory-scale biofilter was used to evaluate the effects of flow rate, medium depth, and water content of filter medium on the N2O removal
effi-ciency and the growth of microorganisms in the compost. The biofilter was operated using cow-manure based compost medium with husk and coco peat as bulking agent. Research was carried out by batch flow system for 9 hours. The re-sult indicates that the highest N2O removal efficiency is obtained under flow rate of 88 cm3/min with a depth of 50 cm
and water content 50% (w/w) by 61%, and elimination capacity for 14,078 g/(m3·h) was achieved.
Keywords: Biofilter; Compost; Cow-Manure; Nitrous Oxide; Removal Efficiency
1. Introduction
Global warming will be followed climate change marked by increasing rainfall in some parts of the earth, while other parts have a prolonged dry season. This happens because there are changes in temperature and rainfall that occur gradually within a period of decades. One of the six types of gases that are classified as greenhouse gas in the UN Convention on Climate Change (United Nations Framework Convention on Climate Change—UNFCCC) is N2O gas. N2O gas is a fourth contributor in the
green-house effect after CO2, CH4, and water vapor. Although
the concentration is relatively low, but very difficult to decompose N2O in the atmosphere. N2O gas also has
global warming potential index 310 times per unit weight is greater than CO2.
According to the Intergovernmental Panel on Climate Change (IPCC), in atmospheric N2O concentration
crease of 46 ppb (17%) since 1750 and continues to in-crease [1]. Increasing is caused by N2O can be generated
from natural processes and human activities. Naturally, N2O is produced from a large number of microbial
ac-tivities in soil and water. Agricultural acac-tivities such as animal waste management and soil enrichment contrib-uted 86% of the total emissions of N2O produced. Farm
and industrial sectors such as the production of nylon, adipic acid, nitric acid and the burning of fuel in internal combustion engines also produce N2O.
Biofiltration has gained widespread support as an
ex-haust gas control technology that is economical to treat waste gas streams containing low concentrations of vola-tile organic and inorganic compounds [2]. Biofiltration involving immobilized microorganisms in the form of biofilms in porous media filter. Exhaust gas is transferred from the air flow into the biofilms that grow on the filter medium and will be degraded by microorganisms. The biofilter appears promising because it works by draining the contaminated air flow through a porous medium in which contaminants in the air flow are adsorbed by biofilms; these contaminants are oxidized to produce biomass, CO2, H2O, nitrate (NO3), and sulfate (SO24).
In addition, the biofilter supports the growth of microor-ganisms present in the porous medium [3]; it has also been successfully used to eliminate odors and volatile organic compounds (VOC) such as benzene [4], styrene [5], phenol [6], and alkenes [7] from various industrial processes.
medium capable of producing high reduction efficiency. Reference [11] investigated the concentrations of NO and O2, the column height, flow rate, the existence of an
ex-ternal carbon source on NO biofiltration using a mixture of the filter medium of compost and sawdust, and gain efficiency of NO reduction by 99%. In this research, a laboratory-scale biofilter was used to evaluate the effects of flow rate, medium depth, and water content of cow- manure based compost as filter medium on the N2O
re-moval efficiency and the growth of microorganisms in the compost.
2. Materials and Methods
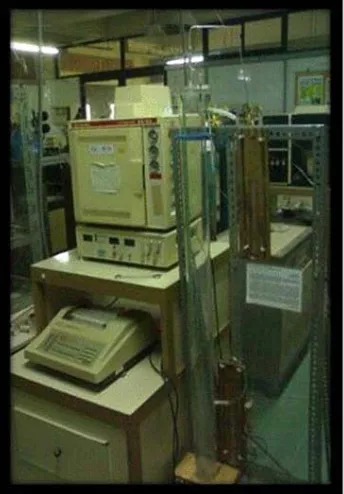
Biofilter equipment used in this research is made of acrylic material with a high dimensional column 120 cm, outside diameter 8 cm, and 7.35 cm inside diameter. Ma-terials are selected in order to prevent leakage effectively as possible [11]. Meanwhile, piping and junctions in the biofilter system is made of stainless steel which has a minimum connection. Schematic diagram of biofilter used in this research is shown in Figure 1.
Filter medium used is compost. Compost is used comes
Figure 1. Biofilter column.
Biofiltration experiment was conducted for 9 hours with continue flow system in order to evaluate the effects of flow rate, medium depth, and water content of filter medium on the N2O removal efficiency and the growth
of microorganisms in the compost. Medium filter is one important factor affecting the performance of biofilter. Filter medium is a place for the growth of biofilms and microbial that will do the degradation of pollutants.
Biofilter performance test is carried out through analy-sis of N2O gas that comes out of filter medium with TCD
gas chromatography (Shimadzu, Japan). Content of mi-crobes in the compost before and after biofiltration was tested by Total Plate Count (TPC) method. Surface mor-phology of compost medium analyzed by using Scanning Electron Microscope (SEM) 4000× magnification, type JEOL JSM-6390 with 20 kV acc volts, wd 12 mm, spol-size 30th, and SEI signals. Prior to SEM, samples were first coated by using platinum for 30 seconds at 30 mA current.
3. Results and Discussion
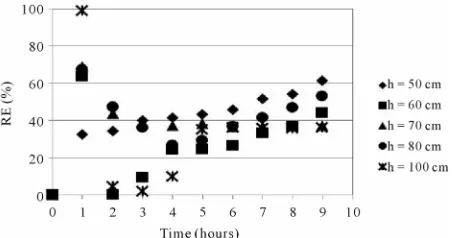
Figure 2 shows the N2O Removal Efficiency (RE) of
biofiltration for each flow rate. The N2O RE tends to
increase every hour, although this does not happen in 0 to 2 hours because at this time the N2O flowing in the
me-dium has not homogenous and produced unsteady condi-tions. It can be seen that the highest RE obtained in the 9 hours of biofiltration is reached in 103 cm3/min gas flow
rate with 70.1% N2O RE.
However, the selection of the optimal flow rate to pro-duce the highest RE is not only based on the results ob-tained in the 9 hours but also through observation of the RE profile that can generate steady condition. Reference [12] states that the emission of pollutant gases that often fluctuates can cause damage to the biofilter microbial population and the overall performance. Therefore, the optimum N2O gas flow rate chosen in this experiment is
88 cm3/min with RE 61.3%.
[image:2.595.87.259.468.715.2]Figure 2. N2O removal efficiency at various flow rate (h =
[image:3.595.57.286.85.204.2]49.7 cm, m = 945 g, filter medium = dry compost).
Figure 3. Elimination capacity in various inlet loading.
exceed the overall capacity of the overall elimination and RE is lower than 100%. This point is called the critical load or critical EC. In studies with this flow rate varia-tions, load value can’t be increased because the overall mass loads rate have exceeded the capacity of the overall elimination. Therefore, the RE obtained is lower than 100%.
N2O RE of each filters medium depth shown in Figure 4. The previous research results stated that the position of the higher column can produce a better reduction per-formance [11]. On the other hand, increasing the depth of the filter medium has the potential to create compaction in medium at the bottom of the column which can lead to the high pressure drop. High pressure drop indicates the resistance of N2O gas which makes the gas can not be
through the medium filter for degraded by microbes. N2O RE at 50 cm depth is higher when compared with
the RE at a higher depth. This can be explained by con-sidering Figure 4, where the time required by N2O to be
homogeneous in the biofilter column until it reaches steady state at 50 cm depth only 2 hours. Meanwhile, at a depth ≥ 60 cm the time required by N2O to be
homoge-neous is more than 4 hours. Therefore, in order to evalu-ate the N2O RE at medium depth ≥ 60 cm, may take
longer observation due to the time of N2O gas to reach a
[image:3.595.310.537.245.363.2]stable state.
Figure 5 shows profile of the reduction efficiency in water content of filter medium variation up to 9 hours. Addition of water content, aims to increase the humidity
Figure 4. N2O removal efficiency at various depths (filter
medium = dry compost).
Figure 5. N2O removal efficiency at various WC (h = 49.7
cm, m = 945 g, filter medium = wet compost).
of filter medium. Humidity is a critical factor in the ef-fectiveness of biofilter because the microorganisms re-quire water for metabolic activities. Humidity recom-mended for organic filter medium ranged between 40% - 60% (by weight) [13].
Higher humidity occur instability of N2O outlet
con-centration. RE in 60% and 70% humidity, reached up to 100% caused by N2O gas at outlet column was not
de-tected by gas chromatography. This occurs because the addition of the water making too much water in filter medium. This will prevent the transfer of oxygen and hydrophobic pollutants in biofilms, the emergence of anaerobic zones in the filter medium, inhibits the reaction rate, the back pressure due to decrease in empty space volume [12].
Its shows that through the addition water will tend to increase the N2O RE, but if additional water is too much,
then the efficiency will be reduced. Biofiltration operate most efficiently on water content (WC) of between 50% - 70% and temperatures between 15˚C and 35˚C [14]. In this research, the best RE obtained at water addition of 50% wt of compost.
[image:3.595.60.286.247.355.2]need food with balanced nutrition and a natural filter medium such as compost to provide nutrients to support the growth of microorganisms, while carbon and energy needed by the microorganisms can be derived from con-taminant gases. Concon-taminant transferred from flow of air into the biofilms that grow on the filter medium and be degraded by microorganisms.
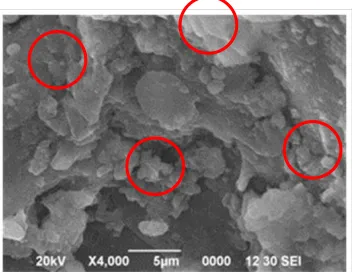
[image:4.595.85.262.501.637.2]The transform of microorganisms population before and after biofiltration also be observed through the SEM (Scanning Electron Microscope) to see the morphology of compost. Figures 6 and 7 show the surface morpho- logy of compost before and after 9 hours biofiltration
Figure 6. SEM test results on compost before biofiltration.
[image:4.595.59.285.683.735.2]Figure 7. SEM test results on compost after biofiltration.
Table 1. TPC test results.
TPC Test Result ∑Microorganisms (CFU/g, compost)
Before biofiltration 1.35 × 10¹¹
After biofiltration 3.65 × 10¹¹
The highest N2O removal efficiency 61% in biofiltration
process using cow-manure based compost as medium filter, was obtained under 88 cm3/min flow rate, with a
depth of 50 cm, and water content 50% (w/w). Microor-ganisms in compost could survive and reproduce them-selves during 9 hours process of N2O biofiltration.
REFERENCES
[1] Intergovernmental Panel on Climate Change (IPCC), “Climate Change 2001: Impacts, Adaptation, and Vul-nerability,” IPCC Third Assessment Report, 2001. [2] C. Kennes and M. Veiga, “Conventional Biofilters,” In: C.
Kennes and M. Veiga, Eds., Bioreactors for Waste Gas Treatment, Kluwer Academic Publishers, Dordrecht, 2001, pp. 47-98.
[3] Y. H. Liu, et al., “Removal of Ternary VOCs in Air
Streams at High Loads Using a Compost-Based Biofil-ter,” Dalian University of Technology, Dalian, 2004. [4] K. Kardono and E. R. Allen, “Elimination of Benzene
Using a Compost Biofilter,” 88th Annual AWMA Meeting & Exhibition, 1995.
[5] L. Lackey and T. Holt, “Not for the Birds,” WEF Indus-trial Wastewater, Vol. 4, 1996, pp. 31-33.
[6] M. Zilli, A. Converti, A. Lodi, D. M. Borghi and G. Fer-raiolo, “Phenol Removal from Waste Gases with a Bio-logical Filter by Pseudomonas Putida,” Biotechnology and Bioengineering, Vol. 41, No. 7, 1993, pp. 693-699.
doi:10.1002/bit.260410703
[7] E. Morgenroth, E. D. Schroeder, D. P. Y. Chang and K. M. Scow, “Nutrient Limitation in a Compost Biofilter Degrading Hexane,” Journal of the Air & Waste Man-agement Association, Vol. 46, 1995, pp. 300-308.
[8] E. Pagans, X. Font and A. Sanchez, “Biofiltration for Ammonia Removal from Composting Exhaust Gases,”
Chemical Engineering Journal, Vol. 11, No. 2-3, 2005,
pp. 105-110. doi:10.1016/j.cej.2005.03.004
[9] Y. Liang, et al., “Long-Term Results of Ammonia
Re-moval and Transformation by Biofiltration,” Journal of Hazardous Materials, Vol. 80, No. 1-3, 2000, pp. 259-
269. doi:10.1016/S0304-3894(00)00314-9
[10] R. E. Nicolai and K. A. Janni, “Biofilter Media Mixture Ratio of Wood Chips and Compost Treating Swine Odors,” Water Science and Technology, Vol. 44, No. 9,
2001, pp. 261-267.
[11] W.-F. Yang, et al., “The Effect of Selected Parameters on the Nitric Oxide Removal by Biofilter,” Journal of Ha- zardous Materials, Vol. 148, No. 3, 2007, pp. 653-659.
[12] Z. Shareefdeen and S. Ajay, “Biotechnology for Odor and Air Pollution Control,” Springer, Heidelberg, 2005. [13] C. Van Lith, S. L. David and R. Marsh, “Design Criteria
for Biofilters,” In: C. Van Lith, S. L. David and R. Marsh, Eds., Effluent Treatment and Waste Disposal, ClairTech,
Utrecht, 1990, pp. 127-132.