An Artificial Predictive Modeling Framework for
Automatically Detecting Problematic Use of Internet
Zeinab Hassani
Department of Computer
science, Kosar University of
Bojnord, Bojnord, Iran
Aylin Pakzad
Department of Industrial
Engineering, Kosar University
of Bojnord, Bojnord, Iran
Arezou Asghari
Department of Humanities,
Kosar University of Bojnord,
Bojnord, Iran
ABSTRACT
The Internet is one of the most influential new communications technologies that have been affected both social and health aspects of users’ lives. Despite many advantages and its positive pointes in communication, the excessive use of Internet make a serious danger that has adverse impacts on overall health. The inability of individuals to control the Internet use has been defined as Internet Addiction (IA). There are a lot of studies on IA over the topics of diagnosis, phenomenology, epidemiology, and treatment based on statistical analysis, but a few research works are conducted by machine learning techniques. So our research focuses on diagnosing and counseling to prevent IA by developing prediction models based on ensemble method with machine learning algorithms and finding the most important risk factors in diagnosing the status of users’ IA. Experiment results demonstrate that this hybrid machine learning model by considering students field and location along with items 1, 3, 4, 5, 10, 12, 14, 15, 19, 20 from Internet Addiction Test (IAT) as the most important risk factors can identify the status of users’ IA with 99.75% accuracy attains a performance superior to traditional single classifier systems.
Keywords
Internet Addiction, Machine Learning, Particle Swarm Optimization, Firefly Algorithm, K nearest Neighbor.
1.
INTRODUCTION
In spite of public belief, addiction doesn't mean consumption of chemical and physical compounds such as alcohol, nicotine, cocaine and heroin. According to the psychologists opinion anything that stimulates a person could be addictive and not limited to drug consumption. Nowadays a large number of the world's population use Internet. Unfortunately, despite many advantages and its positive pointes in communication, Internet is condemned to have dangerous side effects. Dr. Ivan Goldberg, 1996 [1] and Dr. Young, 1998 are the early ones who introduced the concept of problematic use of Internet as a variant of addictive behavior. Overuse Internet is an uncontrollable use can lead to significant personal, family, and occupational problems similar to other addictions, such as pathological gambling, eating disorders that have been termed Internet Addiction (IA) [2].
In 1996, Young's first work on IA was a case study of a 43-year old woman was published [3]. This was followed in 1998 by an efficient book [2] and she in another paper on IA, determined a set of criteria which would identify addictive users from normal Internet usage [4]. Anderson carried out a study about IA on 1302 students. He found that 106 students are IA; 87.7% of whom was male and the rest 12.3% was
female [5]. Lin and Tsai (2002) found that 10% of the high school students are defined as IA users. Those addicted users averagely spend 20 hours a week on Internet [6]. Ph.D., Director of Addiction Medicine at Beijing Military Region Central Hospital, reported 13.7% IA among Chinese adolescent. As a result, in 2007 China began restricting computer game use; current laws now discourage more than 3 hours of daily game use [7].
Uncontrollable and misuse of Internet lead to problems in all domains such as poor academic performance, disruption in sleep pattern, misuse of time in the work place, financial problems in online service fees and IA users gradually spent less time with real people in their lives in exchange for solitary time in front of a computer or cellphone in other word, relational maladjustment [3, 8]. Young adults and adolescents such as university/high school students are more vulnerable to IA because they have less ability to control their enthusiasm [9, 10]. Therefore, Academics have been sounding out concerns and proposed prevention and intervention programs for IA, which should be accomplished at the community, school, family, and individual levels [11, 12].
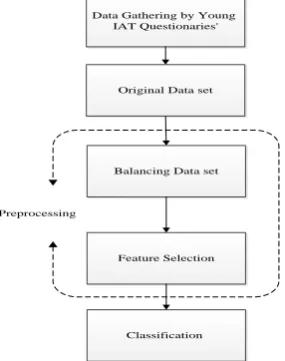
important risk factors in IA some recommendations to prevent IA are proposed. Our hybrid machine learning model carry out thorough an empirical study for diagnosing status of students’ IA. The students of Kosar University of Bojnord, in the Northeast region of Khorasan, Iran, are participated in the survey which was conducted during 2016-2017 academic year. The information of Internet usage is collected based on Young’s Internet Addiction Test (IAT). Since the data are imbalance one of the sampling methods is used to improve the performance of classification model. Then Feature selection methods based on two heuristic algorithms are conducted to eliminate the insignificant features; and classification process is accomplished. The framework of our hybrid machine learning model comes in Figure 1.
Balancing Data set
Feature Selection
Classification Preprocessing
Original Data set Data Gathering by Young
[image:2.595.310.549.66.728.2]IAT Questionaries'
Fig 1: The framework of hybrid machine learning model This paper is organized as follows: In Section 2, the preliminaries of the research presented. The research methodology is presented in section 3. In Section 4, the application of our hybrid model is demonstrated and the comparisons of the results are presented. Finally, in Section 5 we conclude the paper and present future work.
2.
PRELIMINARIES
2.1
Internet Addiction Test (Iat)
[image:2.595.95.238.226.407.2]A required questionnaire for IA test first was developed by Young, in 1998 [4]. It comprises 20 items Likert scale (see Table 1) that is an expanded version of Young's diagnostic questionnaire [2]. The studies have shown that this scale has high face validity, Internet consistency, and reliability, and its factor structure has been explored [17- 19]. It's Cronbach's was 0.94 and is a valid cosmopolitan one-factor instrument for measuring IA. So the English version of IAT is a validated and reliable measure of addictive use of the Internet [8, 14] [20, 21]. The Young's questions are derived from the DSM1– IV criteria for pathological gambling and alcohol dependence. Pay attention to the total score obtained on the test the sample is divided into one of the three categories: average online user (20-49), moderately addicted users (50-79) and severely addicted users (80-100) that suggest the need for help [22].
Table 1. Young's IAT Questionnaire
No Question Scale
1 How often do you find that you stay on-line longer than you intended?
1-5
2 How often do you neglect household chores to spend more time on-line?
1-5
3 How often do you prefer the excitement of the Internet to intimacy with your partner?
1-5
4 How often do you form new relationships with fellow on-line users?
1-5
5 How often do others in your life complain to you about the amount of time you spend on-line?
1-5
6 How often do your grades or school work suffer because of the amount of time you spend on-line?
1-5
7 How often do you check your email before something else that you need to do?
1-5
8 How often does your job performance or productivity suffer because of the Internet?
1-5
9 How often do you become defensive or secretive when anyone asks you what you do on-line?
1-5
10 How often do you block out disturbing thoughts about your life with soothing thoughts of the Internet?
1-5
11 How often do you find yourself anticipating when you will go on-line again?
1-5
12 How often do you fear that life without the Internet would be boring, empty, and joyless?
1-5
13 How often do you snap, yell, or act annoyed if someone bothers you while you are on-line?
1-5
14 How often do you lose sleep due to late-night log-ins?
1-
15 How often do you feel preoccupied with the Internet when off-line, or fantasize about being on-line?
1-5
16 How often do you find yourself saying “just a few more minutes” when on-line?
1-5
17 How often do you try to cut down the amount of time you spend on-line and fail?
1-5
18 How often do you try to hide how long you’ve been on-line?
1-5
19 How often do you choose to spend more time on-line over going out with others?
1-5
20 How often do you feel depressed, moody or nervous when you are off-line, which goes away once you are back on-line?
1-5
to discriminate normal Internet users and Internet addicts, the demographic information hadn’t considered in discrimination analysis. Hence, we aim to construct detection model based on machine learning methods for evaluating the severity of IA and determine the most important risk factors by considering both demographical and Young ’s Internet Addiction Test.
2.2
Smote
A type of oversampling method is a Synthetic Minority Over-sampling Technique (SMOTE). SMOTE was introduced in 2002 an intelligent approach to oversampling. In basic oversampling randomized solutions by duplicating existing instances of minority class could be reached. Comparing with this random oversampling method, SMOTE method can effectively avoid the problem of overfitting of classifiers. Its theory basis is that the feature space of minority class instances is similar. Neighbors from the k nearest neighbors are randomly chosen. Each new instance is created by adding to the original object computed difference between randomly selected neighbor and the source instance, which is additionally multiplied by randomly chosen value in 0 – 1 range. This increases the diversity of artificial instance set, allowing for better exploitation of the given decision space [23, 24].
2.3
Particle Swarm Optimization (Pso)
One of the evolutionary optimization methods is Particle Swarm Optimization (PSO) that is developed by Eberhart and Kenned in 1995 [25]. PSO is designed for global optimization by emulating the behavior of animals’ societies that do not have any leader in their group or swarm, such as bird flocking and fish schooling and they find their food by random follow one of the particle. These particles should be in closest position with a food source. This closest position is also known as potential solution for that group.Each member of the group communicates to the members who already have a better situation to achieve their best condition in terms of position. Particles those having better condition inform to other particles. And the other members move immediately to that place. This happens repeatedly until the best conditions or a food source discovered.
So in the PSO algorithm, each particle is spread in the space of the search function we intend to optimize it. Each particle calculates the value of the objective function in the position of the space in which it is located The PSO algorithm contains the following steps:
Step 1: Initializing a population of particles with random locations and velocities in dimension D in the search space
Step 2: Calculate the merit function
Step 3: Update the velocity of each particle and move to the next position based on the equations (1) and (2):
vid t + 1 = wvid t + c1r1 xibest− xid t
+ c2r2 xgbest − xidt
(1)
xid t + 1 = xid t + vid t (2)
Xid (t) and Vid (t) respectively indicate the position and velocity of the particle in the d dimension, xibest the best position of the particle up to the moment tth, xgbest the best global position, w, the coefficient of inertia, c1 and c2 The learning coefficients and r1 and r2 are two random numbers.
Step 4: Stop the algorithm if it reaches a specified stopping point, otherwise go to step 2 [26, 27].
The PSO algorithm was worked for solving problems in a continuous space. The Binary Particle Swarm Optimization (BPSO) algorithm was proposed by James Kennedy for solving binary problems. In the binary version, the position of each particle in each dimension is limited to two values of zero and one. That is, every particle moves in a space that is limited to zero and one. The initial velocity of the particles is also in the interval [1 and 0] [28].
2.4
Fierfly Algorithm (Fa)
Xin- She Yang introduced Firefly Algorithm (FA) in 2008 that inspired by social behavior of fireflies [29]. It is a nature-inspired meta-heuristics algorithm that can solve NP-hard problem such as feature selection problem [30, 31]. Fireflies produce flashes to attract other fireflies. There are three rules to formulate FA by idealizing some of the flashing characteristics of fireflies [32]:
a) All fireflies attracted to other fireflies regardless of their sex which means that they are unisex. b) Fireflies have own attractiveness that is proportion to their brightness. Every two fireflies attract to brighter one. More brightness firefly means the less distance between two fireflies. The brightest firefly moves randomly. c) Fitness function appoints the brightness of each firefly. Three important strategies embedded in firefly algorithm include: distance, attractiveness, and movement that coming as follow.
2.4.1
Distance
Distance of two fireflies i and j at position Xi and Xj,
𝑟
𝑖,𝑗, can determine in Euclidean distance as equation(3), [29]:𝑟𝑖,𝑗= 𝑋𝑖− 𝑋𝑗 (𝑋𝑖,𝑘− 𝑋𝑗 ,𝑘)2 𝑑
𝑘=1
(3)
Where
𝑋
𝑖,𝑘 and𝑋
𝑗 ,𝑘 is kth component of the ith and jth firefly respectively. d is the total number of dimension.2.4.2
Attractiveness
Measuring the attractiveness function β(r) can perform any monotonically decreasing functions such as equation(4).
𝛽 = β0× e−γr
2
(4)
Where r is distance between two fireflies,
𝛽
0 is attractiveness parameter, and𝛾
is the light absorption coefficient.2.4.3
MOVEMENT
The movement of firefly i toward firefly j as more attractive firefly is determined by formula in equation (5).
𝑥𝑖 𝑡 + 1 = 𝑥𝑖 𝑡 + 𝛽(𝑟) 𝑥𝑖 𝑡 − 𝑥𝑗 𝑡
+ 𝛼 𝑟𝑎𝑛𝑑 − 0.5 (5)
The first term is current position of firefly i, the second is refers to attractive, and third is randomize movement of ith firefly within the search space with randomize parameter
𝛼
. Rand is a random number generator uniformly distributed in [0, 1] [33].2.4.4
Binary Fierfly Algorithm (Bfa)
i is mapped to 0 and 1 interval using sigmoid function as equation (6).
𝑆 𝑥𝑖,𝑘 𝑡 + 1 = 1
1 + 𝑒𝑥𝑝 −𝑥𝑖,𝑘 𝑡 + 1
𝑘
= 1,2, … , 𝑑
(6)
Where 𝑋𝑖,𝑘 is kth component of the ith firefly and d is dimension. Then the new position of firefly i is calculated by equation (7).
𝑥𝑖,𝑘= 1 𝑖𝑓 𝑟𝑎𝑛𝑑 < 𝑠(𝑥𝑖,𝑘)
0 𝑂. 𝑊
(7)
Rand is a random number in [0, 1].
2.5
K Nearest Neighbor (Knn)
K Nearest Neighbor (KNN) is a simple algorithm and it is a supervised learning algorithm. KNN is a method used for classification and regression. The input of the algorithm is the training samples, and the output is the class label. Examples of training are vectors in the D-dimensional space whose class labels are specified. From training point to sample point distance is evaluated, and the point with lowest distance is called nearest neighbor and observes a majority vote within
the K nearest neighbors. The most common metric of distance
or similarity is to calculate the distance between objects in Euclidean space [35].
2.6
Evaluation Indicatores
We need indicators that can be used to evaluate the efficiency of models in comparison with the data set. One of the best methods for estimating the target model is the mean squared error (MSE) comes in equation (8) [36, 37].
𝑀𝑆𝐸 =
1
𝑁
𝑦
− 𝑦
𝑛 𝑛2
𝑁
𝑛=1
(8)
Additionally, in equations (9) to (11), three other important indicators are considered for better understanding of models' performance. Accuracy is a measure of the overall effectiveness of a classifier. Precision is the class agreement of the instance labels with the positive labels given by the classifier. Recall measures the effectiveness of a classifier to identify positive labels.
Accuracy = TP + TN TP + TN + FP + FN (9)
Precision = TP TP + FP (10)
Recall = TP TP + FN (11)
TN is True Negatives, TP is True Positives, FN is False Negatives and FP – False is Positives [38].
3.
METHODOLOGY
3.1
Dataset
The dataset consists of 245 samples that were collected based on the frameworks of Ivan Goldberg and Kimberly Young questionnaire through the students of Kosar University of Bojnord in the Northeast region of Khorasan, Iran. The questionnaire used in the study has two parts. The first of which is about demographic information and the second part is about the IA. In the first part of the questionnaire the participants answered personal questions such as gender, age, their fields, marriage status and location. In the second part, Young's diagnostic questionnaire has been adapted including 20 items about the IA that are in 5 Likert scale as: “Certainly
disagree (1), Disagree (2), Uncertain (3), Agree (4), certainly agree (5)” [2].
[image:4.595.311.546.163.291.2]In this paper five items of demographical information beside 20 items in Young's diagnostic questionnaire are considered as features to construct automatic detecting model for IA. Therefore collected dataset consists of 25 features. Table 2 depicts the dataset features information.
Table 2. Dataset features information 1 Gender (Male/ Female)
2 Age (18-20/ 21-23/ 24-26/ 27-29)
3 Fields (15 field in Kosar university of Bojnord)
4 Marriage Status (Single/ Married)
5 Location (dormitory/ pension/ apartment rental/local residents)
6-25 Internet Addiction Test (IAT) Questions
26 Class_ Label (Internet Addict / Semi Internet Addict)
In Table 2 the 26th attribute correspond to the diagnosis status (Internet Addict/Semi Internet Addict). Based on IAT introduced in section 2.1, everyone is categorized in three groups. In collected 245 samples, there isn’t any one with total score in (20-49), and merely there are samples with total score of (50-79) and (80-100). Therefore in this study the label is binary. The samples with total score of (50-79) and (80-100) are called Semi Internet Addict and Internet Addict, respectively.
3.2
Preprocessing
Class imbalance problem has been emerged in many real- world classification problems for instances, the recognition of cheating in credit card transaction, the perdition of telecommunication equipment failure, the forecast of business failure [39] and medical diagnosis [40]. In this situation (in the presence imbalance data) traditional classification models and their evaluation criteria don’t have correct performance; therefore different approaches for solving this problem were presented. Since the dataset was introduced in section 3.1 are imbalanced and minority class converges to the majority class in the classification, SMOTE algorithm is used to improve the performance of classification model. SMOTE method can effectively avoid the problem of overfitting of classifiers.
3.3
Proceed Algorithm
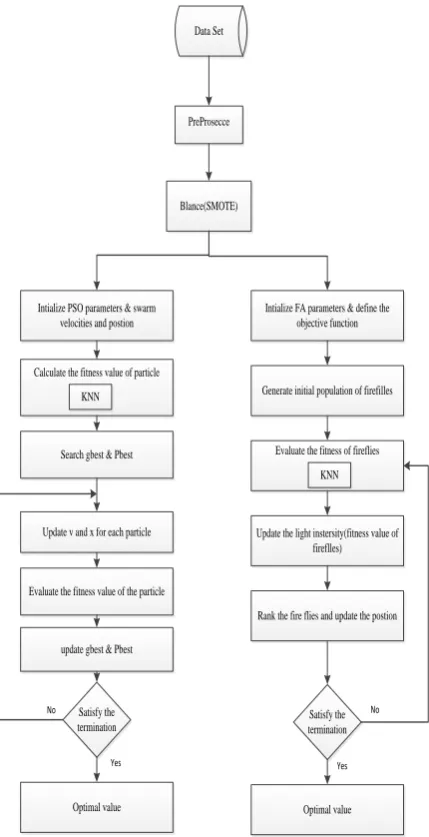
imbalanced and balanced dataset. Figure 2 shows the proposed approach.
4.
EXPERIMENTAL RESULTS
4.1
Evaluation Of Proposed Hybrid Model
Implementation of our hybrid model and data analysis is performed by Matlab software version R2014a and on computer using Intel core i7. As we said in section 3.3, in our approach twokinds of the dataset (imbalance and balance) are considered by BFA and BPSO algorithms and classification investigation are conducted by KNN method and based on MSE criteria. For evaluating proposed method, in addition to MSE, three other criteria are mentioned in section 2.6 (accuracy, Precision, and Recall) are calculated. The experiments are carried out by two different population size (10, 15) and two different numbers of generations (20, 25). Results of four evaluating factors on two datasets come in Table 3 and 4.
Data Set
PreProsecce
Blance(SMOTE)
Intialize FA parameters & define the objective function
Generate initial population of firefilles
Evaluate the fitness of fireflies
Rank the fire flies and update the postion Update the light instersity(fitness value of
fireflles)
Satisfy the termination
Optimal value Intialize PSO parameters & swarm
velocities and postion
Calculate the fitness value of particle
Search gbest & Pbest
Evaluate the fitness value of the particle Update v and x for each particle
Satisfy the termination
Optimal value
KNN KNN
update gbest & Pbest
No
Yes
No
[image:5.595.307.547.72.569.2]Yes
[image:5.595.310.548.80.332.2]Fig 2: Diagram of the proposed approach
Table 3. Results of BFA algorithm
BFA Npo
p
It Accurac y
Precisio n
Recal l
MSE
Balance d Dataset by SMOTE
10 2
0 99.75 99.44 100
0.002 5
10 2
5 99 97.77 100 0.01
15 2
0 99.75 99.44 100
0.002 5
15 2
5 99.75 99.44 100
0.002 5
Original Dataset
10 2
0 93.88 75.67 94.67 0.061 2
10 2
5 92.63 73.67 92.40 0.073 7
15 2
0 93.1 72.33 96.67 0.069
15 2
[image:5.595.60.275.265.684.2]5 94.32 78.33 96.33 0.057
Table 4. Results of BPSO algorithm
BPSO Npo
p It
Accurac
y Precision Recall MSE
Balance d Dataset by SMOTE
10 2
0 99.75 99.44 100
0.002 5
10 2
5 99.75 99.44 100
0.002 5
15 20 99.75 99.44 100 0.002
5
15 2
5 99.75 98.33 100
0.007 5
Original Dataset
10 20 93.08 74 95.14 0.069
10 2
5 93.9 76.67 97.14 0.061
15 2
0 94.7 80 96.67 0.053
15 2
5 93.13 74.67 93 0.069
For every feature selection algorithm, BFA and BPSO, in different implementation based on population size and numbers of generations the best values of evaluation indicators are determined with bold in the table 3 and 4. According to comparison results in Table 3, BFA algorithm with accuracy 99.75% and precision 99.44% in balanced dataset outperformed. For original imbalance dataset, BFA algorithm obtained accuracy 94.32 and precision 78.33%. Similarly, according to Table 4, BPSO algorithm with accuracy 99.75% and precision 99.44% in balanced dataset outperformed. For original imbalance dataset, BPSO algorithm obtained accuracy 94.7% and precision 80%.
[image:5.595.309.547.343.570.2]automatically detection model in data mining especially in diagnosis of IA.
Fig 3: Computational efficiency of the data that is balanced or imbalanced
In Figure 3, the mean results of BFA and BPSO algorithms are represented by balanced dataset and imbalanced dataset. As this Figure shows, based on four evaluation indicators consist of accuracy, precision, recall and MSE, both BFA and BPSO algorithms have better result on balanced dataset in comparison to imbalance dataset.
4.2
The Most Important Risk Factors In Ia
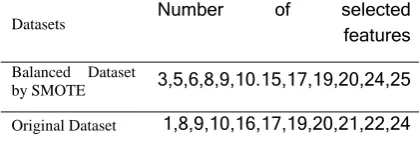
In addition to mentioned results another benefits of our proposed hybrid model is to determination of the most important risk factors can identify the status of users’ IA. With regard to results of all runs of BFA and BPSO algorithm on two different datasets, the most important features that have been selected in most of optimal outputs comes in Table 5.Table 5. Optimal selected features
Number of selected
features
Datasets
3,5,6,8,9,10.15,17,19,20,24,25
Balanced Dataset by SMOTE
1,8,9,10,16,17,19,20,21,22,24
Original Dataset
In Table 5, students field and location along with items 1, 3, 4, 5, 10, 12, 14, 15, 19, 20 from IAT and students gender along with items 3, 4, 5, 11, 12, 14, 15, 16, 17, 19 from IAT are the most important risk factors for diagnosing status of students’ IA in balanced datasets by SMOTE and original dataset, respectively. It is worth mentioning that items 3, 4, 5, 12, 14, 15 and 19 are similar selected important factors in both runs.
4.3
Recommendation To Prevent Ia
Due to the efficiency of proposed model and the most important risk factors that are found, we can offer some recommendations to prevent IA. Pay attention to important factors such as, demographic variables and questions which indicated social problems, it is urgent to design and implement prevention programs for at risk students. The intervention should target students with different majors, students’ types of accommodation, besides, considers parents and lecturers who are part of the students’ environment. Furthermore, with regard to selected questions which implied more on social problems [18], early diagnosis is needed for
students with psychological problems like social anxiety, depression, poor social skills, high impulsivity, and so on which lead to problematic use of the Internet.
5.
CONCLUSION
Overuse Internet has become a concern, and researchers have proposed that it may involve addiction. Therefore, in this paper, we presented an artificial prediction model for aiding Psychologists to diagnosis Internet Addict users. A developed prediction model is based on ensemble method with machine learning algorithms including SMOTE algorithm, BFA, BPSO and KNN was applied on real- world dataset. SMOTE algorithm was used to improve the performance of classification model. Both feature selection methods (BFA and BPSO) were conducted to eliminate the insignificant features; and classification process was accomplished by KNN method. According to experimental results, the proposed hybrid model based on four evaluation criteria had better performance in comparison to model without balancing step. Also the most important risk factors that had influenced on diagnosing IA users were determined and some recommendations for the persistence of addiction to the Internet were presented.
This study focused on students’ Internet use based IAT and biographical information, but we did not collect information about the amount of time students were spending online. Thus, for future studies, it might be helpful to considering it in diagnosing IA.
6.
REFERENCES
[1] Goldberg, I. 1996. “Internet Addiction Disorder.” Retrieved February 10.2009 from http:// www.rider.edu/~suler/psycber/supportgp.html.
[2] Young, K. S. 1998a. Internet addiction: The emergence of a new clinical disorder. Cyberpsychology and
Behavior, 1(3), 237–244.
http://dx.doi.org/10.1089/cpb.1998.1. 237.
[3] Young, K. 1996. Psychology of computer use: XL. Addictive use of the Internet: A case that breaks the stereotype. Psychological Reports, 79, 899- 902.
[4] Young, K. S. 1998b. Caught in the net: How to recognize the signs of internet addiction and a winning strategy for recovery. John Wiley & Sons.
[5] Bayraktar, F. 2001. “İnternet kullanımının ergen gelisimindeki rolu”. Unpublished PHD thesis, Ege Universitesi Sosyal Bilimler Enstitusu, İzmir.
[6] Lin, S. S., and Tsai, C. C. 2002. “Sensation seeking and internet dependence of Taiwanese high school adolescents.” Computers in human behavior, 18(4), 411-426.
[7] Block, J. J. 2008. Issues for DSM-V: Internet Addiction, THE AMERICAN JOURNAL OF PSYCHIATRY, Volume 165 Number 3, 306-307.
[8] Scimeca, G., Bruno, A., Cava, L., Pandolfo, G., Muscatello, M. R. A., and Zoccali, R. 2014. The relationship between alexithymia, anxiety, depression, and internet addiction severity in a sample of Italian high school students. Scientific World Journal, 2014. http://dx.doi.org/10.1155/2014/504376.
[9] Frangos, C. C., Fragkos, K. C., and Kiohos, A. 2010. Internet Addiction among Greek University Students: Demographic Associations with the Phenomenon, Using
9
9
.5
6
9
9
.0
2
100
0
.4
3
7
5
9
3
.4
8
75
9
5
.0
1
6
.5
1
7
9
9
.6
2
9
9
.1
6
100
0
.3
7
5
9
3
.7
7
6
.3
3 95.4
8
6
.2
9
7
A C C U R A C Y P R E C I S I O N R E C A L L M S E
BFA balanced Dataset BFA Original Dataset
[image:6.595.61.271.474.548.2]the Greek Version of Young’s Internet Addiction Test. International Journal of Economic Sciences and Applied Research. 3(1), 49
[10]Young, K. S. 2004. Internet addiction: A new clinical phenomenon and its consequences. The American Behavioral Scientist, 48(4), 402–415. http://dx.doi.org/10.1177/ 0002764204270278.
[11]Shek, D. T. L. and Leung, H. 2013. “Development of an integrated intervention model for Internet addiction in Hong Kong”, International Journal of Child and Adolescent Health, 6(4), pp. 475-486.
[12]Shek, D. T. L. and Yu, L. 2013. “Internet addiction phenomenon in early adolescents in Hong Kong”, International Journal of Child Health and Human Development, 6(1), pp. 145- 156.
[13]Van Rooij, A. J., and Prause, N. 2014. A critical review of “Internet addiction” criteria with suggestions for the future. Journal of Behavioral Addictions, 3, 203-213
[14]June, K. J., Sohn, S. Y., So, A. Y., Yi, G. M., and Park, S. H. 2007. A study of factors that influence Internet addiction, smoking, and drinking in high school students. Taehan Kanho Hakhoe Chi. 37(6):872-82.
[15] Ferraro, G., Caci, B., D'Amico, D., and Blasi, M. D. 2007. Internet Addiction Disorder: An Italian Study, CyberPsychology & BehaviorVol. 10, No. 2, 170-175.
[16]Tekkanat, E., and Topaloglu, M. 2015. The Assessment of High Schoolers’ Internet Addiction. Procedia - Social and Behavioral Sciences 205, 664 – 670.
[17]Widyanto, L., and McMurran, M. 2004. The psychometric properties of the internet addiction test. Cyberpsychology Behaviour, 7(4), 443–450. http://dx.doi.org/10.1089/ cpb.2004.7.443.
[18]Alavi, S. S., Eslami, M., Meracy, M. R., Najafi, M., Jannatifard, F., and Rezapour, H. 2010. Psychometric properties of Young internet addiction test. International Journal of Behavioral Science, 4(3), 183–189.
[19]Chang, M. K., and Man Law, S. P. 2008. Factor structure for Young's Internet Addiction Test: A confirmatory study. Computers in Human Behavior, 24(6), 2597– 2619. http:// dx.doi.org/10.1016/j.chb.2008.03.001.
[20]Jelenchick, L. A., Becker, T., and Moreno, M. A. 2012. Assessing the psychometric properties of the Internet Addiction Test (IAT) in US college students. Psychiatry Research, 196, 296–301.
[21]Widyanto, L., Griffiths, M. D., and Brunsden, V. A. 2011. Psychometric Comparison of the Internet Addiction Test, the Internet-Related Problem Scale, and Self-Diagnosis. Cyberpsychology, Behavior, and Social Networking, 14, 141–9.
[22]Murali, V., and George, S. 2007. An overview of internet addiction. Advances in Psychiatric Treatment, 13, 24-30.
[23]Zheng. Z. 2015. oversampling method for imbalanced classification computing and Informatics, Vol. 34, 1017– 1037
[24]Skryjomski, P. L., and Krawczyk, B. 2017. Influence of minority class instance types on SMOTE imbalanced data oversampling, Proceedings of Machine Learning Research, 74,7–21.
[25]Kennedy, J. and Eberhart, R. 1995. Particle Swarm OptimizationIn: Proceedings of the 1995 IEEE international conference on neural networks. New Jersey: IEEE Press. 1942–1948.
[26]Kumar, A., Kumar Singh, B., and Patro, B. D. K. 2016. Particle Swarm Optimization: A Study of Variants and Their Applications, International Journal of Computer Applications, 135(5), (0975 – 8887).
[27]Astuty., and Haryono, T. 2016. Novel binary PSO algorithm based optimization of transmission expansion planning considering power losses, International Conference on Innovation in Engineering and Vocational Education, 128, 012023.
[28]Teng, X., Dong, H., and Zhou, X. 2017. Adaptive feature selection using v-shaped binary particle swarm optimization. PLoS ONE 12(3): e0173907.
[29] Yang, X.S. 2008. Nature-inspired Metaheuristic Algorithm. University of Cambridge. United Kingdom: Luniver Press.
[30] Yang, X. 2010. Engineering optimization: an introduction with metaheuristic applications.
[31]Liu, H., Yu, L. 2005. Toward integrating feature selection algorithms for classification and clustering, IEEE Transactions on Knowledge and Data Engineering, 17 (4), 491–502.
[32] Chandrasekaran, K., Simon, S. P. 2012. Network and reliability constrained unit commitment problem using binary real coded firefly algorithm, Electrical Power and Energy Systems, 43, 921–932.
[33] Fister, I., et al. 2013. Memetic Self-Adaptive Firefly Algorithm. Swarm Intelligence and Bio-Inspired Computation. 73-102.
[34] Palit, S.,
Sinha,
S.N., Moll, M.A., Khanra, A.,
and
Kule, M. 2011 A Cryptanalytic attack on the Knapsack Cryptosystem using Binary Firefly Algorithm, International Conference on Computer and Communication Technology (ICCCT), 317-320.[35]Alchamlat, S. A., and Farnir, F. 2017. KNN-MDR: a learning approach for improving interactions mapping performances in genome wide association studies, BMC Bioinformatics, 18:184
[36]Muayad, A., and Irtefaa, A. N. 2016. Ridge Regression using Artifiial Neural Network. Indian Journal of Science and Technology, 9(31).
[37]Kouchakzade, M., Bahmani, A. 2006. Assessment of artificial neural networks revenue in reducing required parameters for estimation of reference evapotranspiration. Journal of agricultural sciences Islamic Azad University, 11(4).
[38]Bilalli, B., Abello, A., Aluja-Banet, T., Wrembel, R. 2018. PRESISTANT: Learning based assistant for data pre-processing, Preprint submitted to Elsevier March 6.
[39]Atiya, A.F. 2001. Bankruptcy Prediction for Credit Risk Using Neural Network: A Survey and New Results. IEEE Trans on Neural Networks, 12 (4): 929-935.
The effects of imbalanced datasets on classification performance,” Neural Netw., vol. 21, no. 2–3, pp. 427– 436.
[41]Blum, A.L., and Langley, P. 1997. Selection of relevant features and examples in machine learning, Artificial Intelligence, 97 (1), 245–271.
[42]De Stefano, C., Fontanella, F., Marrocco, C., and Scotto di Freca, A. 2014. A GA-based feature selection
approach with an application to handwritten character recognition, Pattern Recognition Letters, 35, 130-141.
[43]Deniz, A., Ezgi Kiziloz, H., Dokeroglu, T., Cosar, A. 2017). Robust multiobjective evolutionary feature subset selection algorithm for binary classification using machine learning techniques, Neurocomputing, 1-19.