z
RESEARCH ARTICLE
SEASONAL CHANGES IN WATER QUALITY AND BIOMASS OF WATER HYACINTH IN LAKE
NAIVASHA, KENYA
*James Outa, Nzula Kitaka and Julius Kipkemboi
Department of Biological Sciences, Egerton University, P.O. Box 536-20115, Egerton, Kenya
ARTICLE INFO ABSTRACT
Lake Naivasha faces the challenge of nutrient enrichment and persistent floating aquatic macrophytes. The study aimed to determine seasonal changes in water quality and biomass of water hyacinth in Lake Naivasha. The changes in water hyacinth phytomass and values of physico-chemical parameters were measured fortnightly from September 2011 to January 2012 in three sites within the lake; Malewa River inlet, off wastewater treatment plant (WWT) - both with water hyacinth and an open water site. Sites with hyacinth mats had significantly low dissolved oxygen concentrations, low pH values, high concentration of total phosphorous (TP) and turbidity. TP increased seven fold while NH4-N and NO3-N increased at least thrice during the rainy season (November and December 2011)
in Malewa and WWT sites. The highest hyacinth phytomass density (98 plants/m2) was recorded at the Malewa site in January. Live biomass of hyacinth changed form 13.2 tons/ha in September to 33.6 and 25 tons/ha at the WWT and Malewa sites respectively in January. Senesced biomass increased during the dry period (September and October 2011). In conclusion, increase in water hyacinth growth coincided with the period of significantly high nutrient concentrations in the lake during and soon after the rainy season.
Copyright © 2014 James Outa et al. This is an open access article distributed under the Creative Commons Attribution License, which permits unrestricted use, distribution, and reproduction in any medium, provided the original work is properly cited.
INTRODUCTION
Lake Naivasha is one of the Rift valley lakes in Kenya. It was designated as a Ramsar site (no. 724) in 1995. The Lake
Naivasha has a catchment area of approximately 3 400 km2 and
stretches from the Aberdares mountain ranges in the north and north east to the Olkaria, Longonot mountains in the south and south east. It is bounded by the Mau Escarpment in the west, Eburu Escarpment to the North and the Kinangop plateau in the East (Guy 2011). The lake surface area is approximately 140
km2. The report by Guy (2011) also noted that the lake is
recognized for its diverse flora and fauna as it provides a variety of habitats for a plethora of mammals, birds and fish. The lake and its surrounding has a high economic value as it provides water for agricultural production for export and domestic markets and is a major hub for tourism and recreation industry. Most importantly, a population of about 250,000 people in the vicinity of the lake gets their domestic water from the lake or its waterways (IUCN 2003). Inspite of all these values, Lake Naivasha is faced with a number of challenges that affect its ecological and economic functions. Over the years, the lake has faced continuous pollution from
both point and diffuse sources. Kitaka et al. (2002) classified
Lake Naivasha as eutrophic based on normal limnological
*Corresponding author: James Outa,
Department of Biological Sciences, Egerton University, P.O. Box 536-20115, Egerton, Kenya.
criteria. The trophic status of the lake may have played a significant role in the persistent proliferation of nuisance
floating aquatic macrophytes such as Salvinia molesta and
Eichhornia crassipes (Mart.) Solms. E. crassipes is currently
the most common and notorious species of the genus
Eichhornia which is commonly referred to as ‘water hyacinth’.
In the last twenty years, the water hyacinth has gradually increased its dominance in Lake Naivasha, despite the various attempts to control its spread. Njuguna (2002) reported that by 1999, it had covered about 25 per cent of the lake water surface. An attempt to manage the weed using biological
control agent using plant weevils (Neochetina bruchii and N.
eichhorniae) at different sites around Lake Naivasha reduced
spread of hyacinth significantly (Mailu, 2001). E. crassipes and
water hyacinth weevil populations have oscillated in a ‘classic’ predator-prey cycle (Harper D., unpublished data, cited by
Harper et al., 2011).
Joyce (1985) noted that the ecological and economic effects of water hyacinth overgrowth are often quite dramatic with severe consequences. Its ecological effects include; competitive displacement of native plant communities particularly submerged plants, restriction of phytoplankton production due to shading, and interference with atmospheric oxygen exchange with the water through surface coverage. She further reported that severe depression of dissolved oxygen can occur in the water column underlying a dense water hyacinth mat due to rapid deposition of organic matter from senescing leaves.
ISSN: 0975-833X
Available online at http://www.journalcra.com
International Journal of Current Research
Vol. 6, Issue, 11, pp.9915-9925, November,2014
INTERNATIONAL JOURNAL OF CURRENT RESEARCH
Article History:
Received 22nd August, 2014
Received in revised form 16th September, 2014
Accepted 15th October, 2014
Published online 30th November,2014
Key words:
Juveniles,
Physico-chemical parameters, Temporal changes,
Development of anoxic conditions under water hyacinth can directly lead to exclusion of fish and other oxygen-dependent
organisms, thereby radically changing the structural
composition of faunal communities (Schmitz et al., 1993). In
addition, livelihoods are often adversely affected through restricted navigation, loss of fisheries access and siltation of drainage systems which is associated with substantial water hyacinth cover in a water bodies (Gopal, 1987). In order to predict possible effects of the water hyacinth mats on the water column and the aquatic organisms inhabiting this zone coupled with human water use, it’s important to determine the physical and chemical characteristics of the underlying water.
The study is aimed at determining seasonal changes in water quality and biomass of water hyacinth at three sites in Lake Naivasha, Kenya. The specific objectives were:
1. To compare the physico-chemical parameters of water underlying water hyacinth mats to open water over time 2.To evaluate the seasonal variation in water hyacinth biomass
and density.
MATERIALS AND METHODS
Study area
The study was carried out in Lake Naivasha, Kenya. The lake
is located at (0°45ʼS, 36°20ʼ E) at altitude 1890m above sea
level. It lies on the floor of Africa’s Rift Valley and covers
approximately 140km2 with an average depth of about 6m, the
deepest part being the Cresent Island (approximately 30m). It is the second largest fresh water lake in Kenya and one of the series of lakes in the Eastern arm of Africa’s Great Rift Valley
spanning latitudes from approximately 7° N to 5°S (Bercht
et al., 2006). Lake Naivasha is an endorheic shallow lake basin
and has two perennial inflowing rivers namely; Malewa River and Gilgil River and an intermittent River Karati (Figure 1). According to Mireri (2005), Lake Naivasha is located in the rain shadow of the Aberdare Range with a mean annual rainfall of about 650mm. The mean annual rainfall in the Aberdare Range is 1350mm. The lake itself is located in the south east of the basin catchment and consists of four lake basins; the main lake, Crescent Island, Oloidien and Sonachi Crater Lake. Sonachi Crater Lake is situated in the south west of the main lake and is completely detached, while Oloidien is located to the south of the main lake and it is influenced by the main lake level fluctuations making it either part of the main lake during high water levels or separate completely at low water levels, at different times of the year (WWF, 2011).
Description of sampling sites
The study was carried out in three selected sites within Lake Naivasha. Site one was at the part of the lake that is near Naivasha wastewater treatment plant (WWT), the second site was at Malewa River inlet (both with hyacinth cover) and third site was at pelagic zone within the lake without water hyacinth cover. Site one will there after be referred to as ꞌꞌWWTꞌꞌ while site two will be refered to as ꞌꞌMalewaꞌꞌ in the rest of the text. It is important to note that as at the time of the study, there was no evidence of direct discharge of wastewater into the lake.
The study sites were located at00° 46ʼ 21.1ʼʼ S, 36° 24ʼ 48.9ʼʼ
E for the WWT, 00° 43ʼ 39.60ʼʼ S, 36° 21ʼ 17.85ʼʼ E for Malewa and 00° 48ʼ 40.5ʼʼ S, 36° 20ʼ 40.8ʼ E for the open water site.
Sampling of water and measurement of physico-chemical parameters
Sampling was done twice a month for a period of five months (September 2011 to January 2012). Water samples were taken along a depth profile in the water column; at the surface, in the middle of the water column and at the bottom using a schindler sampler. The mid-point of the water column was established by first getting the total depth of the water and diving that by two. Depth specific samples were pooled to produce an intergrated sample for each site. In the areas with hyacinth cover, water samples were obtained within the dense mats. The collected water samples were transfered into clean dilute acid rinsed 500 ml plastic bottles and ferried to the laboratory for analysis. The
samples were analysed for TSS, NH4-N, NO3-N, NO2-N, PO4
-P and T-P. At each sampling point and sampling depth, dissolved oxygen concentration, electrical conductivity,
temperature and pH was measured in situ using a multimeter
(HACH model HQ40d) and appropriate probes. The probes
used were LDOTM for dissolved oxygen concentration and
temperature, CDC401 for electrical conductivity and PHC101 for pH. Transparency of the water was determined using a Secchi disk of 20 cm diameter. In places with high floating plant density, secchi depth measurements were achieved by
first pushing aside the plants to give a space (0.5 m2) for the
lowering in of the secchi disc.
Sampling of water hyacinth (plant density and biomass)
Sampling was done in the same period and frequency as the physico-chemical parameters. Random sampling was done in triplicate per site, with a distance of approximately 50 m between the sampling points, within each of the sites. Using a
0.5m × 0.5m wooden quadrat, the density of E. crassipes per
square metre was determined by counting the number of offshoot plants within the quadrat. The number of juveniles (newly developing shoots) within the population was also
determined. The sampled plants from each quadrat (0.25m2)
were chopped into small pieces, packed in paper bags and
dried in an oven at 80oC to constant weight. The phytomass of
senesced plants was also determined. The average dry weights within the quadrats were obtained and computed to dry weights per square meter.
Total suspended solids (TSS) determination
TSS determination followed the standard procedures as given
by APHA 2005. A known volume of 100 - 200 cm3 of the
integrated water samples was filtered through pre-weighed What man GF/C Glass micro-fibre filters (0.6–0.7 µm pore
size, 47mm diameter circles) that had been dried at 95 5 °C to
TSS (mg l-1) = (Wc-Wf) X 106) V-1 ...equation 1
Where: TSS = Total Suspended Solids, Wf = Weight of pre-dried filter in grams and V = Volume of water sample used in ml
Wc = Constant weight of filter + residue (all in grams)
Nutrient analysis
Filtered samples were used to colorimetrically analyse PO4-P,
NH4-N, NO2-N and NO3-N following the standard procedures
given by APHA 2005. GENESYS® 10 uV (ver. 2.001)
scanning spectrophotometer was used. Soluble reactive phosphorous was determined using the ascorbic acid method, while total phosphorus (TP) was determined by first carrying out persulphate digestion of unfiltered water samples followed by phosphate analysis using the ascorbic acid method.
Phenol-hypochlorite method was used to determine NH4-N while
determination of NO2-N was carried out using the reaction
between sulfanilamide and N-Naphthyl-(1)-ethylendiamin-dihydrochloride. Sodium-salicylate method was used to
analyze NO3-N.
Data analysis
Statistical tests and data analysis were done using SigmaStat version 3.5 graphics Software. The data on physico-chemical
parameters (pH, EC, DO, temperature, NO3-N, NO2-N, NH4-N,
PO4-P, TP, TSS and Secchi depth) were computed for all the
stations and months to find their mean values. The data was checked for normality prior to use of parametric statistical tests. One-way ANOVA was used to compare means recorded at different sampling dates and sites for the various variables and different means separated using Least Significance Difference (LSD) as the Post Hoc test. Pearson’s correlation was used to compare the relationship between the following parameters; water hyacinth phytomass density and the physico-chemical characteristics of water (DO, TSS, electrical conductivity, temperature and nutrient concentration), using data from Malewa and WWT sites. In all the analyses, 95% level of significance was used as the critical point (P= <0.05).
RESULTS
Variation of physico-chemical parameters between the study sites
The values of physico-chemical parameters in the open water
[image:3.595.305.561.325.391.2]site varied from those in the sites with water hyacinth (Table 1).
Table 1. TSS, secchi depth, DO, EC, pH and temperature for the sampling sites
Parameter WWT Malewa Open water
TSS (mg/ L) 51.13± 14.73 73.87±36.96* 26.78±15.90 Secchi depth (cm) 25.20 ± 6..53 26.90±8.16 58.50±25.86*
DO (mg/L) 2.19 ± 1.07 2.79±1.91 6.17±1.11*
EC (µS/ cm) 320.25± 69.33* 200.56±39.04 243.12±29.34
pH 6.16-8.10 5.50-8.25 6.85-9.18*
Temperature (°C) 20.94± 0.41 20.51±0.85 21.29±0.55* Values are means ± standard deviations except for pH which is given as ranges. Asterisks indicate the highest mean values.
The secchi depth values for the open water were significantly higher than for Malewa and WWT sampling sites, while TSS concentration was lower in open water (F= 9.06 and 13.57 and P< 0.05). The average temperature was higher in the open water than in Malewa (F= 3.790, 2.650 and P< 0.05). The electrical conductivity for the WWT station (320.25±69.33 µS/ cm) was higher than in the open water (243.20±29.34 µS/ cm) and Malewa (200.56±39.04 µS/ cm) sampling sites (F=, 15.352, P< 0.05). The dissolved oxygen concentration was significantly higher in the open water as compared to WWT and Malewa (F= 23.03, P< 0.05). The Malewa site recorded the
highest mean concentration of TP (0.149 mg/l), NO3
(0.111
mg/l) and NO2-N (0.009 mg/l). The highest mean
concentrations of NH4-N (0.080 mg/l) and PO4-P (0.025 mg/l)
were obtained in the open water site (Table 2). Total phosphorous showed significant variation between Malewa and the open water sampling sites with higher values recorded in the former (F= 3.790, 2.650 and P< 0.05). In the three
sampling stations, the mean values for PO4-P, NO3-N, NO2-N
[image:3.595.30.298.674.745.2]and NH4-N showed no significant difference.
Table 2. Nitrogen and Phosphorus concentrations for the sampling sites
Parameter WWT Malewa Open water
NH4-N (mg/l) 0.016±0.057 0.048±0.029 0.080±0.094*
NO2-N(mg/l) 0.003± 0.002 0.009±0.009* 0.006±0.009
NO3-N (mg/l) 0.086± 0.051 0.111±0.108* 0.097±0.087
PO4-P (mg/l) 0.022±0.038 0.019±0.012 0.025±0.035*
TP (mg/l) 0.136±0.090 0.149±0.094* 0.075±0.033 Values are means ± standard deviations. Asterisks indicate the highest mean values.
Temporal variation of physico-chemical parameters in the study sites
TSS concentration, secchi depth, temperature, electrical conductivity and dissolved oxygen concentration in the study sites showed significant variation during the five months of study. Water clarity and turbidity showed variation over time showing gradual increase in turbidity from the dry period (September-October) to the rainy season (November-December) as in Table 3.
The secchi depth readings in January were significantly higher than in September, October and November in the Malewa site and significantly lower in December than in October at the WWT site (F= 25.377, P< 0.05). In the open water, secchi depth readings were significantly higher in December and January as compared to September, October and November. The TSS concentrations did not show significant temporal variation in the open water and WWT sites but was significantly higher in December than November in Malewa (F= 4.215, P< 0.05). In October and December, TSS concentration was significantly higher in Malewa than WWT. Water temperature in the open water was lowest in January while in Malewa and WWT sites, temperature was significantly lower in November than in October and September (F= 3.584, P< 0.05). The values for electrical conductivity reduced from September to December in the study sites.
Table 3. Temporal variation of TSS, secchi depth, temperature, EC, DO and ranges for pH in sampling sites
Parameter Site September October November December January
TSS (mg/l) WWT 47.28±14.42 36.06±7.08 64.89±11.17٭ 49.33±3.84 56.22±10.54
Malewa 66.06±32.36 76.73±1.51 51.89±13.50 94.22±51.67٭ 78.83±35.75 Open water 38.67±5.18 41.17±7.25٭ 31.72±8.84 12.28±10.69 9.61±1.67
Secchi depth (cm) WWT 29.50±5.5 31.00±6.00٭ 24.00±1.00 17.00±1.00 24.50±1.50
Malewa 23.50±6.50 19.33±16.56 21.50±5.50 24.00±3.00 37.50±2.50٭ Open water 37.50±7.50 40.00±1.20 47.50±7.50 69.50±14.50 99.67±14.41٭
Temperature (° C) WWT 21.38±0.39٭ 20.74±0.19 20.54±0.19 21.27±0.10 20.79±0.06
Malewa 20.58±0.14 21.20±1.40٭ 19.99±0.66 20.54±0.19 20.23±0.03 Open water 21.82±0.18٭ 20.72±0.44 21.55±0.09 21.41±0.54 20.60±0.45
EC (µs/cm) WWT 420.42±43.38٭ 342.92±14.88 313.50±10.75 234.99±8.81 289.17±2.75
Malewa 212.87±15.54 219.84±25.73 173.01±22.12 153.59±1.57 245.06±6.58٭ Open water 267.94±12.92٭ 258.20±0.82 254.94±6.64 191.48±0.83 243.10±1.49
Oxygen (mg/l) WWT 2.52±0.42 2.14±0.69 0.98±0.58 1.61±0.31 3.64±0.23٭
Malewa 4.03±1.93٭ 1.31±0.91 2.56±2.28 3.41±1.07 2.58±1.15
Open water 6.34±0.23 7.57±0.16٭ 6.22±0.63 4.59±0.32 6.06±0.63
pH WWT 7.47-7.64 6.8-7.95 6.40-7.45 6.40-6.80 7.20-8.10٭
Malewa 7.48-7.87 7.00-7.58 5.50-6.58 6.15-6.69 7.50-8.25٭
[image:4.595.35.560.340.475.2]Open water 8.61-9.18٭ 8.50-9.14 6.96-8.72 6.85-8.80 7.60-8.66 Data presented as means ± standard deviations. Asterisks indicate the highest mean values and range values.
Table 4. Correlation matrix between water hyacinth density, live biomass and senesced biomass and the various physico- chemical parameters measured in the lake
Juv. HD SB NO3-N NO2-N NH4-N SRP TP TSS SD DO Temp. EC
HD 0.761* 0.166 -0.180 0.197 0.458 0.430 0.325 0.760* 0.014 -0.676* 0.095 0.232 -0.495
Juv. _ -0.055 -0.423 0.539 0.812* 0.658* 0.689* 0.659* 0.006 -0.726* -0.245 0.359 -0.721*
LB _ _ -0.370 -0.453 -0.357 -0.305 -0.068 0.306 0.313 -0.124 -0.595 -0.340 -0.326
SB _ _ _ -0.003 -0.497 0.373 -0.488 -0.461 -0.367 0.361 -0.703* 0.324 0.747*
NO3-N _ _ _ _ 0.484 0.321 0.588 -0.173 0.054 -0.441 0.333 0.326 -0.052
NO2-N _ _ _ _ _ 0.359 0.592 0.424 0.033 -0.439 -0.546 0.550 -0.565
NO4-N _ _ _ _ _ _ -0.184 0.106 -0.349 -0.100 -0.078 0.423 0.112
SRP _ _ _ _ _ _ _ 0.120 -0.058 -0.330 -0.323 0.165 -0.414
TP _ _ _ _ _ _ _ _ 0.254 -0.624* 0.023 -0.034 -0.718*
TSS _ _ _ _ _ _ _ _ _ -0.639* -0.060 0.033 -0.332
SD _ _ _ _ _ _ _ _ _ _ -0.032 -0.195 0.718*
DO _ _ _ _ _ _ _ _ _ _ _ 0.085 0.105
Temp. _ _ _ _ _ _ _ _ _ _ _ -0.035
EC _ _ _ _ _ _ _ _ _ _ _ _
DO= dissolved oxygen; EC= electrical conductivity; LB= live hyacinth biomass; HD= hyacinth density; Juv. = number of juveniles; SB= senesced hyacinth biomass
*Correlation is significant at P< 0.05, (2 tailed, N= 20)
Figure 1. Map of Lake Naivasha; study area
[image:4.595.108.485.521.730.2]The highest EC mean value (420.42 µS/cm) was recorded in September at WWT and the lowest (153.59 µS/cm) in December at Malewa (Table 3). November and December had significantly lower electrical conductivity values than September, October and January at the WWT and Malewa sites. In the open water site, the electrical conductivity value for December was significantly lower than for September, October, November and December (F= 46.990, P< 0.05). Dissolved oxygen concentration and pH ranges in the lake also showed variation during the study. The lowest pH ranges were recorded in November and December (Table 3). In the WWT
sampling site, dissolved oxygen concentration was
[image:5.595.35.290.331.479.2]significantly higher in January than in November and December (F= 13.225, P< 0.05). In the Malewa site, dissolved oxygen concentration was significantly lower in October than in September and December while in the open water site, December had significantly lower values than October, September and November (F= 13.225, P< 0.05). During the month of December, dissolved oxygen concentration in the WWT site was significantly lower than in Malewa (F= 13.225, P< 0.05). Phosphorous concentrations showed significant variation in the lake during the five months of study as shown in Figure 2 and 3.
[image:5.595.310.557.394.545.2]Figure 2. Mean temporal variations of TP concentrations in the study sites
Figure 3. Mean temporal patterns of PO4-P concentrations in the
study sites
The concentrations of TP in December were significantly
higher than in the other four months in the Malewa site (F= 5.693, P< 0.05). At the WWT site, TP concentrations in
November, December and January were significantly higher than in September and October (F= 5.693, P< 0.05). During December, the TP concentration at Malewa was significantly higher as compared to WWT and open water sites (F= 5.693,
P< 0.05). The concentration of PO4-P in December was
significantly higher than in the other four months at the WWT site (F= 2.096, P< 0.05). Malewa showed no temporal variation
with regard to PO4-P concentration while in the open water;
PO4-P concentration was higher in November than in
December and January. During December, PO4-P
concentration in the WWT site was higher than in Malewa and open water (F= 2.096, P< 0.05).
The concentrations of NO3-N, NO2-N and NH4-N varied
significantly over time. At the Malewa site, higher
concentrations of NO3-N and NO2-N were recorded in
November and December as compared to September, October and January (F= 3.441, 3.259 and P< 0.05). The concentration
of NO3-N at the WWT site was significantly higher in
December than January while at the open water site, September and October recorded higher values than January (F= 3.441, P< 0.05). The open water site had a significantly higher
concentration of NO2-N in December and January as compared
to September, October and November (F= 3.259, P< 0.05).
Malewa site recorded a higher concentration of NO2-N than
WWT and open water sites in December (F= 3.259, P< 0.05).
The results for temporal variation of NO3-N and NO2-N are as
[image:5.595.35.289.527.683.2]indicated in Figures 4 and 5 respectively.
Figure 4. Temporal mean variation of NO3-N in the study sites
Figure 5. Temporal mean patterns of NO2-N in the study sites
[image:5.595.313.553.578.722.2]NH4-N tended to decline over the dry season at all sites, increasing in December, particularly at the Open Water site
(Figure 6). The concentration of NH4-N did not show
significant variation in the Malewa site but was higher in December than in October, November and January at the WWT and open water sites (F= 5.196, P< 0.05). During
December and January, the concentrations of NH4-N at the
[image:6.595.307.555.75.245.2]open water site was higher than in Malewa and WWT sites (F= 5.196, P< 0.05).
Figure 6. Mean variation of NH4-N concentration in the lake over
time
Water hyacinth density and biomass in the WWT and Malewa sampling sites
Significant temporal variations in the population densities, number of juveniles and biomass of water hyacinth at both sites were recorded although there was little variability between the sites themselves. The mean values of water hyacinth live biomass and senesced biomass were not statistically different between the sites (t=0.190, P>0.05) sing nor were there statistical differences (P >0.05) in the mean values for population density and number of juveniles between the sites. There were differences between sites in the patterns of variability over time in numbers of juveniles (Fig. 7). The proportion of juveniles in the population increased from 8% and 6% in September to 84% and 68% in December in January in the WWT and Malewa sites respectively (Fig. 7, 8). The number of juveniles increased at both sites from November reaching maxima in December (WWT) and January (Malewa) (Fig. 7).
[image:6.595.38.291.168.315.2]Figure 7. The population of juvenile water hyacinths in WWT and Malewa site over time
Figure 8. The population of adult water hyacinths in WWT and Malewa site over time
The adult population density decreased from 60/m2 in October
to <30/m2 in December at the Malewa site and then increased
slightly, but adult densities at WWT were highly variable with
peak densities of over 60 plants/m2 in November and January
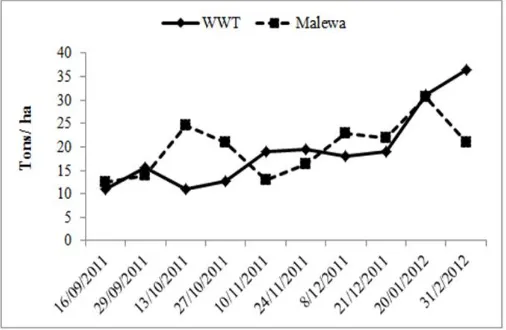
[image:6.595.309.562.382.547.2](Fig. 8). The biomass of water hyacinth also showed significant temporal variation in both sites where a general doubling in biomass occurred between November and January (Fig 9).
Figure 9. Temporal variation of water hyacinth live biomass (dry weight) in WWT and Malewa sites
[image:6.595.150.548.593.748.2]Figure 10. Temporal variation of water hyacinth senesced biomass in WWT and Malewa sites
Highest biomass over the study period was recorded at Malewa in January and WWT in February. Senesced biomass also varied significantly within the two sites (Malewa and WWT) during the study period. In WWT, the highest biomass (4.5 tonnes/ ha dry weight) was obtained in September while in Malewa, November produced the 4.3 tonnes/ ha dry weight (Figure 10). At Malewa, senesced biomass was highest in November, with September also recording a significantly higher value than December (F= 16.667, P< 0.05). Senesced biomass at the WWT site was lowest in November and December and highest in September (F= 16.667, P< 0.05). In November and January, Malewa recorded higher values of senesced biomass than WWT while in October, the WWT site had a significantly higher senesced biomass as compared to Malewa (F= 16.667, P< 0.05).
Correlations between water hyacinth population, biomass and physico-chemical parameters in the WWT and Malewa sites
The correlations between water hyacinth density, live biomass and senesced biomass and the various physico-chemical parameters measured in the lake are shown in Table 5. The results indicate that water hyacinth population density had significant positive correlations with the number of juveniles and concentration of TP but a negatively correlated with secchi depth (r = 0.761, 0.760 and -0.676, P < 0.05). The number of juveniles had a positive correlation with the concentrations of
NO2-N, NH4-N, PO4-P and TP and negatively with secchi
depth and electrical conductivity (r = 0.812, 0.658, 0.689, 0.659, -0.726 and -0.721, P < 0.05). The results also indicated that dissolved oxygen concentration significantly decreased with an increase in water hyacinth live biomass (r = -0.595, P < 0.05). Hyacinth senesced biomass had significant negative correlations with dissolved oxygen concentration but correlated positively with electrical conductivity (r = -0.908 and 0.747, P < 0.05). Secchi depth showed negative correlations with TSS and TP concentrations but correlated positively with electrical conductivity (r = -0.639, -0.624 and 0.718, P < 0.05). Negative correlation occurred between TP concentration and electrical conductivity (r = - 0.718, P < 0.05).
DISCUSSION
Spatio-temporal variation of physico- chemical parameters
The results on spatio-temporal variation of physico-chemical parameters concur to a large extent with what has been documented from other studies. The high TSS concentration in Malewa was due to the fact that Malewa River transports suspended sediments into the Lake from upstream erosion
during rainfall events. Kitaka et al. (2002) and Bercht et al.
(2006) noted that the inflow of rivers (Malewa and Gilgil) at the northern end of the lake may contain a large amount of sediment. The significantly high level of total suspended solids and low secchi depth in Malewa and WWT sites as compared to open water was also be due to continuous input of fragments of decaying water hyacinth detritus into the water column. It was observed that roots and leaves were constantly decaying as
the plants senesced and replaced by new daughter plants. Suspended solids also get attached to the dangling roots of hyacinth hence get released when the roots are disturbed.
Mironga et al. (2012) found out that the TSS concentrations in
sites with hyacinth (92.48±4.00 mg/l) were significantly higher than in the open water (54.00±5.85 mg/l) in Lake Naivasha. This compares with a study of hyacinth infested pools in Florida, by Timmer and Weldon (1966) who noted that natural growth of water hyacinth added debris to water and allowed water colouring chemicals to leach into the water there by increasing turbidity and limiting visibility to about 0.46m.
Water temperature was considerably lower is the sites with water hyacinth mats than in open water. Water hyacinth shaded the water from direct radiation by sunlight, hence reduced its penetration into the water column and subsequent warming up. Electrical conductivity was significantly higher in WWT than in the other two sites even though the levels of dissolved nutrients showed no significant differences between the sites. It is possible that the high electrical conductivity at the WWT station may have been due to other ions which were not determined during this study and have electrical conductivity potential and are not taken up actively by plants and remain within the water column.
Low values of dissolved oxygen and lower pH ranges in water hyacinth infested sites could have been due to a variety of
factors. According to Bianchini et al. (2008), the
decomposition of plant detritus may raise the oxygen demands. The current study showed that water hyacinth detritus had
mean biomass (dry weight) of 0.288 and 0.343 Kg/ m2 for the
WWT and Malewa sites respectively. This showed that there was organic matter raindown from senescing plants, leading to
oxygen consumption by bacterial respiration. Algal
photosynthesis is limited beneath water hyacinth mats, and hyacinth by being a free-floating macrophyte does not release oxygen into the water as do phytoplankton and submerged vegetation, resulting to decrease in dissolved oxygen
concentration (Meerhoff et al., 2003). Gherardi et al. (2011)
also noted that the dense mats formed by these invasive floating plants lower oxygen concentration by blocking the air-water interface. The dense mats reduce atmosphere-air-water column interaction and mixing there by limiting water aeration and distribution of oxygen. Low pH values within water
hyacinth sites may have been due to presence of free CO2
within the water column which results from aerobic breakdown
of organic matter. Mironga et al. (2012) reported that free
carbon dioxide was significantly higher in water hyacinth
infested areas (26.45±1.02 mgL-1) than in clear open water
(12.86±1.92 mgL-1). These values are way more than < 8 mg/l
of free CO2 documented by Indian Council of Agricultural
Research, (2006) for ideal freshwater systems. Other studies have also shown that dissolved oxygen concentration and pH ranges tend to decline in the water column under water
hyacinth mats. Mironga et al. (2012) study which was carried
out in Lake Naivasha between October, 2003- November, 2004 showed that dissolved oxygen was significantly lower in the
water hyacinth infested areas (1.96±0.71 mgL-1) when
compared with open water (5.98±0.85 mgL-1). Rommens et al.
(2003) recorded low oxygen concentration and low pH in sites with water hyacinth than in limnetic sites or littoral sites
without water hyacinth in Lake Chivero, Zimbabwe. Similarly,
Toft et al. (2003) reported that water below water hyacinth
mats in Sacramento-San Joaquin River, California had lower
dissolved oxygen concentrations less than 5 mg L-1. High
concentration of total phosphorus in the sites with water hyacinth was probably due to continuous input of mineralized phosphates from water hyacinth detritus as well as leachates from the senescing plants. However, the level of dissolved nutrients was not significantly different between the three sites despite the northern shores receiving more nutrients through rivers inflow. This can be explained by the fact that most of the N and P inputs into the lake are in particulate form. Similarly,
Kitaka et al. (2001) obtained a very strong significant
correlation between TSS and PP (R2= 0.97), inferring that most
phosphorus was transported bound in suspended soil particles.
Kitaka et al. (2002) also indicated that phosphorus for instance,
enters the lake bound to the sediment particles after which it is
reduced by sedimentation but also transformed as PO4-P and
turned into biologically available form for phytoplankton and macrophytes.
The results on temporal variations indicate that physico-chemical characteristics and nutrients concentrations showed significant variation during the five months of the study. The months of September and October were relatively dry but rains began towards the end of October, increased in November to December leading to high lake level. In January there was no rain but the lake level remained high. Water in Malewa was more turbid in October and December than in the other study sites; hence, indicating the high contribution of River Malewa in the input of total suspended solids into the lake during the rainy season. The electrical conductivity of water in the three sampling sites was low during the rainy season due to dilution of the lake by rain water. Dissolved oxygen concentration and pH ranges were also significantly lower in December in the three sites. In addition to the decomposition of senescing water hyacinth, the heavy rains brought into the lake large amounts of organic matter through the river inputs and surface runoff. These raised oxygen demand there by lowering the concentration of dissolved oxygen and increased the
concentration of CO2 leading to low pH in November and
December.
It’s important to note that in December, Malewa site had
significantly high concentrations of total phosphorus, NO3-N
and NO2-Nthan WWT and open water sites. The input through
runoff from the catchment and inflowing rivers during the rainy season may have contained organic non ionized particles,
and nutrients; hence, the high values of total phosphorus, NO3
-N and -NO2-Nconcentrations. Even though the WWT site also
recorded significantly high amounts of total phosphorus and
NO3-Nin December than in the other months, Malewa River
inlet proved to be a major contributor of TSS, NO3-N and TP
into the lake than the Municipal wastewater treatment plant.
These results confirm earlier findings by Kitaka et al. (2002)
who noted that evidence from the Malewa River input was adequate to explain the increased trophic state of the lake without citing any additional nutrient inputs from urban or horticultural sources. They found out that the Malewa River contribution of phosphorus led to total phosphorus loading of
1.4 g m−2 lake surface ann−1 in the very wet period compared to
0.2 in the ‘normal’ and a mean phosphorus export coefficient
of 1.54 Kg ha-1 yr-1 (Kitaka et al., 2001). In the current study,
the concentrations of nutrients in Malewa generally increased
during the rainy season, even though the rise in PO4-P and
NH4-Nconcentrationswas not statistically significant. The TP
concentrations were much higher than the findings by Kitaka
et al. (2002). They recorded means of 83.9±33.2 and 54.2±18.0
µg/l in Malewa and open water respectively, comparative to 332±127 and 101±88 µg/l in the current study. This further confirms the catchment’s contribution to the trophic status of the lake and that it has probably worsened over the years. The
WWT site had significantly high concentrations of NH4-N and
PO4-P in December than Malewa and open water. Sub-surface
flow of wastewater from the oxidation ponds of the Naivasha Municipal wastewater treatment plant during the rains may have contributed to the input of mineralized nitrogen and phosphorus into the lake. This coupled with very low dissolved oxygen concentrations (below 2 mg/l) at that time may have favored these reduced forms of nitrogen and phosphorus. The
decline in the concentrations of PO4-P, NO3-Nand NH4-N after
December in Malewa and WWT sites may have been due to active uptake by the newly produced water hyacinth. It was noted that the total density, population of juveniles and biomass of water hyacinth were highest during January, showing that the population was actively growing, in response to increased nutrient levels in the lake. This view is supported by Pinto-Coelho and Greco (1999) who noted that water hyacinth has the potential to significantly reduce nutrient concentrations in a water body, although this is highly dependent of the extent of its cover and density. In the open
water, the concentrations of NH4-N, NO2-N and PO4-P
increased in November and December. The levels of NO2-N
and NH4-N remained high in January after the rains. This can
be attributed to lack of robust nutrient absorbers such as water hyacinth in the open water site. It is notable that the levels of nitrogen and phosphorus in the lake rose during the rainy season. This view is supported by Njuguna (1982) who noted that peaks in nutrient concentrations in Lake Naivasha occurred during or immediately after the two rainy seasons of March-May and October-December.
Water hyacinth density and biomass in the lake
There was no significant variation in the mean values of water hyacinth population density, number of juveniles and biomass between Malewa and WWT sampling sites. This was due to relatively similar physico-chemical characteristics (more so nutrients) within the two sites. However, significant temporal variations of water hyacinth density and biomass were observed in Malewa and WWT sites. It is worth noting that the number of hyacinth juveniles at the WWT site was higher than that of Malewa in December (wet period). During that time, the
concentrations of NH4-N and PO4-P were also higher than in
Malewa. However, in January the number of water hyacinth juveniles was higher in Malewa than WWT, corresponding to
high levels of NH4-Nat Malewa. This infers that NH4-N played
WWT site than Malewa. The increase in the density of the water hyacinth population in response to increased levels of nutrients in the lake became evident within the second month of the rains (December). The results obtained for water hyacinth live biomass in Malewa and WWT showed that January had significantly higher values than the preceding four months. A similar trend was reported by Kariuki (1993) during his study in 1992, suggesting that the growth period in Lake Naivasha corresponds to a time when nutrient levels in the water are high especially a few weeks after the rains. However, the senesced biomass was significantly higher in September than in December and January in both sites. This can be explained by the fact that there was high biomass of detritus in September corresponding to the dry season associated with low lake water level coupled with low nutrient influx into the lake. During that time, much of the standing biomass was made up of mature plants, most of which were senescing, with few juveniles observed.
The results on water hyacinth biomass and density obtained in this study showed disparity with the outcome of other studies. Kariuki (1993) carried out a study in 1992 and reported lower densities of 34.3±5.35 and 33.0±6.32 plants per square meter during the rainy and dry seasons respectively in Lake Naivasha. The densities recorded in the current study were 50
plants/ m2 during the dry period and a high value of 98 plants/
m2 a month after the rains. A minimum seasonal biomass of
0.18±0.039 kg m-2 was recorded by Kariuki (1993) at the end
of the dry period comparatively to 1.32±0.27 kg m-2 during this
study. It is important to note that during that time (1992), the
coverage of water hyacinth in the lake was 5 km2, lower than it
was during this study where water hyacinth had covered
approximately 28km2 since 2010 (Harper et al., 2011). The
higher density and biomass recorded in the current study indicate that the weed has established itself and continues proliferate. It is also a sign that the eutrophic state of the lake has probably increased since 1992. During the current study in 2011, especially in November, December and January, several beaches and landing sites were covered with extensive mats, however, the area covered was not determined. Almost the entire Northern shores, Crescent Island, Kamere beach and several parts of the open water in the Lake were covered by water hyacinth mats. In January 2012, the problem intensified, rendering navigation almost impossible. Extensive migratory mats were observed in the pelagic zone rendering navigation and fishing very difficult. This clearly indicates that water hyacinth growth and multiplication had increased during the rainy season. The role of wind in breaking off and spreading huge mats of water hyacinth into the open water cannot be ruled out.
It appears that nutrients play an important role in seasonal variation of water hyacinth biomass in Lake Naivasha as growth and reproduction increased with increased nitrogen and phosphorous levels. Interestingly, even with comparable nutrient levels to other systems, water hyacinth biomass in Lake Naivasha is still lower than what has been recorded in
other studies. Sitoki et al. (2010) reported 0.057±0.007 PO4-P
and 0.099±0.036 NO3-N mg/l in Winum Gulf, Lake Victoria
Balirwa (2009) reported 0.030 mg/l PO4-P in Lake Victoria,
Uganda. Higher biomass of 2.4-4.9 Kg m-2 was reported by
Amoding et al. (1999) in Lake Victoria. These results had been
obtained at a time when control efforts were going on in the
lake. Balirwa et al. (2009) reported higher reproductive index
of 3 to 4 daughter plant per mother plant in the Nakivubo Channel of Inner Murchison Bay, which drains Kampala area and empties into Lake Victoria. The highest reproductive index in Lake Naivasha was 1 to 2 daughter plants per mother plant. IUCN (2003) also reported that the rate of water hyacinth growth in Lake Naivasha was small compared with its invasion and persistence in Lake Victoria, the Sudd and elsewhere throughout the tropics and sub-tropics. It was further noted that individual plant biomass was low and that the plant had not colonized the open lake in large mats. Lower production rates by water hyacinth in Lake Naivasha can be attributed to low temperature in the lake.
To show the influence of temperature on the growth of water
hyacinth, Knipling et al. (1970) reported a parabolic
relationship between temperature and growth rate of water hyacinth, with growth tailing off quickly after the optimum temperature of 30 ºC. Imaoka and Teranishi (1988) suggested that the intrinsic growth rate, r, increases exponentially with ambient temperatures in the range of 14-29 ºC. The mean monthly temperature in Lake Naivasha ranged between 20-21.8
o
C in the lake and has been reported to go as low as 6 ºC at night. On the contrary, surface water temperatures range between 23.5° C and 29.0°C in Lake Victoria (Osumo, 2001). Whilst it has been shown that temperature affects the growth of water hyacinth, it is not clear how climate change may influence the dynamics of weed proliferation especially in Lake Naivasha.
Conclusion
The water column below water hyacinth mats had three times lower dissolved oxygen concentration as compared to the open water, with values below 1mg/l recorded in some cases. In the sites with water hyacinth, water transparency was two times lower, with twice as high total phosphorous concentration compared to the open water. Increase in lake level during the rainy season led to an increase in the density and live biomass of water hyacinth. The number of daughter plants increased significantly during the rainy season indicating high multiplication rates. It would be important to investigate the influence of seasonality on the loading of nutrients and how this affects water hyacinth phenological cycles in the lake. More studies should be done on the lake to find out how much nutrients is locked up in the water hyacinth biomass in the lake and subsequent release of those nutrients into the water column and sediments upon senescence.
Acknowledgement
We owe an immense recognition and gratitude to EOIA Naivasha (Earth Observation and Integrated Assessment) for sponsoring this research work. The data collection wouldn’t have been possible without the assistance of Kenya Fisheries Department, Naivasha staff in particular Mr. Muchai and Mr. Macharia. Much regards go to Egerton University, Department of Biological Sciences and the Limnology and Wetland
Ecosystems (LWE) program for providing us with laboratory space and equipment to carry out this research study.
REFERENCES
Amoding, R.M., Bekunda, M.A., and Woomer, P.L. 1999. Bioproductivity and decomposition of water hyacinth in
Uganda. African Crop Science Journal, 7: 433-439.
APHA, (American Public Health Association). 2005. Standard
methods for the examination of water and wastewater (21st
Edition). Washington D.C. APHA.
Balirwa, J.S., Wanda, F.M., and Muyodi, F.J. 2009. Impacts of Water Hyacinth and Water Quality Change on Beneficial Uses of Lake Victoria, Uganda. 13th World Lake Conference, Wuhan, China, 1-5 November 2009.
Bercht, R., Odada, E.O., and Sarah, H. 2006. Lake Naivasha
experience and lessons learned brief. ITC, Enscede,
Netherlands.
Bianchini, J., Cunha-Santino, M.B., and Peret, A.M. 2008. Oxygen demand during mineralization of aquatic
macrophytes from an oxbow lake. Brazilian Journal of
Biology, 68: 61-67.
Gaudet, J.J. and Melack, J.M. 1981. Major ion chemistry in a
tropical African lake basin. Freshwater Biology, 11:
309-333.
Gherardi, F., Robert, J.B., Mavuti, K.M., Pacini, N., Jonathan, G., Elena, T., and Harper, D.M. 2011. A review of allodiversity in Lake Naivasha, Kenya: Developing conservation actions to protect East African lakes from the
negative impacts of alien species. Biological
Conservation, 144: 2585–2596.
Gopal, B. 1987. Water Hyacinth, Elsevier, Amsterdam.
Guy, P. 2011. Shared risk and opportunity in water resources: Seeking a sustainable future for Lake Naivasha. WWF (World Wide Fund for Nature) report pp. 1-38.
Harper, D.M., Edward, H.J., Macharia, M.M., Mavuti, K.M and Upton, C. 2011. Lake Naivasha, Kenya: ecology,
society and future. Freshwater Reviews, 4: 89-114.
ICAR, (Indian Council of Agricultural Research). 2006.
Handbook of Fisheries and Aquaculture, New Delhi,
India: ICAR.
Imaoka, T. and Teranishi, S. 1988. Rates of nutrient uptake and
growth of the water hyacinth (Eichhornia crassipes
(Mart). Solms. Water Research,22: 943-951.
IUCN, EARP (International Union for Conservation of Nature, East African Regional Programme). 2003. Management of invasive species in waterbird habitat in Lake Naivasha, Kenya: a report on the restoration of wetlands that are migratory bird habitats, and that have been damaged by invasive weeds. Nairobi, Kenya: IUCN.
Joyce, J.C. 1985. Benefits of maintenance control of water
hyacinth. Aquatics, 7: 11-13.
Kariuki, F.W. 1993. Growth dynamics and primary production
of Eichhormia crassipes (Mart.) Solms in Lake Naivasha,
Kenya. Kenyatta University, Nairobi.
Kitaka, N., Harper, D.M. and Mavuti, K.M. 2002. Phosphorus inputs to Lake Naivasha, Kenya, from its catchment and
the trophic state of the lake. Hydrobiologia, 488: 73–80.
Kitaka, N., Harper, D.M. and Mavuti, K.M. 2001. Phosphorus status of a tropical shallow lake, Lake Naivasha, Kenya.
Limnologica., 27: 3811-3815.
Knipling, E.B., West, S.H., and Haller, W.T. 1970. Growth characteristics, yield potential and nutritive content of
water hyacinth. Proceedings of the Soil and Crop Science
Society ofFloridaConference 30: 51-63.
Mailu, A.M. 2001. Preliminary assessment of the social, economic and environmental impacts of water hyacinth in the Lake Victoria Basin and the status of control. In: Julien
MH, Hill MP, Center TD, Ding J. (eds.), Biological and
Integrated control of water hyacinth, Eichhornia
crassipes, Proceedings of the Second Global Working
Group Meeting for the Biological and Integrated Control of Water hyacinth. Beijing, China, 9-12 October 2000. ACIAR Proceedings No. 102. pp. 130-139.
Meerhoff, M., Mazzeo, N., Moss, B., and Rodriguez-Gallego, L. 2003. The structuring role of free-floating versus
submerged plants in a subtropical shallow lake. Aquatic
Ecology 37: 377-391.
Mireri, C. 2005. Challenges Facing the Conservation of Lake
Naivasha, Kenya. DAAD Summer School. Topics of
integrated watershed management. Siegen University, 89-98.
Mironga, J.M., Mathooko, J.M, and Onywere, S.M. 2012.
Effect of Water Hyacinth Infestation on the
Physicochemical Characteristics of Lake Naivasha.
International Journal of Humanities and Social Science, 2:
103-113.
Njuguna, S.G. 16th December 2002. Lake Naivasha in Kenya in
danger of extinction. The Nation newspaper, Nairobi, Kenya.
Njuguna, S.G. 1982. Nutrient productivity relationships in tropical Naivasha Basin Lakes. PhD Thesis, University of Nairobi, Kenya.
Osumo, W.M. 2001. Effects of water hyacinth on water quality of Winam Gulf, Lake Victoria. Final Project Report: Kenya Marine Fisheries Research Institute, Kisumu, Kenya.
Pinto-Coelho, R.M. and Greco, M.K.B. 1999. The contribution
of water hyacinth (Eichhornia crassipes) and zooplankton
to the internal cycling of phosphorus in the eutrophic
Pampulha Reservoir, Brazil. Hydrobiologia, 411: 115-127.
Rommens, W., Maes, J., Dekeza, N., Inghelbrecht, P., Nhiwatiwa, T., Holsters, E., Ollevier, F., Marshall, B., and Brendonck, L. 2003. The impact of water hyacinth
(Eichhornia crassipes) in a eutrophic subtropical
impoundment (Lake Chivero, Zimbabwe). I. Water
quality. Archiv. Fur. Hydrobiologie, 158: 373-388.
Schmitz D.C., Schardt, J.D., Leslie, A.J., Dray, F.A. Jr, Osborne, J.A., and Nelson, B.V. 1993. The ecological impact and management history of three alien aquatic
plant species in Florida. In McKnight BN (ed.), Biological
pollution: The control and impact of invasive exotic
species. Indianapolis: Indiana Academy of Science, Pp.
173-194.
Sitoki, L., Gichuki, J., Ezekiel, C., Wanda, F., Mkumbo, O.C., and Marshall, B.E. 2010. The environment of Lake Victoria (East Africa): current status and historical
changes. Int Rev Hydrobiogia, 95:209–223.
Timmer CE and Weldon LW. 1966. Annual report. Soil and Water Conservation Research Division. Southern Branch, ARS.USDA, Fort Lauderdale, Florida.
Toft, J., Charles, D., Simenstad, A., Jeffery, R., Cordell, R., and Lenny, G.F. 2003. The effects of introduced water hyacinth on habitat structure, invertebrate assemblages, and fish diets. Estuaries 26: 746–758.
Wahlquist, H. 1972. Production of water hyacinth and resulting
water quality in earthen ponds. Agricultural experiment
station, Alabama.
WWF 2011. Seeking a sustainable future for Lake Naivasha: shared risk and opportunity in water resources. Retrieved from http://www.wwf.de/fileadmin/fm-wwf/pdf_neu/lake_ naivasha_report_02_2011.pdf, 27 November, 2011.