A Survey of Intelligent Traffic Light Control Systems
Rahul Gala
Student MPSTME, NMIMS
Mumbai, India
Saurav Verma
Assistant Professor MPSTME, NMIMS
Mumbai, India
Umang Kumar
Student MPSTME, NMIMS
Mumbai, India
Harish Ojha
Assistant Professor VIT, Mumbai, India
Mumbai, India
ABSTRACT
Traffic congestion problem is a phenomenon on road networks that occurs as use increases, and is characterized by slower speeds, longer trip times, and increased vehicular queuing and contributes huge impact to the transportation system in the country.These TLC have limitations because it uses the pre-defined hardcode that does not have the flexibility of modification on real time basis. Due to the fixed time intervals of green, orange and red signals, the waiting time is more and the delay of respective light is not dependent on traffic. Thus, a car uses more fuel.
Through this paper we intend to present an improvement in existing traffic control system at the intersection using different techniques i.e. Intelligent Traffic Light Controller using Embedded System, Traffic Control System Based on Image Processing Technique, Intelligent Traffic Light Using RFID Technique. Existing automatic traffic control system at the intersection with pre-set timing signals is proved to be inefficient in comparison with these
Keywords
Traffic Control, Smart Lights, RFID
1.
INTRODUCTION
Fast transportation systems and rapid transit systems are nerves of economic developments for any nation. Mismanagement and traffic congestion results in long waiting times, loss of fuel and money. Growing numbers of road users and the limited resources provided by current infrastructures lead to ever-increasing traveling times. It is therefore utmost necessary to have a fast, economical and efficient traffic control system for national development. The ways to improve traffic flow and safety of the current transportation system:
a. Using embedded system.
This makes the use of Sensor Networks along with Embedded Technology. The timings of Red, Green lights at each crossing of the road will be intelligently decided based on the total traffic on all adjacent
roads. Thus, optimization of traffic light switching increases the road capacity and traffic flow and can prevent traffic congestions. Thus, saving fuel in the vehicles. The GSM cell phone interface is also provided for users those who wish to obtain the latest position of traffic on congested roads. This is a unique feature is very useful to car drivers to take an alternate route in case of congestion.
b. Using image processing technique.
The system is made more efficient with the addition of intelligence in term of artificial vision, using image processing techniques to estimate actual road traffic and compute time each time for every road before enabling the signal. System is clever enough to provide priority to authorized emergency vehicles with the help of GSM at a particular intersection.
c. Using IR sensors.
The system contains IR transmitter and IR receiver which are mounted on the either sides of roads respectively. The IR system gets activated whenever any vehicle passes on road between IR transmitter and IR receiver. A microcontroller controls the IR system and counts number of vehicles passing on road. The microcontroller also stores vehicles count in its memory. Based on different vehicles count, the microcontroller takes the decision and updates the traffic light delays as a result. The traffic light is situated at a certain distance from the IR system. Thus based on vehicle count, microcontroller defines different ranges for traffic light delays and updates them accordingly.
2.
EMBEDDED SYSTEM
List of problems to be solved
Heavy Traffic Jams
No traffic, but still need to wait
Emergency car stuck in traffic jam
Lack of Traffic Information to users
Conservation of Fuel and decrease in Air Pollution.
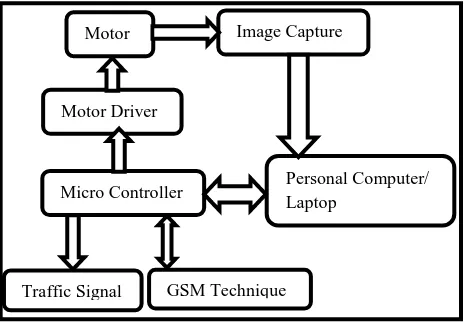
The proposed embedded System takes input from an infrared sensor arranged at the side of the road. The infrared sensor tells the traffic light about the presence of the vehicle and also the length of the queue. The ITLC receives input from all the sensors on all four roads of the junction and then based on these inputs, it calculates the green light time for each side. The author also talks about interconnecting the traffic lights so that the problem of congestion can be solved at the larger level rather than at just one junction. The author proposes that if all the traffic lights know about the congestion at other signals, the traffic can be re-routed to another route, hence avoiding congestion from occurring at same place.
Figure 1: Block Schematic of Intelligent Traffic Light Controller with GSM interface.
3.
IMAGE PROCESSING
TECHNIQUE
The proposed system aims to improve the efficiency of the traffic control system over the existing systems. The system is designed using image processing characterized by signal controlling. The functioning of the proposed system is based on traditional systems along with automated signal controlling. The system first captures the artificial vision of the traffic load on the road with the help of a digital camera. The digital camera is mounted on a motor so it can rotate 90 degrees to face the lane and easily capture the image. This rotation of the camera is controlled by a PC through a microprocessor. The image of the lane is processed using image processing techniques and an estimation of the traffic load is calculated.
Estimated traffic load on a particular lane is then used to calculate the time required for controlling of signal lights. The system calculates the time, every time and operates in a cyclic clockwise signal lights control. The maximum and minimum time limit is maintained in order to prevent over waiting of vehicles. Controls of the signal are routed through the microcontroller. Further, the emergencies are handled using GSM techniques. This is done by interrupting the normal functioning. The emergency set the priority and the lane that is requested is opened. Once the emergency is removed the system starts normal functioning. Figure.2 shows the block diagram of the proposed system and explanation as below.
A. Control of signal lights
The signalling is cyclic and in the clockwise direction that starts from the first road to the fourth road, sequentially. Applying image processing technique on the captured image, the estimated density is calculated and the time is set. Digital colour or monochrome camera is used to capture the image. The calculated time is then passed on to Microcontroller 89s52, 40 pin DIP with necessary RS232 interface. The signal light is operated by microcontroller through driver circuitry. The camera is mounted on a rotary platform at a sufficient height in order to get enough elevation for vision which is required to view predefined length of the vehicles. The rotation of the camera is done by a DC motor driven by microcontroller via driver circuit. This is shown in figure 2.
B. Emergency
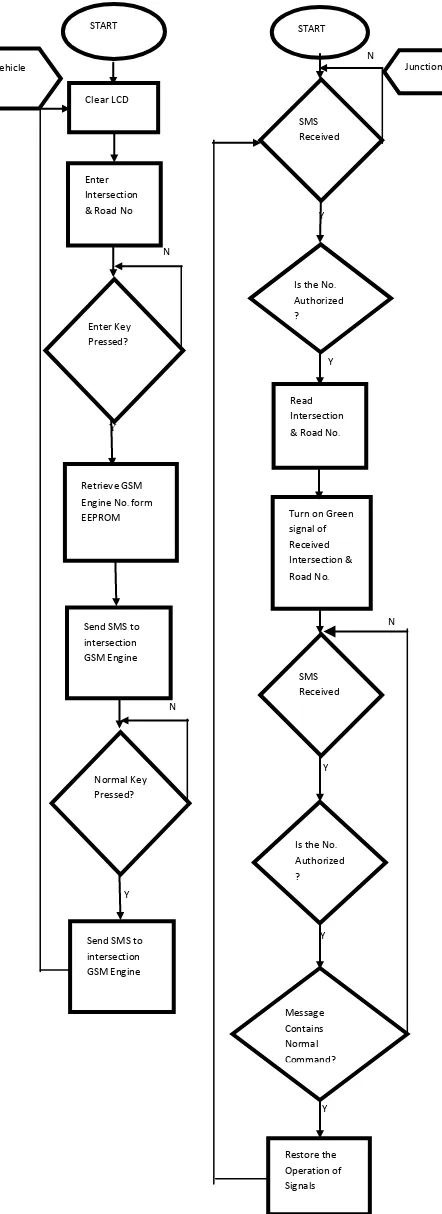
[image:2.595.61.294.70.248.2]Emergencies are handled using GSM technique. The authorized emergency vehicles like Police van, ambulance or fire trucks are given priority to cross the intersection first. This is possible after a request is sent through an SMS as it approaches at the intersection. The signal remains on till it crosses the junction and it is put off to resume the normal functioning by sending another SMS. Such an emergency handling can be seen in figure 3. There is a GSM transmitter at the end of the vehicle and a receiver at the intersection. To raise the priority correct lane number to intersection, need to be transmitted. In case if more than one emergency arises, the first come first serve mechanism is used to set the priority.
Figure 2: Block Diagram of proposed system based on image processing technique.
FUNCTIONING AND ALGORITHM: a) Normal Mode
The functioning of the lights is shown in Table 1. The signal is cyclic and is in clockwise direction. From the experiments, the minimal signal time set is found and that would be the time taken to cross the intersection 1.5 to 2 times for safety. The signal changes from C to D road with time set of 18 seconds. After 4 seconds, the emergency is detected and the signal goes green at road C. After the emergency, the normal operation continues.
b) Caution Mode
In caution mode, the system switches off the signal control and keep only the red light blinking to warn vehicles to slow down while approaching the intersection during night time and in afternoons. (If required in some cases only)for the time period that will be set experimentally. Night caution mode is on after 10 pm. Caution mode is started when the system detects and calculates less than minimum control for at least 3 turns of signal or it is on after the preset time. After the caution mode goes off the system returns to its normal mode which is at morning 7:30 am.
c) Image processing
The following steps include experimentally found out results along with simplified consideration in the processing of a captured image.
Motor
Motor Driver
ImaMotor
Image Capture
Personal Computer/ Laptop
GSM Technique Traffic Signal
[image:2.595.319.553.250.411.2]Figure 3 Emergency handling through GSM by sending SMS to raise priority
Table 1: Actual functioning of lights
d) Fixing the queue area:
The predefined queue length is L1 and road width gives the maximum area of the queue. The time required to clear the queue area is T and it will be the maximum time setting for the control of the signal at that intersection. This area is obtained by the camera mounted on the motor. Thus, L and T are found experimentally.
e) Region of interest (ROI):
The queue area is the region of interest and could be frozen by generating a cropped image of the empty road. The captured image is saved in matrix form Imn. The final cropped image Fmn is the product of Cmn. Refer figure 4.
f) Conversion to gray scale:
The captured image is converted into grayscale image. Grayscale image is again converted to binary. MATLAB functions rgb2gray(x), adapthisteq(x) and im2bw(x,0.3) are used.
g) Subtracting:
The cropped image of the scene is subtracted from the ROI to get area occupied by vehicle. This is achieved by carrying out AND operation on cropped image and ROI.
h) Time calculation:
The maximum time T is known. Now, in the above step after finding out the percentage occupancy, the percentage of T will be final time Tf, that would be applicable for the control of the signal. The final signal light is driven by the microcontroller for the calculated time.
4.
RFID SYSTEM
Several attempts have been made to make traffic light’s sequence dynamic so that these traffic lights operate according to the current volume of the traffic. such as inductive loop, magnetometer, infrared, acoustic, ultrasonic, visual camera, radar etc.
All the afore-mentioned technologies solve only a part of the problem of traffic management. Most of them do not deal with real-time traffic control, which may not conform to the forecast data on which these systems work. These systems treat an emergency vehicle as the ordinary which means no priority to ambulance, fire brigade or V.I.P vehicles. As a result, emergency vehicles stuck in traffic signal and waste their valuable time.
START
Clear LCD
Enter Intersection & Road No
Enter Key Pressed?
Retrieve GSM Engine No. form EEPROM
Send SMS to intersection GSM Engine
Normal Key Pressed?
Send SMS to intersection GSM Engine Vehicle
N N
Y
Y
Is the No.
Authorized ?
START
SMS Received
?
N
Y
Read Intersection & Road No.
Turn on Green signal of Received Intersection & Road No.
Y
SMS Received
?
Y
Is the No.
Authorized ?
Y
Message Contains Normal Command?
Y
Restore the Operation of Signals
[image:3.595.323.558.94.258.2]Radio Frequency Identification (RFID) is an emerging technology that will detect the congestion in real time and subsequently manage it efficiently to ensure smooth traffic flow. This system considers the priority of the different type of vehicles and also the density of traffic on the roads by installing RF reader at the road intersections. Radio frequency identification is a technique that uses the radio waves to identify the object uniquely. It is a technique that is widely used in the various application areas like medical science, commerce, security, Electronic toll collection system, access control, etc.
[image:4.595.56.275.236.440.2]There are three main components of RFID: RFID tag, RF Reader and Database.
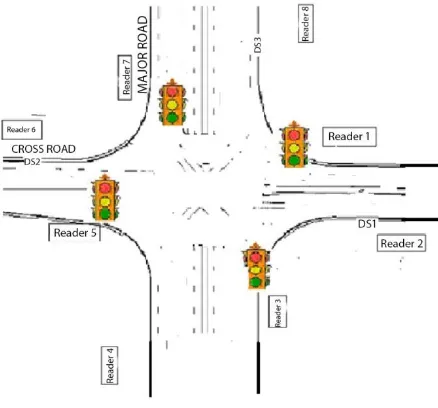
Figure 4: RFID traffic-controlled system. :
In the proposed work, each intersection contains 8 RFID readers. The road is divided into two lanes. Each lane has its RFID reader to track the vehicles passing through it. Each intersection point has its own database to store the information regarding the vehicles that passed from it with timestamp and traffic light. Every vehicle has a RFID enabled device that stores a vehicle identification number (VIN). Every vehicle has its unique VIN number that provides the information regarding the priority of the vehicle and type of the vehicle. With the help of VIN, we can uniquely identify the vehicle & its owner.
Vehicle Identification Number (VIN): In the proposed work RFID, tag will store a Vehicle Identification Number. This number is divided into 3 parts: First part represents the priority of the vehicles. Next part represents the type of vehicle and the last part represents the vehicle number. Priority: In the proposed work, different types of vehicles have the different priorities. The total vehicles are divided into 4 categories: First system category includes Ambulance, Fire Brigade vehicles, Police Vans and V.I.P vehicles. These vehicles have the highest priority. The second category includes the public and school & college buses. These buses need to reach their destination on time so these vehicles also need a fast service. The third category includes the car, motorcycles and scooters and the fourth category include the Heavy vehicles. Day time priority of 3rd category is high as compare to the 4th category but during night hours the priority of the heavy vehicles high.
The following given pseudo-code helps to generate an efficient algorithm to control the sequence of the traffic light according to the parameters discussed above.
While (true)
1. Store all lights in Queue
2. Sense the vehicles on different lights continuously 3. If a high priority vehicle is detected then
a. Send an emergency signal to center Traffic light controller.
b. Find the road corresponding to the reader that detect a high priority vehicle.
c. Set the corresponding traffic light Green 4. Else
5. For i=1 to 4
a. At decision point, dp Pick the traffic light Queue[i] a. At traffic i Count the number of vehicles & check type of vehicle.
b. If Emergency vehicle found then 1. Go to step 3.
c. Else follow steps d to f.
d. Find the priority of the different vehicle at traffic light i. e. Calculate the total sum according to Number of vehicle. f. On the basis of sum calculate the time for green signal. g. If any light doesn’t get it turn within the threshold time then,
1. Give the turn to that light. 6. End Loop.
7. End.
Thus after receiving the message from linked lights controller consider the factors like traffic density of the road, the priority of the vehicles and queue length and starvation factor to decide the term of the light to display green signal.
5.
COMPARISON
Technique 1 uses Inductive loops that can be placed in a roadbed to detect vehicles that pass over the loop, while more sophisticated sensors estimate the speed, length, and weight of vehicles and the distance between them. While this system works for traffic at all speeds, it does have the drawback of a high error rate in detection and transmission of traffic information. Other drawbacks include cumbersome installation of inductive loop devices, tedious maintenance and the improbability of managing traffic locally.
Another popular technology is, the usage of cameras and image processing as shown in technique 2. Here one or more cameras are installed so that all the objects on the road are visible. The optical data from both the visible and infrared spectrum as captured from the camera are studied. Performance of these methods is largely dependent on the quality of the geo referencing of overlapping images and the quality of the road database. The system is expensive too and the fuzzy algorithm is not fool proof.
6.
CONCLUSION
In the paper, there is a comparison of 3 intelligent traffic light control systems. All the techniques and their workings have been discussed briefly. The first technique uses inductive loops which can be placed on the roadbeds to detect vehicles passing through it. A further study can be conducted and implemented which may include calculation of more information about the vehicle and accordingly controlling the traffic lights.
by the camera. It was based on overlapping and geo referencing of the image captured.
Technique third is based on the RFID sensing. All the vehicles are provided with VIN and RFID tag. The information about the priority and VIN is stored in the tag. Also, there are RF sensors placed on the roads. The RF sensors sends the signal to the traffic control centre, which based on the priority changes the normal functioning of the signal. Also, the sensors smartly detect the number of vehicles and accordingly changes the time of green signal.
Hence, there are 3 techniques proposed which can smartly change the way of operation of traffic lights, which can solve the problems of never-ending traffic jams, air pollution, time wastage, information about traffic to drivers. It is most required in the metropolitan cities as the cities have these problems in abundance.
7.
REFERENCES
[1] RONG, Q. S., YAN, J. B., & GUO, G. Q. (2004). Research and Implementation of Clustering Algorithm Based on DBSCAN [J]. Computer Applications, 4.
[2] Verma, M., Srivastava, M., Chack, N., Diswar, A. K., & Gupta, N. (2012). A comparative study of various clustering algorithms in data mining. International Journal of Engineering Research and Applications (IJERA) Vol, 2, 1379-1384.
[3] Ester, M., Kriegel, H. P., Sander, J., & Xu, X. (1996, August). A density-based algorithm for discovering clusters in large spatial databases with noise. In Kdd(Vol. 96, No. 34, pp. 226-231).
[4] Chakraborty, S., & Nagwani, N. K. (2014). Analysis and study of Incremental DBSCAN clustering algorithm. arXiv preprint arXiv:1406.4754.
[5] Sander, J., Ester, M., Kriegel, H. P., & Xu, X. (1998). Density-based clustering in spatial databases: The algorithm gdbscan and its applications. Data mining and knowledge discovery, 2(2), 169-194.
[6] Borah, B., & Bhattacharyya, D. K. (2004). An improved sampling-based DBSCAN for large spatial databases. In Intelligent Sensing and Information Processing, 2004. Proceedings of International Conference on (pp. 92-96). IEEE.
[7] Erman, J., Arlitt, M., & Mahanti, A. (2006, September). Traffic classification using clustering algorithms. In Proceedings of the 2006 SIGCOMM workshop on Mining network data (pp. 281-286). ACM.
[8] Xu, X., Ester, M., Kriegel, H. P., & Sander, J. (1998, February). A distribution-based clustering algorithm for mining in large spatial databases. In Data Engineering, 1998. Proceedings., 14th International Conference on (pp. 324-331). IEEE.
[9] Kisilevich, S., Mansmann, F., & Keim, D. (2010, June). P-DBSCAN: a density based clustering algorithm for exploration and analysis of attractive areas using collections of geo-tagged photos. In Proceedings of the 1st international conference and exhibition on computing for geospatial research & application(p. 38). ACM.
[10] Ertöz, L., Steinbach, M., & Kumar, V. (2003, May). Finding clusters of different sizes, shapes, and densities in noisy, high dimensional data. In SDM (pp. 47-58).
[11] Day, W. H., & Edelsbrunner, H. (1984). Efficient algorithms for agglomerative hierarchical clustering methods. Journal of classification, 1(1), 7-24.
[12] Cimiano, P., Hotho, A., & Staab, S. (2004). Comparing conceptual, divise and agglomerative clustering for learning taxonomies from text. In Proceedings of the 16th Eureopean Conference on Artificial Intelligence, ECAI'2004, including Prestigious Applicants of Intelligent Systems, PAIS 2004.
[13] Willett, P. (1988). Recent trends in hierarchic document clustering: a critical review. Information Processing & Management, 24(5), 577-597.
[14] Kamvar, S. D., Klein, D., & Manning, C. D. (2002). Interpreting and extending classical agglomerative clustering algorithms using a model-based approach.
[15] Zhao, Y., & Karypis, G. (2002, November). Evaluation of hierarchical clustering algorithms for document datasets. In Proceedings of the eleventh international conference on Information and knowledge management (pp. 515-524). ACM.
[16] Voorhees, E. M. (1986). Implementing agglomerative hierarchic clustering algorithms for use in document retrieval. Information Processing & Management, 22(6), 465-476.
[17] Murtagh, F. (1983). A survey of recent advances in hierarchical clustering algorithms. The Computer Journal, 26(4), 354-359.
[18] Cimiano, P., & Staab, S. (2005). Learning concept hierarchies from text with a guided agglomerative clustering algorithm. In Proceedings of the ICML 2005 Workshop on Learning and Extending Lexical Ontologies with Machine Learning Methods.
[19] Davidson, I., & Ravi, S. S. (2005). Agglomerative hierarchical clustering with constraints: Theoretical and empirical results. In Knowledge Discovery in Databases: PKDD 2005 (pp. 59-70). Springer Berlin Heidelberg.
[20] Gowda, K. C., & Ravi, T. V. (1995). Agglomerative clustering of symbolic objects using the concepts of both similarity and dissimilarity. Pattern Recognition Letters, 16(6), 647-652.
[21] Savaresi, S. M., Boley, D. L., Bittanti, S., & Gazzaniga, G. (2002, April). Cluster Selection in Divisive Clustering Algorithms. In SDM (pp. 299-314).
[22] Gowda, K. C., & Ravi, T. V. (1995). Divisive clustering of symbolic objects using the concepts of both similarity and dissimilarity. Pattern Recognition,28(8), 1277-1282.
[23] Chavent, M. (1998). A monothetic clustering method. Pattern Recognition Letters, 19(11), 989-996.
[24] Ding, C., & He, X. (2002). Cluster merging and splitting in hierarchical clustering algorithms. In Data Mining, 2002. ICDM 2003. Proceedings. 2002 IEEE International Conference on (pp. 139-146). IEEE.
[26] Xu, R., & Wunsch, D. (2005). Survey of clustering algorithms. Neural Networks, IEEE Transactions on, 16(3), 645-678.
[27] Sherlock, G. (2000). Analysis of large-scale gene expression data. Current opinion in immunology, 12(2), 201-205.
[28] Rubin, V., & Willett, P. (1983). A comparison of some hierarchal monothetic divisive clustering algorithms for structure-property correlation. Analytica Chimica Acta, 151, 161-166.
[29] Dhillon, I. S., & Guan, Y. (2003, November). Information theoretic clustering of sparse cooccurrence data. In Data Mining, 2003. ICDM 2003. Third IEEE International Conference on (pp. 517-520). IEEE.
[30] Tasoulis, S. K., Tasoulis, D. K., & Plagianakos, V. P. (2010). Enhancing principal direction divisive clustering. Pattern Recognition, 43(10), 3391-3411.
[31] Hartigan, J. A., & Wong, M. A. (1979). Algorithm AS 136: A k-means clustering algorithm. Applied statistics, 100-108.
[32] Kanungo, T., Mount, D. M., Netanyahu, N. S., Piatko, C. D., Silverman, R., & Wu, A. Y. (2002). An efficient k-means clustering algorithm: Analysis and implementation. Pattern Analysis and Machine Intelligence, IEEE Transactions on, 24(7), 881-892.
[33] Wagstaff, K., Cardie, C., Rogers, S., & Schrödl, S. (2001, June). Constrained k-means clustering with background knowledge. In ICML (Vol. 1, pp. 577-584).
[34] Bradley, P. S., & Fayyad, U. M. (1998, July). Refining Initial Points for K-Means Clustering. In ICML (Vol. 98, pp. 91-99).
[35] Jain, A. K. (2010). Data clustering: 50 years beyond K-means. Pattern recognition letters, 31(8), 651-666.
[36] Žalik, K. R. (2008). An efficient k′-means clustering
algorithm. Pattern Recognition Letters, 29(9), 1385-1391.
[37] Nazeer, K. A., & Sebastian, M. P. (2009, July). Improving the Accuracy and Efficiency of the k-means Clustering Algorithm. In Proceedings of the World Congress on Engineering (Vol. 1, pp. 1-3).
[38] Likas, A., Vlassis, N., & Verbeek, J. J. (2003). The global k-means clustering algorithm. Pattern recognition, 36(2), 451-461.
[39] Khan, S. S., & Ahmad, A. (2004). Cluster center initialization algorithm for K-means clustering. Pattern recognition letters, 25(11), 1293-1302.
[40] Huang, Z. (1998). Extensions to the k-means algorithm for clustering large data sets with categorical values. Data mining and knowledge discovery, 2(3), 283-304.
[41] Zhang, Q., & Couloigner, I. (2005). A new and efficient k-medoid algorithm for spatial clustering. In Computational Science and Its Applications–ICCSA 2005(pp. 181-189). Springer Berlin Heidelberg.
[42] Arifovic, J. (1994). Genetic algorithm learning and the cobweb model. Journal of Economic dynamics and Control, 18(1), 3-28.
[43] Clerkin, P., Cunningham, P., & Hayes, C. (2002). Ontology discovery for the semantic web using hierarchical clustering. Trinity College Dublin, Department of Computer Science.
[44] Fisher, D. H. (1987). Knowledge acquisition via incremental conceptual clustering. Machine learning, 2(2), 139-172.
[45] Fisher, D. H. (1987, July). Improving Inference through Conceptual Clustering. In AAAI (Vol. 87, pp. 461-465).