Hybrid Method of First Come First Served and Priority
Queue for Queue System in Hospital
D. Jayus Nor Salim
Department of Information System
Diponegoro University
Semarang, Indonesia
Jatmiko Endro Suseno
Department of Physics
Diponegoro University
Semarang, Indonesia
Oky Dwi Nurhayati
Department of Informatic
Diponegoro University
Semarang, Indonesia
ABSTRACT
People must have been queuing up at service places like banks, hospitals, etc. For now most of the queues are still conventional. The queue is done manually, the customer takes the queue number and waits until it's his turn. In computer systems people are familiar with queuing theory, such as FIFO, LIFO, PQ, etc. Sometimes, it combines several queue theories to execute the program. This study, queuing system will adopt from queue theory which is used by computer system. Hybrid system from FCFS and PQ will serve customers according to their needs. This study was conducted at the service place of one of the government hospital in Surakarta city. The sample queue data will be analyzed and compared when using the conventional queue and after using this queue system. This queuing system utilizes cloud technology to be accessible anywhere and display results in real time. The average waiting time in the hospital service using a conventional queue system is 2-5 hours, while using this system is 10-30 minutes.
General Terms
Cloud Queue System
Keywords
Information system, Queue system, Scheduling algorithm, FCFS, Priority queue, Cloud computing
1.
INTRODUCTION
People cannot be separated from activities that require queues. They can find examples of queue when queuing at the bank service, hospital, supermarket cashier, etc. Many people complained about the queue is too long, so much time wasted. The time spent in queuing should be used for other more productive activities, so their time can be used more efficiently and effectively [1].
Queue is a process associated with the arrival of customers / customers in a place of service, waiting in the queue line when there is a stack of customers who have not served [2]. There are many queuing systems used by the company. Most of the queues are still conventional. The queue is done manually, the customers takes the queue number and waits until the queue number is their turn. The conventional queues is similar with the method queue system in the system of computer, that is first come first served (FCFS) method.
The first requesting process will be served first, it is called FCFS. Meanwhile, the requesting process with priority number, it is called priority queue (PQ). For example the smaller of priority number is more prioritized [3]. They are one of the methods contained in the Central Processing Unit (CPU) scheduling algorithm on a computer system. This research will apply the queuing model used by the CPU into a human queue. There are some differences between queues that are applied to the CPU with queues for humans. The
difference is in the object of research. Queue in the CPU is a queue of execution of commands. It is performed by the machine and done in micro seconds even smaller, while the queue in humans is a queue of services that involve humans as objects and done in minutes even hours [4]. Queues in humans also consider the psychological impacts that are naturally possessed by humans. Therefore, the scheduling algorithm to be applied in this study will be modified according to the research needs to achieve the research objectives
This research will combines FCFS and PQ method and the system run online. This system will be built on a web platform using cloud computing technology. This technology utilizes the Internet as a data transmission. It will be accessible anywhere and display results in real time Customers can retrieve the queue number and monitor the ongoing queue number which are being served. Customers arrive when the queue number is approaching time served. It is expected that the time spent by Customers to queue can be used to do more productive work so that their time is more efficient and useful [5].
2.
RELATED WORK
Takagi's research was conducted on hospital services. By using a method of estimating the length of treatment for each patient, the patient can only find out when the hospitalized room will be empty and usable. By applying a multi-channel queue model with server in the form of room care and patient visitors. Visitors will be separated by type of disease to be served by different servers according to the type of disease. Nanjing University of Science and Technology conducts research on queues at bank service centers using the Bussines Process Reengineering (BPR) method. BPR performs the optimization of the server work to serve the visitor. Optimization is done in the BPR that is by determining the number of servers and destination servers are different for each visitor. Visitors will be served by different servers based on the type of service that visitors will want [6].
Research on scheduling theory is used to optimize the management of a bank. This study utilizes cellular phone technology to optimize queues and improve service productivity [7].
Research on arrival and departure of trains. Arrival and departure of the train has actually been done in accordance with his schedule, but one day can happen a train is required to come or depart first. This is done by delaying the train schedule to be inserted [8].
3.
RESEARCH METHODOLOGY
3.1 Scheduling Algorithm
executed by the CPU [9].
3.2 Queue Structure
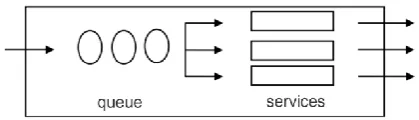
[image:2.595.63.273.129.189.2]This research use queue structure multi channel single phase. There are 2 facilities or more is done in same time [10].
Fig 1 : Queue structured : multi channel single phase
3.3 First Come First Served
[image:2.595.51.284.259.409.2]The earliest process order will be served first. This FCFS method is a common method used to solve public queuing problems [11].
Table 1. FCFS Process
Process Burst Time
P1 24
P2 3
P3 3
by FCFS, process will be served like fig.2
Fig 2 : FCFS Process
3.4 Kendall Notation
To understand the characteristics of a queuing system used Kendall Notation. Kendall notation is used to explain how the queue system that reviewed works and is modeled [12].
Step I shows the variable of data type
𝜆 =
1𝑇1/𝑁 ………...(1)
𝜇 =
1𝑇2/𝑁...(2)
λ = customers arrival rate
μ = service level
T1 = total time between arrivals
T2 = total customers service time
N = total customers
Step II determines the value of unemployment opportunity (P0)
𝑃
0= (
𝜆 𝜇
𝑛
𝑛! 𝑐=1
𝑛=0
+
𝜆 𝜇
𝑐
𝑐! 1− 𝜆
𝑐.𝜇
)
−1...(2)Information:
P0 = probability of idle time
λ = customers arrival rate
μ = service level
c = number of service facilities
Step III determines the Lq, the average number of customers
in the queue.
𝐿
𝑞=
𝜆 𝜇
𝑐
.(𝜆
𝑐.𝜇)
𝑐!(1−(𝑐.𝜇𝜆 ))2
𝑃
0………(3)Information:
Lq = average number of customers in the queue
P0 = probability of idle time
λ = customer arrival rate μ = service level
c = number of service facilities
Step IV determines Ls, the average number of customers in
the system.
𝐿
𝑠= 𝐿
𝑞+
𝜆𝜇………..………(4)
Information:
Ls = average number of customers in the system
Ls = average number of customers in the queue
λ = customer arrival rate μ = service level
Step V determines Wq, the average customers time in the
queue.
𝑊
𝑞=
𝐿𝑞𝜆……….……….(5)
Information :
Wq = average customers time in queue
Lq = average number of customers in the queue
λ = customer arrival rate μ = service level
Step VI specifies Ws, the average customers time in the
system.
𝑊
𝑠= 𝑊
𝑞+
1𝜇………..……….(6)
Information :
Ws = average customers time in the system
Wq = average customers time in queue
μ = service level
3.5 Priority Queue
Fig 3 : PQ Process
3.6 Hybrid FCFS + PQ
[image:3.595.324.531.229.415.2]Hybrid FCFS + PQ algorithm is a hybrid of first come first served and priority queue methods of scheduling algorithm. In this, people in line choose the type of queue, FCFS or PQ. If they choose FCFS, they can get the fastest time of waiting time in line. If they choose PQ, they can order the time as they want. Then the PQ will interrupt or insert the queue. If there is more than one customers choose the same time, then FCFS is executed [14]. For example interruption process in CPU shown on fig.4.
Fig 4 : Interuption or Insertion Process on CPU
3.7 Cloud Computing
Cloud or the internet is an innovation technology platform to provide users with high-scale services. The use of cloud can be controlled remotely because this technology uses the internet as a media access. Therefore a system should be built using this technology so users can use the system wherever and whenever [15].
Fig 3 : Cloud Computing Scheme
4.
DESIGN OF RESEARCH
4.1
Material and Tools
The tools and materials used in this research are some places where there is a queue process in there. This research especially do the sample in hospital in Surakarta City. This research combine queue system before and after the new system applied. The system process the data using FCFS and PQ combination method. The system is made in web platform and online.
4.2
Research Procedure
[image:3.595.67.266.338.451.2]Research procedure can be shown on fig. 4.
Fig 4 : Research Procedure
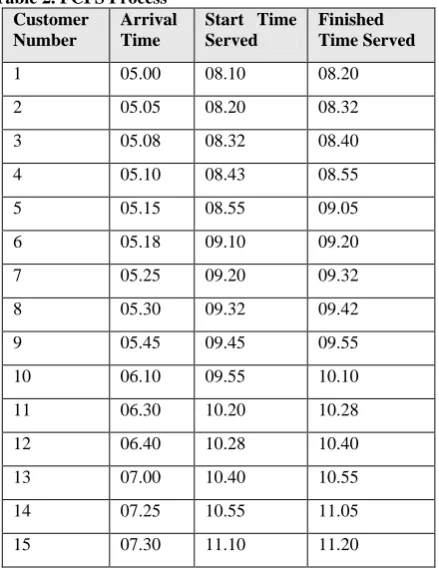
After observation, the data shown in table 2
Table 2. FCFS Process Customer
Number
Arrival Time
Start Time Served
Finished Time Served
1 05.00 08.10 08.20
2 05.05 08.20 08.32
3 05.08 08.32 08.40
4 05.10 08.43 08.55
5 05.15 08.55 09.05
6 05.18 09.10 09.20
7 05.25 09.20 09.32
8 05.30 09.32 09.42
9 05.45 09.45 09.55
10 06.10 09.55 10.10
11 06.30 10.20 10.28
12 06.40 10.28 10.40
13 07.00 10.40 10.55
14 07.25 10.55 11.05
15 07.30 11.10 11.20
Designing FCFS+PQ Queue
System
Implementation and Evaluation
Analysis of results and Conclusions Problem
identification and formulation Literature review
[image:3.595.319.539.472.760.2] [image:3.595.56.282.556.720.2]16 08.00 13.00 13.15
17 08.10 13.15 13.23
18 08.30 13.25 13.40
19 08.50 13.40 13.50
20 09.00 13.50 14.05
Then, analyzing Kendall Notation
4.2.1 Shows The Variable of Data Type
The process of determining the data type variable is shown by the following formula.
Counting customer arrivals:
𝜆 =
1𝑇1/𝑁
𝜆 =
1240/20
𝜆 =
112
𝜆 = 0.08
Calculating service levels:𝜇 =
1𝑇2/𝑁
𝜇 =
1227/20
𝜇 =
111.35
𝜇 = 0.09
4.2.2 Determines The Value of Unemployment
Opportunity (P
0)
After getting the value of the variables of the customer arrival rate and service level, the next step is to determine the value of unemployment opportunities:
𝑃
0= (
𝜆 𝜇
𝑛
𝑛! 𝑐=1
𝑛=0
+
𝜆 𝜇
𝑐
𝑐! 1− 𝜆𝑐.𝜇
)
−1𝑃
0= (
(0.080.09)00!
+ (
(0.080.09)1
1!(1−1(0.09)0.08 )
))
−1𝑃
0= (
11
+
0.89 1.(1−0.89))
−1
𝑃
0= (1 +
0.891(0.11)
)
−1𝑃
0= (1 +
0.890.11
)
−1𝑃
0= (1 + 8.09)
−1𝑃
0= (9.09)
−1𝑃
0=
19.09
𝑃
0=
19.09
𝑃
0= 0.11
or 11%In the case of queuing at the hospital, the number of service facilities can be more than one, but the number of service facilities more than one is usually found in the registration service, while this research takes the case on the service in
special poly. Special Poly usually there is only one doctor / service facility in each poly. So, in this case the value of c = 1.
4.2.3 Determining Average Number of Customers
in Queue
After getting the value of the idle time opportunity on the queue, the next step is to determine the average number of customers in the queue:
𝐿
𝑞=
𝜆 𝜇
𝑐
.(𝑐.𝜇𝜆 )
𝑐!(1−(𝑐.𝜇𝜆 ))2
𝑃
0𝐿
𝑞=
0.08 0.09
1
. 1. 0.09 0.08
1! 1−(1. 0.09 0.08 ) 2
. (0.11)
𝐿
𝑞=
(0.89).(0.89)1. 1−(0.89) 2
. (0.11
)𝐿
𝑞=
0.79210.11 2
. (0.11)
𝐿
𝑞=
0.79210.0121
. (0.11)
𝐿
𝑞=
0.79210.0121
. (0.11)
𝐿
𝑞= (65.46). (0.11)
𝐿
𝑞= 7.2
The value of Lq is 7.2, rounded to 7. So the average number of customers in the queue is 7 customers in the queue.
4.2.4 Determining Average Number of Customers
in The System
After getting the average number of customers in the queue, the next step is to determine the average number of customers in the system:
𝐿
𝑠= 𝐿
𝑞+
𝜆𝜇
𝐿
𝑠= 7.2 +
0.08 0.09𝐿
𝑠= 7.2 + 0.89
𝐿
𝑠=
8.09The value of Ls is 8.09, rounded to 8. So the average number of customers in the system is 8 customers in the system.
4.2.5 Determining Average Time Customer in
Queue
After getting the value of the average number of customers in the system, the next step is to determine the average customer time in the queue:
𝑊
𝑞=
𝐿𝑞𝜆
𝑊
𝑞=
7.2 0.08𝑊
𝑞= 90
The Wq value is 90. So the average customer time in the queue is 90 minutes / customer.
4.2.6 Determining Average Time Customer in
System
𝑊
𝑠= 𝑊
𝑞+
1𝜇
𝑊
𝑠= 90 +
10.09
𝑊
𝑠= 90 + 11.11
𝑊
𝑠= 101.11
The value of Ws is 101.11. So the average customer time in the system is 101.11 minutes / customer.
4.3
Physical Data Model
4.3.1 Flowchart
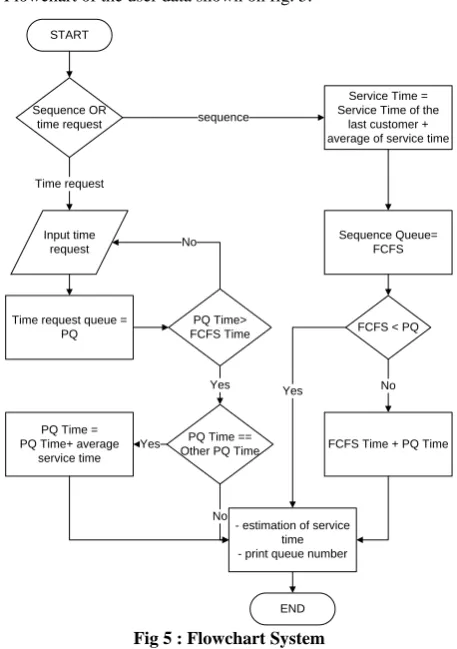
Flowchart of the user data shown on fig. 5.
START
Sequence OR time request
Input time request
PQ Time> FCFS Time
Service Time = Service Time of the
last customer + average of service time
FCFS < PQ
FCFS Time + PQ Time
- estimation of service time - print queue number
END sequence
Time request
No
Yes Yes No
Sequence Queue= FCFS
Time request queue = PQ
PQ Time == Other PQ Time PQ Time =
PQ Time+ average service time
Yes
[image:5.595.91.178.73.142.2]No
Fig 5 : Flowchart System
Customers can choose type of queue, they are sequence queue or time request. Sequence queue is FCFS, who comes first will served first. So, if customers would to choose the fastest queue can choose this sequence queue. Other choices is time request, customers can order served time. If there is request time in same time, then FCFS execute them.
4.3.2 Databases
[image:5.595.322.541.100.242.2]The databases is needed to store the data, which shown below.
Fig 6 : Databases Structure
Fig. 6 is the structure database of the system. The data of customers are saved in store media to be processed and analyzed.
4.3.3 Interfaces
Interfaces of the system shown on fig. 7.
[image:5.595.52.281.210.535.2]4.3.3.1 Home Page
Fig 7 : Home Page
The fig. 7 is an home page of the system. Customer can know the information about the system here.
[image:5.595.315.545.333.467.2]4.3.3.2 Queue Status Page
Fig 8 : Queue Status Page
[image:5.595.316.544.508.635.2]4.3.3.3 Detail Queue Status Page
Fig 9 : Detail Queue Status Page
Fig. 9 is detail queue status page. The next step from queue status page. Customer can monitor status of type of queue.
4.3.3.4 Queue Slot Page
Fig 10 : Queue Slot Page
Fig. 10 is queue slot page. Customer can see and choose slot time.
4.3.3.5 Admin Queue Status Page
Fig 11 : Admin Queue Status Page
Fig. 11 is administrator queue status page. Admin can monitor and manage queue from this page.
4.3.3.6 Admin Detail Queue Status Page
Fig 12 : Detail Admin Queue Status Page
Fig. 12 is detail of administrator queue status page. Admin can monitor and manage the detail of queue.
5.
EXPERIMENTAL RESULT
5.1
Information System Framework
The data of queue in hospital includes arrival time, time served how long the customer served is stored in database on cloud and analyzed with FCFS+PQ. Then, the data before and after the system applied is compared to show the result of FCFS+PQ.
INPUT PROCESS OUTPUT
patients choose queuing methods
in the system
Performing queue length calculations, average time of
service using FCFS scheduling algorithm
Combine queues by inserting PQ queues into the FCFS queue line according to the method shown in the system
flowchart
Getting the queue number
patients choose the type of queue:
fastest time / request time
patients choose the type of service: registration, poly,
specialist, etc.
Fig 13 : Information System Framework
5.2
Implementation and Result
After implementation, The data shown in table 3
Table 3. Queue Data after Implementation Customer
Number
Arrival Time
Start Time Served
Finished Time Served
1 07.30 08.00 08.10
2 07.35 08.10 08.22
3 08.05 08.22 08.34
4 08.20 08.35 08.45
5 08.30 08.45 08.53
6 08.50 08.55 09.05
7 08.45 09.05 09.15
8 09.00 09.15 09.25
9 09.10 09.25 09.35
10 09.30 09.35 09.47
11 09.30 09.48 09.58
12 09.30 09.58 10.10
13 09.45 10.10 10.20
14 10.00 10.20 10.40
15 10.30 10.40 11.00
16 10.45 11.00 11.15
17 11.00 11.15 11.30
18 11.00 11.30 11.45
19 12.30 13.00 13.15
20 13.00 13.15 13.25
21 13.20 13.25 13.35
22 13.20 13.35 13.45
23 13.30 13.45 14.00
5.2.1 Shows The Variable of Data Type
Counting customer arrivals:
𝜆 =
1𝑇1/𝑁
𝜆 =
1360/16.65
𝜆 =
121.62
𝜆 = 0.046
Calculating service levels:
𝜇 =
1𝑇2/𝑁
𝜇 =
1281/23
𝜇 =
112.217
𝜇 = 0.08
5.2.2 Determines The Value of Unemployment
Opportunity (P
0)
𝑃
0= (
𝜆 𝜇 𝑛 𝑛! 𝑐=1 𝑛=0
+
𝜆 𝜇 𝑐𝑐! 1− 𝜆𝑐.𝜇
)
−1𝑃
0= (
(0.046 0.08)0
0!
+ (
(0.0460.08)1
1!(1−1(0.08)0.046 )
))
−1𝑃
0= (
1 1+
0.575 1.(1−0.575)
)
−1
𝑃
0= (1 +
0.5751(0.425)
)
−1𝑃
0= (1 +
0.5750.425
)
−1𝑃
0= (1 + 1.35)
−1𝑃
0= (2.35)
−1𝑃
0=
12.35
𝑃
0= 0.425
or 42.5%
5.2.3 Determining Average Number of Customers
in Queue
𝐿
𝑞=
𝜆 𝜇
𝑐
.(𝑐.𝜇𝜆 )
𝑐!(1−(𝑐.𝜇𝜆 ))2
𝑃
0𝐿
𝑞=
0.046 0.08
1
. 1. 0.08 0.046
1! 1−(1. 0.08 0.046 ) 2
. (0.425)
𝐿
𝑞=
(0.575).(0.575)
1. 1−(0.575) 2
. (0.425
)
𝐿
𝑞=
0.330.425 2
. (0.425)
𝐿
𝑞=
0.330.18
. (0.425)
𝐿
𝑞= (1.83). (0.425)
𝐿
𝑞= 0.78
The value of Lq is 0.78, rounded to 1. So the average number of customers in the queue is 1 customers in the queue.
5.2.4 Determining Average Number of Customers
in The System
𝐿
𝑠= 𝐿
𝑞+
𝜆𝜇
𝐿
𝑠= 0.78 +
0.0460.08
𝐿
𝑠= 0.78 + 0.575
𝐿
𝑠=
1.35
The value of Ls is 1.35, it beetwen 1 and 2. So the average number of customers in the system is 1 untill 2 customers in the system.
5.2.5 Determining Average Time Customer in
Queue
𝑊
𝑞=
𝐿𝑞𝜆
𝑊
𝑞=
0.78 0.046𝑊
𝑞= 16.96
The Wq value is 16.96, rounded to 17. So the average customer time in the queue is 17 minutes / customer.
5.2.6 Determining Average Time Customer in
System
𝑊
𝑠= 𝑊
𝑞+
1𝜇
𝑊
𝑠= 16.96 +
10.08
𝑊
𝑠= 16.96 + 12.5
𝑊
𝑠= 29.46
The value of Ws is 29.46. So the average customer time in the system is 29 minutes / customer.
6.
CONCLUCION
Generally, FCFS is used for almost all types of queues for human services. FCFS will still be a heap of customers if there are many customers who come and no server is ready yet. Now customers want to queue with no waiting, or at least with the minimum waiting time. The solution of the problem is monitoring the queue with the online system. The online system is still not enough, the customers want to order a certain time to be served, the solution is with the time request. Then FCFS is combined with PQ. In this case, research in the hospital queue. Before using this system the patient can queue for up to 2 hours, after using this system patient waiting time on average reduced to 30 minutes. Another advantage is the hospital has experienced employee performance efficiency because there is no idle time for employees and there are not many queues at the service place.
7.
REFERENCES
[1] Takagi, H., 2014, From Computer Science to Service Science: Queues with Human Customers And Servers, Faculty of Engineering, Information and Sistems, University of Tsukuba, Tsukuba Science City, Ibaraki 305-8573, Japan.
[2] Gross, D., and Harris, C., 1998, Fundamental of Queuing Theory, Third Edition, USA: MC Graw Hill, pp. 28-30.
[4] Pinedo, M., 2016, Schedulling: Theory, Algorithms, and Sistem. NYU Stern School of Business, New York, pp. 57-58.
[5] Erl, T., and Puttini, R., 2013, Cloud Computing: concepts, technology and Architecture, Prentice Hall. [6] Hao, T., and Yifei, T., 2011, Study on Queuing Sistem
Optimization of Bank Based on BPR, Nanjing University of Science and Technology, School of Mechanical Engineering 402, 210094 Nanjing, Republic of China.
[7] Taufemback, C., dan Da Silva, S., 2012, Queuing Theory Applied to The Optimal Management of Bank Excess Reserves. Program in Economics, Federal University of Santa Catarina, Florianopolis SC88049-970, Brazil.
[8] Walraevens, J., dan Bruneel, H., 2017, Delay analysis of multiclass queues with correlated train arrivals and a hybrid priority/FIFO scheduling discipline. Department of Telecommunication and Information Processing, Ghent University, Belgium
[9] Pinedo, M., 2016, Schedulling: Theory, Algorithms, and Sistem. NYU Stern School of Business, New York, pp. 87-90.
[10] Aminudin, 2005, Principal of Research Operation, Jakarta : Erlangga.
[11] Platz, T., and Osterdal, L., 2015, The Curse of The First-in First-out Queue DisciplFirst-ine, University of Southern Denmark, 92-95.
[12] Gross, D., and Harris, C., 1998, Fundamental of Queuing Theory, Third Edition, USA: MC Graw Hill, 101-110. [13] Gross, D., and Harris, C., 1998, Fundamental of Queuing
Theory, Third Edition, USA: MC Graw Hill, 115-120. [14] Arina, S., and Harahap, R., 2014, Analysis of Queue Service System in PT BNI, Department of Mathematics , Faculty of Mathematics and Natural Sciences , University of Sumatera Utara.