What fairness? Gendered housework division and family life satisfaction
across 30 countries
Yang Hu
Department of Sociology, Lancaster University
Address: Bowland North, Lancaster University, Bailrigg, Lancaster, LA1 4YN, UK
Email: yang.hu@lancaster.ac.uk
Phone: +44 1524 593429
Yang Hu is a Lecturer in the Department of Sociology at Lancaster University, UK. His
research focuses on the sociology of families and intimate relationships, race/ethnicity and
migration, and East Asian societies. His is the author of the book Chinese-British
Intermarriage—Disentangling Gender and Ethnicity. His recent research has appeared in the
Journal of Marriage and Family, Journal of Sex Research, Demographic Research,
Environment and Planning A, Journal of Family Issues and British Journal of Sociology of Education.
Deniz Yucel
Department of Sociology, William Paterson University
Address: 300 Pompton Road, 465 Raubinger Hall, Wayne, NJ, 07470, USA
Email: yuceld@wpunj.edu
Phone: +1 973-720-2572
Deniz Yucel is an Associate Professor in the Department of Sociology at William Paterson
the Ohio State University, United States. She specialises in the sociology of family, sociology
of education, social stratification, work-family balance and social capital. Her current
research takes a comparative approach to exploring the micro and macro determinants of
relationship and family life satisfaction among married individuals and couples, as well as
understanding the differential relationship dynamics between married and cohabiting couples.
Her prior research has appeared in Social Science Research,Journal of Family Issues,Society and Mental Health, and Social Indicators Research.
Acknowledgements
The data used in this research are obtained from the Leibniz Institute for the Social Sciences.
We are solely responsible for the analysis and interpretation of the data presented in this
article. We gratefully acknowledge the helpful comments on an earlier version of this paper
received at the 2017 Annual Conference of the British Sociological Association. We would
like to thank the constructive and encouraging comments from the editors and anonymous
What fairness? Gendered division of housework and family life satisfaction
across 30 countries
Abstract
This article sheds new light on the role played by perceived fairness in configuring the
relationship between gendered housework division and women’s family life satisfaction
across 30 countries. This is achieved by distinguishing and comparing two major dimensions
of women’s fairness comparison—inter-gender relational comparison between partners and
intra-gender referential comparison with other women from the same society. Analysing data
from the 2012 International Social Survey Programme, we find that women’s family life
satisfaction is adversely affected by both a lack of relational fairness and unfavourable
referential comparison, which operate independently of each other. Supporting the
‘self-serving’ theory, women are found to rely more on one dimension of fairness comparison
to assess their family life satisfaction when they compare unfavourably rather than
favourably in the other dimension. Country-level gender equality positively predicts the
strength of the association between relational fairness and family life satisfaction. However, it
does not seem to moderate the influence of referential comparison on family life satisfaction.
In light of these results, scholars are urged to consider the perceived fairness of housework
division as a plural construct, and to promulgate gender equality in multiple
dimensions—addressing not just inter-gender (in)equity but also intra-gender (in)equality—to
move the gender revolution forward.
Key Words
Fairness, Family Life Satisfaction, Gender, Housework, Multilevel Cross-national Analysis,
Introduction
The United Nations set the achievement of gender equality as one of its 2030 Sustainable
Development Goals. However, this vision is challenged by the reality of a ‘stalled’ and
‘uneven’ gender revolution (Esping-Andersen et al., 2013). Despite considerable progress
towards gender equality in the public sphere (Scott et al., 2012), progress towards domestic
gender equality not only lags far behind but is uneven across the globe (Lachance-Grzela and
Bouchard, 2010; Voicu et al., 2009), with some countries and regions (e.g. Northern Europe)
far ahead of others (e.g. East Asia) (Esping-Andersen et al., 2013). A further dimension of
imbalance in the gender revolution lies in the vast gulf between the reality of gendered
housework division and how this reality is subjectively perceived. Although women
undertake two thirds of the domestic work in many industrialised societies (Esping-Andersen
et al., 2013; Greenstein, 2009), more than 40% of women, according to Braun et al. (2008)
and Greenstein (2009), tend not to perceive the division of housework as unfair.
Subjective perceptions of the fairness of housework division matter because they
speak to the ways in which women make sense of their gendered experiences and their latent
tendency to (re)act upon the status quo (Braun et al., 2008; Davis and Greenstein, 2009). In
this context, the widespread absence of the perception of gendered division of housework as
unfair may underpin an entrenched normalisation of gender inequity (Thompson, 1991).
Fairness perceptions may also form part of people’s life-quality assessment (Himsel and
Goldberg, 2003). A lack of perceived fairness in the division of housework might decrease
women’s family life satisfaction (Knudsen and Wærness, 2008), in turn increasing the odds
of relationship and marital dissolution (Forste and Fox, 2012; Frisco and Williams, 2003).
Social comparison is a key mechanism of fairness evaluation (Festinger, 1954; Major,
1993; Thompson, 1991). According to the theories of distributive justice, relative deprivation
draw simultaneously on multiple comparison referents to construct their fairness perceptions.
Different dimensions of fairness comparison represent vastly different social and
psychological processes (Buunk and VanYperen, 1991; Major, 1993; Mikula et al., 2009).
However, the multiplicity of fairness comparison has received insufficient attention in
existing quantitative—and particularly cross-national—research (e.g. Braun et al., 2008;
Greenstein, 1996; Greenstein, 2009; Lavee and Katz, 2002), which has tended to focus on
comparison between partners.1 As a result, it remains largely unclear whether and how distinct dimensions of fairness comparison may affect women’s family life satisfaction in
similar or different ways, and how different dimensions of comparison may interact with
and/or mitigate each other. To remedy this limitation, our first objective is to explicitly
theorise, measure and compare distinct dimensions of fairness comparison—namely
inter-gender comparison between partners and intra-gender comparison within a given
society—and characterise their respective and interactive roles in configuring women’s
family life satisfaction.
The perceived fairness of housework division and its implications for family life
satisfaction are further moderated by justification processes, i.e. the legitimisation of the
appropriateness of the gendered division of housework (Major, 1993; Thompson, 1991). To
date, researchers have focused on individual-level dynamics; the socially embedded and
context-dependent nature of perceived fairness has received less attention (Ferree et al.,
1999). The few exceptions to take a cross-national approach have yielded valuable insights
into the salience of national context in configuring perceived fairness and its impact on
family life satisfaction (e.g. Braun et al., 2008; Forste and Fox, 2012; Greenstein, 2009;
Knudsen and Wærness, 2008; Ruppanner, 2010). However, it is unclear from these studies
whether and how national context may moderate distinct dimensions of individual-level
dimensions of contextual moderation because they represent distinct modes of
individual-context interaction and different ways of understanding the ‘unevenness’ of the
gender revolution across countries (Walby, 2009). Our second objective is thus to disentangle
and compare the ways in which national context may condition different dimensions of
fairness comparison, moderating their influences on women’s satisfaction with family life.
Theoretical Considerations and Hypotheses
Housework Division, Perceived Fairness and Satisfaction with Family Life
Bridging the gap between the objective division of domestic labour and subjective
perceptions of that division, the distributive justice framework provides valuable insights into
why, when and how gendered housework division matters to women’s family life satisfaction
(Major, 1993; Thompson, 1991). Within this framework, it is axiomatic that a justice
phenomenon—the construction of fairness perception—must be activated for a link to be
established between housework division and subjective life-quality assessment (Thompson,
1991). The framework has received extensive empirical support (e.g. Braun et al., 2008;
Greenstein, 1996; Lavee and Katz, 2002; Lennon and Rosenfield, 1994).
Three components are operative in the activation of justice phenomena: outcome,
comparison and justification. First, individuals must value the outcome of an equitable
division of housework to initiate the process of fairness evaluation. Second, social
comparison plays a vital role in fairness evaluation, as highlighted by scholars such as Crosby
(1982), Festinger (1954), Himsel and Goldberg (2003) and Runciman (1966). This is
consistent with the symbolic interactionist perspective in that individuals refer to other social
actors and contextual norms to validate the meaning of ‘doing’ housework (West and
Zimmerman, 1987). Third, justifications of or beliefs about the appropriateness of the
fairness and its consequences (Major, 1993). As an outcome of fairness comparison, the
performance of domestic chores is generally considered ‘undesirable’ (Scott et al., 2012), and
people tend to seek equity in relationships (Greenstein, 2009). In this research, therefore, we
expand on the latter two components to provide a nuanced examination of fairness
comparison, justification and the interaction between the two in a cross-national context.
Dimensions of Fairness Comparison
Fairness comparison has been well established as a multifaceted and multi-scalar process
(Festinger, 1954; Major, 1993; Runciman, 1966). Partly due to data limitations, however,
quantitative empirical research on the gendered division of housework has tended to restrict
fairness comparison to a single dimension: between partners (e.g. Braun et al., 2008;
Greenstein, 1996; Greenstein, 2009; Lavee and Katz, 2002). The multifaceted nature of
fairness comparison has been explicitly addressed in only a few qualitative and small-scale
studies (e.g. Freudenthaler and Mikula, 1998; Himsel and Goldberg, 2003; Kluwer, 1998;
Mikula et al., 2009). However, these studies clearly illustrate the importance of considering
fairness comparison as a plural construct.
Although numerous referents are possible, two main referents appear to be used by
women to construct fairness perceptions. First, women may conduct inter-gender comparison
with their partners (Braun et al., 2008; Greenstein, 1996; Major, 1993; Ruppanner, 2010;
Thompson, 1991), with whom they have direct social exchange relationships. According to
Buunk and VanYperen (1991) and Crosby (1982), the goal of such ‘relational comparison’ is
to eliminate relative deprivation and attain a sense of equity. Given that in many countries,
women spend twice as much time on housework as men despite their high rate of labour
force participation (Lachance-Grzela and Bouchard, 2010; Voicu et al., 2009), inter-gender
2003; Greenstein, 1996; Himsel and Goldberg, 2003), which may adversely affect women’s
family life satisfaction.
Second, women may look beyond the home, carrying out intra-gender comparison with
other women from the same society (Freudenthaler and Mikula, 1998; Himsel and Goldberg,
2003; Kluwer, 1998). This process of comparison does not necessarily involve concrete
social interaction or exchange, and is conducted for validation and referential purposes.
According to Buunk and VanYperen (1991), the goal of such ‘referential comparison’ is to
gain comparative advantages (rather than to attain equity) by constructing the favourable
sense that one is faring better (i.e. undertaking a smaller share of the housework) than other
women. Referential comparison may be further calibrated by certain comparative frames, as
women are typically seen to choose those with comparable traits (e.g. similar gender
ideologies) as referents (Davis and Greenstein, 2009; Runciman, 1966; Himsel and Goldberg,
2003). Previous research has shown that a margin of advantage perceived through referential
comparison may positively predict women’s satisfaction with family life, while a perceived
relative disadvantage may negatively affect their family life satisfaction (Himsel and
Goldberg, 2003; Mikula et al., 2009). If the above two dimensions of fairness comparison
indeed differ in their underlying constructs, mechanisms and scope, we would expect them
both to have a net influence on women’s family life satisfaction, independent of each other
(i.e. without mediating each other’s effect).
Hypothesis 1 (inter-gender relational fairness comparison between partners):
Hypothesis 2 (intra-gender referential comparison within country): women’s
favourable comparison with other women from the same country in terms of the division of housework is positively associated with their family life satisfaction.
In reality, the two dimensions of fairness comparison are likely to operate in conjunction
rather than separately in isolation. Women not only refer simultaneously to different referents
(Thompson, 1991; Freudenthaler and Mikula, 1998; Kluwer, 1998), but are also seen to
consciously choose between and rely on different referents to conduct fairness comparison
(Buunk and VanYperen, 1991). Based on the principle of dissonance reduction (Festinger
1954, 1962), the choice of referents tends to be ‘self-serving’ and ‘harm-evasive’ (Buunk and
VanYperen, 1991). When multiple referents are available, women are likely to veer away
from the less favourable and opt for the more favourable referent to establish and reinforce a
positive view of their situation (Major, 1993). If the ‘self-serving’ conjecture holds true in
women’s choice of relational vs referential comparison, we would expect one dimension of
comparison to matter more when women compare unfavourably rather than favourably in the
other dimension.
Hypothesis 3 (moderating effect between the two dimensions of fairness comparison):
the association between family life satisfaction and referential comparison is stronger when women compare unfavourably rather than favourably with their partners in terms of the division of housework.
Fairness Justification and National Context
Fairness justification entails the legitimisation of certain outcomes of fairness comparison as
2008; Major, 1993). The moderating effect of justification on the relationship between
fairness comparison and family life satisfaction at the individual level has received extensive
empirical support in terms of gender ideology (Davis and Greenstein, 2009; Greenstein, 1996;
Lavee and Katz, 2002), marital power and relative resources (Lennon and Rosenfield, 1994)
and role strain and time constraints (Braun et al., 2008; Ruppanner, 2010). Although the
notion that both social justice and gender dynamics are socially embedded and operate at
multiple cross-cutting levels of society is no longer new (Ferree et al., 1999), only a handful
of researchers have adopted a multilevel approach and explicitly focused on country-level
justification (Braun et al., 2008; Forste and Fox, 2012; Greenstein, 2009; Ruppanner, 2010).
These studies specifically addressed relational comparison between partners and showed that
both the dynamics and the consequences of comparison vary considerably by country.
Although we know little about whether and how national context may condition referential
comparison, there is good reason to expect that relational comparison and referential
comparison relate to national context in different ways, as they are based on considerably
different constructs.
National context may moderate the perceived fairness of housework division via two
major mechanisms. First, the level of gender (in)equality is indicative of prevalent gender
norms in a given country (Davis and Greenstein, 2009), and individuals draw on such norms
to enact and regulate their gender performance (West and Zimmerman, 1987). The
association between femininity and housework performance is normalised to a greater degree
in countries with a lower than a higher level of gender equality (Ferree et al., 1999; West and
Zimmerman, 1987). This normalisation may act as a ‘buffer’ that prevents women from
invoking justice phenomena over gendered housework division (Greenstein, 2009). Second,
country-level gender equality confers a level of gender empowerment (e.g. institutional, legal
housework as a distributive justice process and to seek a sense of fairness in this process
(Braun et al., 2008). Women may thus be more empowered to exercise their agency and
invoke justice phenomena over gendered housework division in countries with a higher than
a lower level of gender equality (Greenstein, 2009; Scott et al., 2012; Walby, 2009).
It is worth noting that both of the above mechanisms are primarily concerned with the
relative gender roles and equity between women and men (Crosby, 1982; Greenstein, 2009).
Therefore, we would expect country-level gender equality to affect women’s perceptions of
fairness based on relational comparison between partners (Greenstein, 2009), as specified in
Hypothesis 4. In contrast, however, neither of the above mechanisms explicitly encourage
women to conduct referential comparison with other women; nor do they underline the
importance of intra-gender equality between women. Therefore, if the activation of fairness
perceptions requires an exact match between fairness justification at the country level and
specific dimensions of fairness comparison, we would not expect contextual forces with an
emphasis on female-male equality to moderate the influence of intra-gender referential
comparison on family life satisfaction. However, if the activation of fairness perception is
dependent on more diffuse contextual forces, women may be more sensitive to the issue of
housework division in general, and thus more susceptible to referential comparison with other
women, in countries with a higher level of gender equality. This supposition is specified in
Hypothesis 5.
Hypothesis 4 (contextual moderation of relational fairness): the association between
Hypothesis 5 (contextual moderation of referential comparison): the association
between within-country referential comparison and women’s family life satisfaction is stronger in countries with a higher level of gender equality.
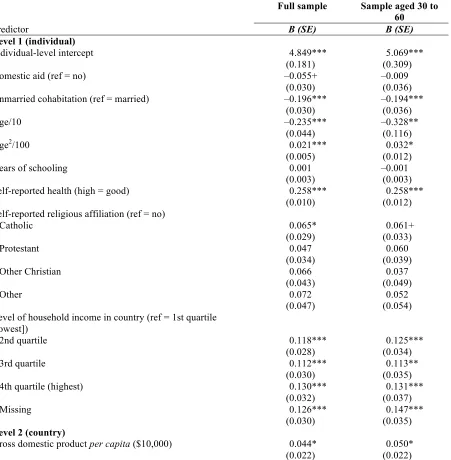
Data and Sample
We drew on two sources of data. The individual-level data were obtained from the 2012
release of the International Social Survey Programme (ISSP), entitled ‘Family and Changing
Gender Roles’ (IV). The ISSP is an annual survey programme that collects cross-sectional
cross-national data covering a diverse array of important topics of social science research.
Although sampling procedures differ slightly between countries, the ISSP is generally based
on a simple or multi-stage stratified random sample of households, with one respondent aged
16 or above selected randomly from each household. The resulting sample is representative
of the adult population in a given participating country. The 2012 ISSP provides the most
up-to-date and comparable measures of people’s gender ideologies, housework division and
family life satisfaction across a wide range of countries. The country-level indicators were
obtained from the United Nations Development Programme (UNDP, 2012).
To construct our analytical sample, we used data from 30 countries: Argentina,
Australia, Austria, Bulgaria, Canada, Chile, Croatia, Czech, Denmark, Finland, France,
Germany, Iceland, Ireland, Israel, Japan, Korea (South), Latvia, Lithuania, Mexico, Norway,
the Philippines, Poland, Russia, Slovakia, Slovenia, Sweden, Switzerland, the United
Kingdom and the United States. Seven countries originally covered by the 2012 ISSP, namely
China, India, Spain, South Africa, Taiwan, Turkey and Venezuela, were excluded from the
analytical sample due to the absence of comparable or reliable measures for the key variables.
We restricted our sample to women, because the gender ideology measures focused
estimates of their housework time (Lee and Waite, 2005). As the focus of the research was the
relative division of housework between women and men, and as the dynamics of same-sex
union vary considerably across countries, we further restricted our analytical sample to
respondents in unmarried or married heterosexual cohabiting relationships. Of the 12,785
women who co-resided with their partners in the 30 countries sampled, 2,318 (c. 18% of the
original ISSP sample) were eliminated for failing to provide valid information on key
variables such as family life satisfaction, gender ideology and housework division, yielding
an analytical sample of 10,467 women. Further tests indicated that the respondents eliminated
due to missing information on the key variables were older (Mage = 50.57, SD = 16.02) than those who provided full sets of information (Mage = 47.30, SD = 14.30; t = 9.90, p < .001). As a result, our analytical sample slightly under-represented elder females. Table 1 presents
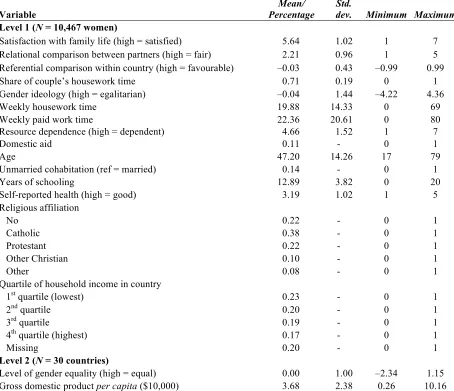
summary statistics for all of the variables for the analytical sample (see Supplementary Table
S1 for descriptive statistics aggregated at the country level).
[Table 1 about here]
Key Variables
Satisfaction with Family Life
In the 2012 ISSP, the respondents were asked the following question: ‘all things considered,
how satisfied are you with your family life?’ The responses were recorded on a 7-point scale
ranging from ‘completely satisfied’ (1) to ‘completely dissatisfied’ (7). We reversed the scale
so that a higher score indicated greater family life satisfaction. The indices fell within a range
sufficient to assume a normal distribution.
The survey respondents were asked to report the number of hours per week they and their
co-residing partners, respectively, spent on housework (not including care provision).
Although this generic measure provides a less accurate estimate of time than time diaries, the
ISSP is the only large-scale cross-national survey to contain measures of gender ideology,
housework division and family life satisfaction. According to Lee and Waite (2005), women
tend to accurately estimate both their own and their partners’ housework time. To minimise
the influence of outlier responses, we replaced the top 1% of the reports of the respondents’
and spouses’ weekly housework time to be equal to the 99th percentile rank of 69 hours per week. The women spent an average of 19.88 hours on housework per week. We divided each
woman’s weekly housework time by the corresponding couple’s total weekly housework
time to yield the respondent’s relative share of the couple’s housework time. The measure
ranged between 0 and 1, with 0 indicating that the woman undertook none of the housework
and 1 indicating that the woman undertook all of the housework. On average, the women
shouldered 71% of the total housework time. Our additional checks indicated that this
time-use measure was consistent with the measures used in previous research (see
Supplementary Table S2).
Gender Ideology
The respondents were asked to report on a 5-point scale the degree to which they agreed with
each of the following statements: (a) ‘a working mother can establish just as warm and secure
a relationship with her children as a mother who does not work’, (b) ‘all in all, family life
suffers when the woman has a full-time job’, (c) ‘a job is alright, but what most women really
want is a home and children’, (d) ‘being a housewife is just as fulfilling as working for pay’
and (e) ‘a man’s job is to earn money; a woman’s job is to look after the home and family’.
ideology (Braun et al., 2008; Greenstein, 2009). For each indicator, a higher score
consistently indicated stronger disagreement with the statement and thus a less traditional
gender ideology. Exploratory factor analysis, specifically Varimax rotation, showed that the
five measures formed a single factor with an eigenvalue of 1.46. Next, the Bartlett method
was used to extract the gender-ideology index, with a higher score indicating a more
egalitarian ideology. The value of Cronbach’s alpha indicated a high level of internal
consistency among the five indicators (α = 0.78), and the alpha score could not be increased further by adding or eliminating items.
Dimensions of Fairness Comparison
Inter-gender relational comparison between partners. The respondents were asked the following question: ‘which of the following best applies to the sharing of household work
between you and your spouse/partner?’ The responses were coded on a 5-point scale ranging
from ‘I do much more than my fair share’ (1, 29.6%) through ‘I do more than my fair share’
(2, 26.8%), ‘I do about my fair share’ (3, 38.6%) and ‘I do less than my fair share’ (4, 3.3%)
to ‘I do much less than my fair share’ (5, 1.7%). In previous research, this variable has been
coded as a categorical measure (Braun et al., 2008; Lavee and Katz, 2002) or a continuous
measure (Greenstein, 2009). As the indices fell within a range sufficient to assume a normal
distribution, we coded the variable as a continuous measure, with higher values indicating
greater perceived fairness. The women who reported undertaking less than their fair share of
housework may also have experienced less family life satisfaction due to the lack of equity in
housework division. However, the results of our additional tests based on a sample excluding
these women and using an ordinal coding scheme were consistent with those reported here
Intra-gender referential comparison within country. To measure within-country referential comparison (Major, 1993; Thompson, 1991), we first calculated the
country-specific percentile rankings of the gender-ideology index and women’s share of
couples’ housework time, respectively. We reversed the latter ranking so that a higher score
indicated a smaller share of female housework time and thus a less traditional housework
division. We then calculated the referential comparison index by subtracting the gender
ideology percentile rank score from the housework share percentile rank score. The index,
originally ranging from –99 to 99, was rescaled to range from –0.99 to 0.99 to enhance the
efficiency of multilevel modelling (Snijders and Bosker, 2011). A value of 0 indicated a ‘level
comparison’, i.e. the respondent ranked similarly in terms of both housework division and
gender ideology relative to other women in a given country. A smaller (more negative) value
indicated an ‘unfavourable comparison’, i.e. the respondent ranked farther towards the
inequitable side of housework division than that of gender ideology. Conversely, a larger
(more positive) value indicated a ‘favourable comparison’, i.e. the respondent ranked farther
towards the less traditional side of housework division than that of gender ideology. When
gender ideology is controlled for in statistical models, the index would denote the degree to
which the respondents undertook a more (or less) egalitarian share of housework compared
with other women in the same country displaying similar gender ideologies.
Country-level Gender Equality
To measure the overall level of gender equality in each country, we drew on the 2012 gender
inequality index developed by the UNDP. Constructed from multiple indicators of progress
towards gender equality, such as education, political empowerment, labour-market
participation and economic empowerment, the index provides a synthesised measure of the
1; we reversed the index so that a larger value indicated a higher level of gender equality in a
given country. We then standardised the index to take a mean value of 0 and a standard
deviation of 1.
Covariates
We controlled for the respondents’ age and its quadratic form to account for potential
non-linearity. The respondents were between 17 and 79 years old. We distinguished between
unmarried (14%) and married cohabiting relationships. We also controlled for respondents’
years of schooling as a linear regressor (M = 12.89, SD = 3.82). Religiosity is known to enforce traditional gender roles and ideologies (Voicu et al., 2009). Thus, we controlled for
respondents’ self-reported religious affiliation using a series of dummy variables, noting
whether the respondents were Catholic (38%), Protestant (22%) or affiliated with any other
Christian (10%) or non-Christian (8%) religions. As individuals’ health may influence their
family life satisfaction and the degree to which they are capable of performing housework,
we also took account of the respondents’ self-reported health, which was recorded on a
5-point scale ranging from ‘excellent’ (1) to ‘poor’ (5). We reversed the scale so that a higher
score indicated a better state of self-perceived health.
We took account of women’s time availability by controlling for their weekly paid
work hours (M = 22.36, SD = 20.61). To minimise the influence of outlier responses, we replaced the top 1% of reported weekly paid work time to be equal to the 99th percentile rank of 80 hours per week. Women’s perceptions of the fairness of housework division may be
mitigated by their economic (in)dependence (Lennon and Rosenfield, 1994). In the ISSP, the
respondents were asked the following question: ‘considering all sources of income, between
you and your spouse/partner, who has the higher income?’. The answers were recorded on a
same income’ (4) to ‘I have no income’ (7). A larger value indicated a higher level of
resource dependence. As both housework division and fairness perception are susceptible to
the use of domestic outsourcing (Lennon and Rosenfield, 1994), we coded a case as ‘using
domestic aid’ if one or more routine chores (e.g. laundry, cleaning, preparing meals or
shopping) were done by a third person (11%). Family socioeconomic status was controlled
for using the quartile rank of household income in 2012 for each country. As around 20% of
the respondents in our analytical sample failed to provide income information, we coded the
missing responses as a separate category in addition to the quartile rank to minimise sample
loss. Country-level economic development is known to condition both the demand for
domestic labour at the household level and the perception of the fairness of housework
division (Greenstein, 2009). Thus, we controlled for the national gross domestic product per capita in 2012.
In our preliminary analysis, we experimented with including a number of additional
variables: whether respondents resided in rural or urban areas, the duration of marriage, the
presence of pre-school (aged between 0 and 6) minor children, the presence of school-aged
minor children (aged between 7 and 17) and the number of routine residents in the household.
These variables were excluded from the analysis reported in this article because they were
not found to be significantly associated with family life satisfaction, and their inclusion
neither affected the interpretation of the other variables nor helped to increase the overall
model fit.
Analytical Strategy
The analysis was performed using two-level mixed-effects models (Bryan and Jenkins, 2016).
Model 1 included all of the variables except the two fairness comparison measures. Model 2
within country, respectively. To examine the potential mediating effects of different
dimensions of fairness comparison, we included both fairness comparison measures in Model
4. In Model 5, we tested the ‘self-serving’ hypothesis by including the interaction between
relational comparison and referential comparison. Model 6 to Model 9 were fitted to test the
contextual moderation hypotheses. In Model 6 and Model 8, we included random slopes for
relational comparison and referential comparison, respectively, for each country. In Model 7
and Model 9, we added the interaction terms of country-level gender equality with relational
comparison and referential comparison, respectively. We then compared Models 6 and 7 and
Models 8 and 9 to estimate the degree to which the random slope for each dimension of
fairness comparison was explained by the varying levels of gender equality across the 30
countries (Schmidt-Catran and Fairbrother, 2016)
A number of additional tests were conducted to ensure the robustness of the results.
First, the results reported in this article were robust when the analytical sample was limited to
women aged between 30 and 60 (see Supplementary Table S3 Panel B and Table S4 Panel B).
Second, the results were also robust to the non-linear specifications of birth cohort and
women’s weekly paid work time (see Supplementary Table S3 Panel C and Table S4 Panel
C). Third, although our main aim was to examine cross-level interactions, the results were
robust to the inclusion of a number of individual-level interactions (see Supplementary Table
S5). Fourth, variance inflation factor (VIF) tests yielded VIF values well below the threshold
of 5 for all variables except the quadratic term of age.
Results
Family Life Satisfaction: Relational and Referential Fairness Comparison
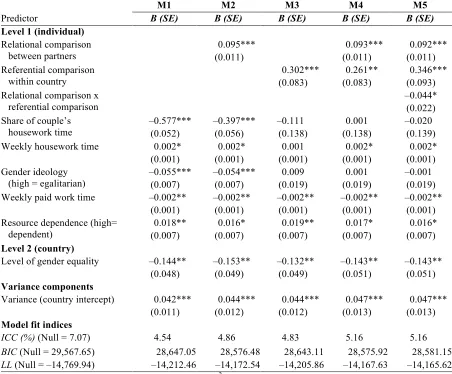
Table 2 presents the results (unstandardised coefficients) of the two-level mixed-effects
coefficients (denoted by the Greek letter ‘β’) and predictive margins with 95% confidence
intervals in the text to aid the interpretation and comparison of effect sizes. To conserve
space, we present the results for the covariates from the full model (i.e. Model 4 in Table 2)
in Supplementary Table S6, as these results were highly consistent across the models.
[Table 2 about here]
The results from Model 2 supported Hypothesis 1: that women’s perceptions of the
fairness of the division of housework between partners positively predicts their satisfaction
with family life. The women enjoyed greater family life satisfaction when they perceived the
division of housework between partners to be fair (relational fairness = 5, predictive margin:
5.911 [5.849, 5.972]) rather than unfair (relational fairness = 1, predictive margin: 5.530
[5.498, 5.561]), when all other continuous variables took the mean level and categorical
variables took the mode of the sample. The association between relational fairness and family
life satisfaction was also sizeable2 (β = 0.091 [0.071, 0.111]) compared with the equivalent associations of variables such as gender ideology (β = –0.078 [–0.098, –0.059]), resource
dependence (β = 0.025 [0.005, 0.045]) and country-level economic development (β = 0.093 [–
0.004, 0.191]), which are traditionally understood to have a considerable impact on women’s
family life satisfaction (Greenstein, 2009; Greenstein, 1996; Lennon and Rosenfield, 1994).
Notably, the inclusion of relational comparison between partners in Model 2 mediated 31.11%
of the association between women’s actual share of housework and their family life
satisfaction.
The results from Model 3 supported Hypothesis 2: that women’s family life satisfaction
is positively associated with their favourable intra-gender referential comparison within
country. The women enjoyed greater family life satisfaction when their share of housework
compared favourably (referential comparison = 1.5 standard deviations above the mean,
1.5 standard deviations below the mean, predictive margin: 5.449 [5.339, 5.558]) with that of
other women from the same country with a similar gender ideology, holding constant all
other continuous variables at the mean level and categorical variables at the mode of the
sample. The inclusion of referential comparison mediated 81.76% of the association between
women’s share of housework and their family life satisfaction. The effect size of referential
comparison (Model 4: β = 0.112 [0.042, 0.182]) was also comparable to that of relational
comparison between partners (Model 4: β = 0.093 [0.072, 0.114]). Notably, in Model 4, the
inclusion of both dimensions of fairness comparison mediated and thus explained almost all
of the association between women’s family life satisfaction and their share of housework.
Comparing Models 2, 3 and 4 clearly reveals that the two dimensions of fairness
comparison had little mediation effect. Relational fairness mediated 14.04% of the
association between referential comparison and family life satisfaction, whereas referential
comparison mediated as little as 1.86% of the association between relational fairness and
family life satisfaction. This is consistent with the theoretical premise that the two
dimensions have distinct underlying constructs and mechanisms, and may thus affect
women’s family life satisfaction through independent channels.
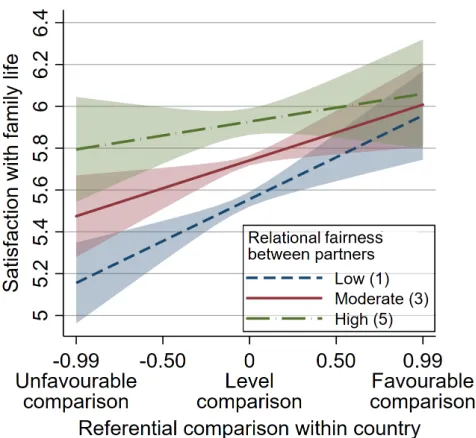
[Figure 1 about here]
The results of Model 5 supported Hypothesis 3: that the association between referential
fairness comparison and family life satisfaction is stronger when the perceived level of
relational fairness between partners is low rather than high. To aid interpretation of the
interaction effect, Figure 1 depicts the predictive margin of family life satisfaction by
women’s referential comparison within country at distinct levels of perceived fairness
between partners. It is clear that relational fairness made a much bigger difference to
women’s family life satisfaction when they compared unfavourably (left end of Figure 1)
Therefore, the results supported the theory of ‘self-serving dissonance reduction’ (Buunk and
VanYperen, 1991; Festinger, 1954; Major, 1993), which suggests that women rely on more
favourable comparison referents in their life-quality assessment to maximise their satisfaction
with family life.
Cross-country Moderation: Relational vs Referential Fairness Comparison
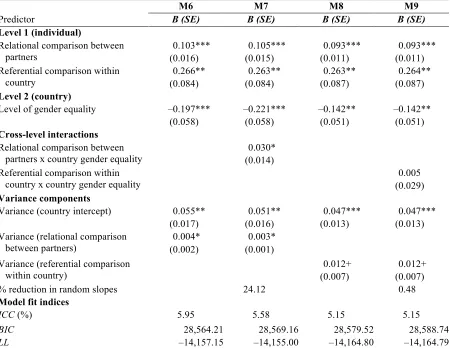
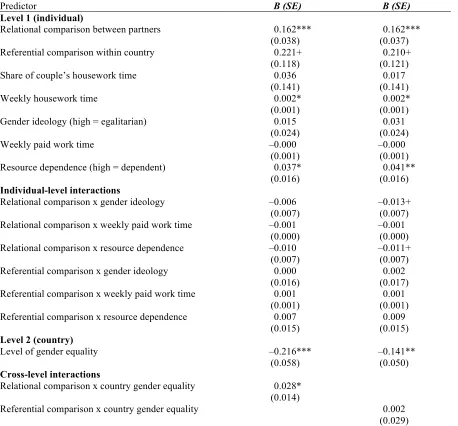
Table 3 presents the results (unstandardised coefficients) for the cross-level interactions
between country-level gender equality and the two dimensions of individual-level fairness
comparison, respectively. We also present the standardised coefficients in the text to aid the
interpretation and comparison of effect sizes. In Figure 2, we illustrate these interactions by
plotting the predictive margins of family life satisfaction by relational (Panel A) and
referential (Panel B) fairness comparison, respectively, at distinct levels of country-level
gender equality.
[Table 3 and Figure 2 about here]
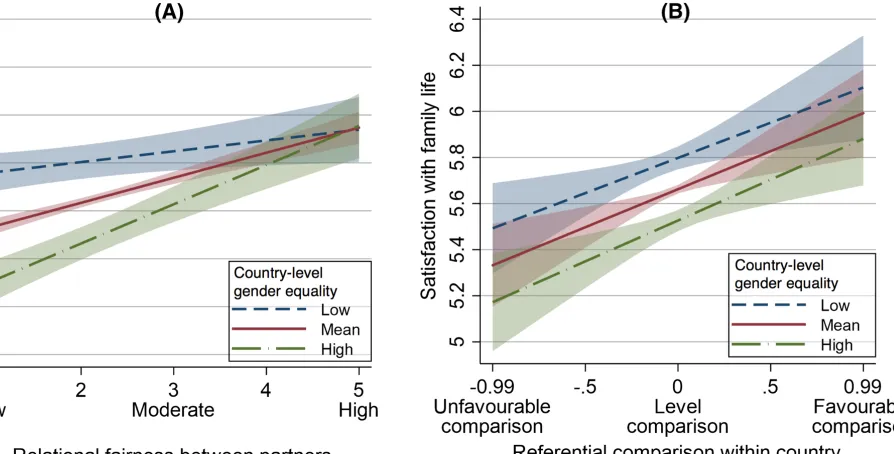
The results supported Hypothesis 4 (Model 7), as country-level gender equality
moderated the strength of the association between women’s family life satisfaction and
relational fairness between partners. As depicted in Panel A of Figure 2, the slopes for
relational fairness were substantially steeper in countries with a higher level of gender
equality. When the division of housework between partners was perceived to be unfair (left
end of Panel A), women enjoyed substantially less family life satisfaction in countries with
greater gender equality. In contrast, when women perceived the division of housework
between partners to be fair (right end of Panel A), their family life satisfaction varied little
with country-level gender equality. The strength of this cross-level interaction was
considerable (β = 0.019 [0.002, 0.037]) when compared with the individual-level interactions
–0.015 [–0.033, –0.004]) and resource dependence (β = –0.012 [–0.030, 0.006]), respectively
(see Supplementary Table S6). Yet the latter factors have been identified as the major
justifications that may moderate women’s perceptions of the fairness of the division of
housework between partners (Braun et al., 2008; Greenstein, 1996; Lennon and Rosenfield,
1994).
The importance of national context in conditioning the link between relational
fairness and women’s family life satisfaction is also supported by the model fit indices. In
Model 6, the addition of random slopes for relational fairness substantially improved the
overall model fit relative to the full model (i.e. Model 4, ΔBICM6-M4 = –11.71, ΔLLM6-M4 =
10.48). In particular, the inclusion of the interaction between relational fairness and
country-level gender equality in Model 7 explained 24.12% of the random-slope variance for
relational fairness across the 30 countries. The results concur with the assumption of the
distributive justice framework that country-level gender equality may help denormalise and
invoke justice phenomena over the gendered division of housework (Braun et al., 2008;
Greenstein, 2009).
Hypothesis 5 was not supported by the results (Model 9), as the strength of the
association between women’s referential comparison within country and their family life
satisfaction was not found to vary with country-level gender equality. Although the random
slopes for referential comparison were statistically significant at the 10% level (Model 8), the
inclusion of cross-level interaction between referential comparison and country-level gender
equality (Model 9) reduced the random-slope variance by 0.48% only. This is vividly
depicted in Panel B of Figure 2, in which all of the slopes are parallel and the confidence
intervals considerably overlap. Taken together, the results indicate that country-level gender
between male and female partners; it does not seem to diffusely affect women’s intra-gender
referential comparison.
Conclusions and Discussion
The ‘stalled’ and ‘uneven’ gender revolution in the domestic sphere may have important
implications for women’s satisfaction with family life (Forste and Fox, 2012; Frisco and
Williams, 2003; Lavee and Katz, 2002); and this revolution is unlikely to move forward
without the realisation that the gendered division of household work is unfair and inequitable
(Braun et al., 2008; Freudenthaler and Mikula, 1998; Kluwer, 1998). Expanding on the
distributive justice framework of housework division (Major, 1993; Thompson, 1991), we
contribute to existing scholarship by (1) explicitly theorising, measuring and comparing
distinctive dimensions of fairness comparison and their interactive roles in determining
women’s family life satisfaction, and (2) disentangling the ways in which country-level
gender equality conditions the implications of different dimensions of fairness comparison
for family life satisfaction. Our analysis of cross-national data from the 2012 ISSP and the
UNDP yielded the following three major findings, which provide fresh and crucial insights
into the progress of the domestic gender revolution.
First, we argued for and demonstrated the importance of considering the perceived
fairness of housework division as a plural rather than a unidimensional construct. Previous
research has focused on fairness comparison between partners (e.g. Braun et al., 2008;
Greenstein, 1996 and 2009; Lavee and Katz, 2002; Lennon and Rosenfield, 1994; Ruppanner,
2010). However, our results clearly showed that both a lack of inter-gender relational fairness
between partners and relatively unfavourable intra-gender referential comparison within a
given society had a considerable net negative association with women’s satisfaction with
together they mediated and thus explained the link between gendered housework division and
family life satisfaction. These results underline the fact that women may draw simultaneously
on multiple referents to evaluate fairness. As substantially different mechanisms underlie the
two dimensions of fairness comparison (i.e. equitable social exchange and relative
deprivation for relational fairness vs social advantage for referential comparison; see Buunk
and VanYperen, 1991; Major, 1993; Thompson, 1991), it is essential to distinguish the
different dimensions in both conceptualisation and operationalisation.
Second, distinct dimensions of fairness comparison do not operate in isolation to
determine women’s family life satisfaction. We found a notable moderation effect between
the two dimensions of fairness comparison. The association between one dimension of
fairness comparison and family life satisfaction was stronger when women compared
unfavourably or otherwise perceived a lack of fairness in the other dimension. This is
consistent with the ‘self-serving’ theory: individuals tend to rely on the least unfavourable
referent to construct their fairness perceptions as a ‘dissonance reduction’ strategy to
maximise their subjectively perceived life satisfaction (Crosby, 1982; Festinger, 1954 and
1962). As a result, as long as women continue to fall back on the more ‘favourable’
comparison referent to evade ‘harm’ and reinforce a positive view of the status quo, the
progress of the domestic gender revolution is likely to falter at the weakest chain that
provides the most ‘convenient’ justification for the gendered division of domestic labour.
Therefore, the finding reiterates the importance of distinguishing between dimensions of
fairness comparison and examining their interaction to address intersecting challenges to the
domestic gender revolution (Esping-Andersen et al., 2013; Walby, 2009).
Third, the findings shed new light on the role of individual-context interaction in
justifying the outcomes of fairness comparison with regard to the division of housework,
It is hardly a novel observation that individual-level gender dynamics are socially embedded
and context dependent (Ferree et al., 1999; Greenstein, 2009; West and Zimmerman, 1987).
However, it remains largely unclear whether macro-level gender equality provides a diffuse
sense of gender empowerment/normalisation or whether this empowerment/normalisation is
limited to specific dimensions of fairness perception. Our results supported the latter
assumption, as country-level gender equality was found to moderate the impact on women’s
family life satisfaction of inter-gender relational fairness between partners alone—not that of
intra-gender referential comparison within a given country. This finding is unsurprising,
because gender and feminist campaigns predominantly emphasise equality between women
and men (Scott et al., 2012), not equality among women. When considered in conjunction
with women’s ‘self-serving’ strategy of constructing perceptions of fairness, the results
suggest that it is insufficient to focus on only one dimension of fairness comparison, such as
the equality between women and men. To move the domestic gender revolution forward, it is
also crucial to consider (in)equality amongst women, to reduce intra-gender disparities, and
to invoke justice phenomena over the gendered division of housework in multiple
dimensions.
The limitations of this study suggest several important directions for future research.
First, we focused on two distinct dimensions of fairness comparison to illustrate the
theoretical salience of comparing dimensions of fairness perception; it will be important for
future scholars to consider a broader range of comparison referents, such as intergenerational
and temporal comparisons. Second, as the ISSP surveyed only one randomly selected
member of each couple, future researchers could collect data from both partners to
investigate the intersection between dyadic dynamics at couple level and in distinct national
contexts. Third, as we analysed cross-sectional data, the results can only be interpreted in
the perceived fairness of housework division—i.e. whether and how individuals (re)act on
perceiving a lack of fairness—is an important task for future research. Fourth, our focus on
women tells only half of the story. It is also crucial to collect and analyse reliable data from
men to provide comprehensive recommendations for advancing the gender revolution.
Notes
1. We use the term ‘partner’ to refer to both married spouses and the members of unmarried
cohabiting couples.
2. As different predictors were coded on different scales, we standardised all continuous
predictors in our additional tests to compare the effect sizes of different variables, in
addition to the unstandardised coefficients presented in the tables. The dependent variable
References
Braun, M., Lewin-Epstein, N., Stier, H., and Baumgärtner, M. K. (2008). Perceived equity in
the gendered division of household labor. Journal of Marriage and Family, 70, 1145– 1156.
Bryan, M. L., and Jenkins, S. P. (2016). Multilevel modelling of country effects: A
cautionary tale. European Sociological Review, 32, 3–22.
Buunk, B. P., and VanYperen, N. W. (1991). Referential comparisons, relational
comparisons, and exchange orientation: Their relation to marital satisfaction',
Personality and Social Psychology Bulletin, 17, 709-717.
Crosby, F. J. (1982). Relative Deprivation and Working Women. New York: Oxford University Press.
Davis, S. N., and Greenstein, T. N. (2009). Gender ideology: Components, predictors, and
consequences. Annual Review of Sociology, 35, 87–105.
Esping-Andersen, G., Boertien, D., Bonke, J., and Gracia, P. (2013). Couple specialization in
multiple equilibria. European Sociological Review, 29, 1280–1294.
Ferree, M. M., Lorber, J., and Hess, B. B. (1999). Revisioning Gender. Oxford: Rowman Altamira.
Festinger, L. (1954). A theory of social comparison processes. Human Relations, 7, 117-140. Festinger, L. (1962). A Theory of Cognitive Dissonance. Redwood City, CA: Stanford
University Press.
Forste, R., and Fox, K. (2012). Household labor, gender roles, and family satisfaction: A
cross-national comparison. Journal of Comparative Family Studies, 43, 613–631. Freudenthaler, H. H., and Mikula, G. (1998). From unfulfilled wants to the experience of
injustice: Women’s sense of injustice regarding the lopsided division of household
Frisco, M. L., and Williams, K. (2003). Perceived housework equity, marital happiness, and
divorce in dual-earner households. Journal of Family Issues, 24, 51–73.
Greenstein, T. N. (1996). Gender ideology and perceptions of the fairness of the division of household labor: Effects on marital quality. Social Forces, 74, 1029–1042.
Greenstein, T. N. (2009). National context, family satisfaction, and fairness in the division of
household labor. Journal of Marriage and the Family, 71, 1039–1051.
Himsel, A. J., and Goldberg, W. A. (2003). Social comparisons and satisfaction with the
division of housework. Journal of Family Issues, 24, 843–866.
Kluwer, E. S. (1998). Responses to gender inequality in the division of family work: The
status quo effect. Social Justice Research, 11, 337–357.
Knudsen, K., and Wærness, K. (2008). National context and spouses’ housework in 34
countries. European Sociological Review, 24, 97–113.
Lachance-Grzela, M., and Bouchard, G. (2010). Why do women do the lion’s share of
housework? A decade of research. Sex Roles, 63, 767–780.
Lavee, Y., and Katz, R. (2002). Division of labor, perceived fairness, and marital quality: The
effect of gender ideology. Journal of Marriage and Family, 64, 27–39.
Lee, Y. S., and Waite, L. J. (2005). Husbands’ and wives’ time spent on housework: A
comparison of measures. Journal of Marriage and Family, 67, 328–336.
Lennon, M. C., and Rosenfield, S. (1994). Relative fairness and the division of housework:
The importance of options. American Journal of Sociology, 100, 506–531.
Major, B. (1993). Gender, entitlement, and the distribution of family labor. Journal of Social Issues, 49, 141–159.
Mikula, G., Schoebi, D., Jagoditsch, S., and MacHer, S. (2009). Roots and correlates of
Runciman, W. G. (1966) Relative Deprivation and Social Justice. Berkeley: University of California Press.
Ruppanner, L. (2010). Conflict and housework: Does country context matter? European Sociological Review, 26, 557–570.
Schmidt-Catran, A. W., & Fairbrother, M. (2016). The random effects in multilevel models:
Getting them wrong and getting them right. European Sociological Review, 32, 23– 38.
Scott, J. L., Dex, S., and Plagnol, A. (2012). Gendered Lives: Gender Inequalities in Production and Reproduction. Cheltenham: Edward Elgar Publishing.
Snijders, T. A. B., and Bosker, R. J. (2011). Multilevel Analysis: An Introduction to Basic and Advanced Multilevel Modeling. London: Sage.
Thompson, L. (1991). Family work: Women’s sense of fairness. Journal of Family Issues, 12, 181–196.
United Nations Development Programme. (2012). Gender inequality index. Last accessed, 4
September 2017: http://hdr.undp.org/en/content/gender-inequality-index-gii
Voicu, M., Voicu, B., and Strapcova, K. (2009). Housework and gender inequality in
European countries. European Sociological Review, 25, 365–377.
Walby, S. (2009). Globalization and Inequalities: Complexity and Contested Modernities.
London: Sage.
Table 1. Descriptive statistics of all variables in analysis
Variable
Mean/ Percentage
Std.
dev. Minimum Maximum Level 1 (N = 10,467 women)
Satisfaction with family life (high = satisfied) 5.64 1.02 1 7 Relational comparison between partners (high = fair) 2.21 0.96 1 5 Referential comparison within country (high = favourable) –0.03 0.43 –0.99 0.99
Share of couple’s housework time 0.71 0.19 0 1
Gender ideology (high = egalitarian) –0.04 1.44 –4.22 4.36
Weekly housework time 19.88 14.33 0 69
Weekly paid work time 22.36 20.61 0 80
Resource dependence (high = dependent) 4.66 1.52 1 7
Domestic aid 0.11 - 0 1
Age 47.20 14.26 17 79
Unmarried cohabitation (ref = married) 0.14 - 0 1
Years of schooling 12.89 3.82 0 20
Self-reported health (high = good) 3.19 1.02 1 5
Religious affiliation
No 0.22 - 0 1
Catholic 0.38 - 0 1
Protestant 0.22 - 0 1
Other Christian 0.10 - 0 1
Other 0.08 - 0 1
Quartile of household income in country
1st quartile (lowest) 0.23 - 0 1
2nd quartile 0.20 - 0 1
3rd quartile 0.19 - 0 1
4th quartile (highest) 0.17 - 0 1
Missing 0.20 - 0 1
Level 2 (N = 30 countries)
Level of gender equality (high = equal) 0.00 1.00 –2.34 1.15
Table 2. Two-level mixed effects regression models predicting women’s satisfaction with family life (N = 10,467)
M1 M2 M3 M4 M5
Predictor B (SE) B (SE) B (SE) B (SE) B (SE)
Level 1 (individual) Relational comparison
between partners
0.095*** 0.093*** 0.092***
(0.011) (0.011) (0.011)
Referential comparison within country
0.302*** 0.261** 0.346*** (0.083) (0.083) (0.093) Relational comparison x
referential comparison
–0.044* (0.022) Share of couple’s
housework time
–0.577*** –0.397*** –0.111 0.001 –0.020 (0.052) (0.056) (0.138) (0.138) (0.139)
Weekly housework time 0.002* 0.002* 0.001 0.002* 0.002*
(0.001) (0.001) (0.001) (0.001) (0.001) Gender ideology
(high = egalitarian)
–0.055*** –0.054*** 0.009 0.001 –0.001 (0.007) (0.007) (0.019) (0.019) (0.019) Weekly paid work time –0.002** –0.002** –0.002** –0.002** –0.002**
(0.001) (0.001) (0.001) (0.001) (0.001) Resource dependence (high=
dependent)
0.018** 0.016* 0.019** 0.017* 0.016*
(0.007) (0.007) (0.007) (0.007) (0.007) Level 2 (country)
Level of gender equality –0.144** –0.153** –0.132** –0.143** –0.143** (0.048) (0.049) (0.049) (0.051) (0.051) Variance components
Variance (country intercept) 0.042*** 0.044*** 0.044*** 0.047*** 0.047*** (0.011) (0.012) (0.012) (0.013) (0.013) Model fit indices
ICC (%) (Null = 7.07) 4.54 4.86 4.83 5.16 5.16
BIC (Null = 29,567.65) 28,647.05 28,576.48 28,643.11 28,575.92 28,581.15 LL (Null = –14,769.94) –14,212.46 –14,172.54 –14,205.86 –14,167.63 –14,165.62 Note: Models also controlled for respondents’ age, age2,unmarried cohabitation (as opposed to married), years of
schooling, self-reported health, self-reported religious affiliation, level of household income in country, and country gross domestic product per capita in 2012, and individual-level intercept. See Supplementary Table S6 for the results for the covariates. ICC = Intra-class correlation. BIC = Bayesian information criterion. LL = Log-likelihood.
Table 3. Selected results for cross-level interactions from two-level mixed effects regression models predicting women’s satisfaction with family life (N = 10,467)
M6 M7 M8 M9
Predictor B (SE) B (SE) B (SE) B (SE)
Level 1 (individual)
Relational comparison between partners
0.103*** 0.105*** 0.093*** 0.093***
(0.016) (0.015) (0.011) (0.011)
Referential comparison within country
0.266** 0.263** 0.263** 0.264**
(0.084) (0.084) (0.087) (0.087)
Level 2 (country)
Level of gender equality –0.197*** –0.221*** –0.142** –0.142**
(0.058) (0.058) (0.051) (0.051)
Cross-level interactions Relational comparison between
partners x country gender equality
0.030* (0.014) Referential comparison within
country x country gender equality
0.005 (0.029) Variance components
Variance (country intercept) 0.055** 0.051** 0.047*** 0.047***
(0.017) (0.016) (0.013) (0.013)
Variance (relational comparison between partners)
0.004* 0.003*
(0.002) (0.001) Variance (referential comparison
within country)
0.012+ 0.012+
(0.007) (0.007)
% reduction in random slopes 24.12 0.48
Model fit indices
ICC (%) 5.95 5.58 5.15 5.15
BIC 28,564.21 28,569.16 28,579.52 28,588.74
LL –14,157.15 –14,155.00 –14,164.80 –14,164.79
Note: Models also controlled for all variables reported in Table 2, respondents’ age, age2,unmarried cohabitation (as opposed to married), years of schooling, self-reported health, self-reported religious affiliation, level of household income in country, country gross domestic product per capita in 2012, and individual-level intercept. See Supplementary Table S6 for the results for the covariates. ICC = Intra-class correlation. BIC = Bayesian information criterion. LL = Log-likelihood.
Figure 1. Predictive margin of women’s satisfaction with family life by referential comparison within country, at distinct levels of relational fairness.
Figure 2. Predictive margin of women’s satisfaction with family life by relational fairness between partners and referential comparison within country, by level of gender equality in country.
Note: Predictions based on Model 7 and Model 9 in Table 3. Colour bands indicate 95% confidence intervals. Low and high levels refer to 1 standard deviation below and above the grand mean value, respectively. Unfavourable comparison means one falls on the more traditional end of the relative rank of housework share than one’s position on the rank of gender ideology vis-à-vis other women in the same country. Favourable comparison means one falls on the less
S1
Online Supplement
What fairness? Gendered division of housework and family life satisfaction
across 30 countries
1. Descriptive statistics for key variables aggregated at country level (Table S1).
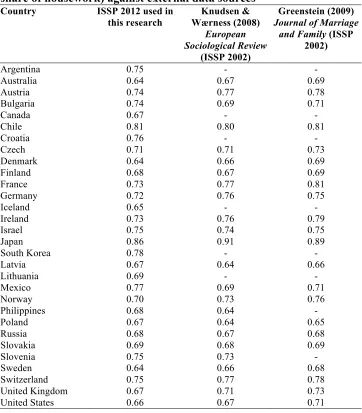
2. Validity and reliability of time-use measures (Table S2). We verified the validity and
reliability of the time-use measures (e.g. women’s share of couples’ housework time) in the 2012 ISSP by comparing our data with those reported in previous research (Greenstein, 2009; Knudsen & Wærness, 2008). The results confirmed the reliability and validity of the measures used in this research.
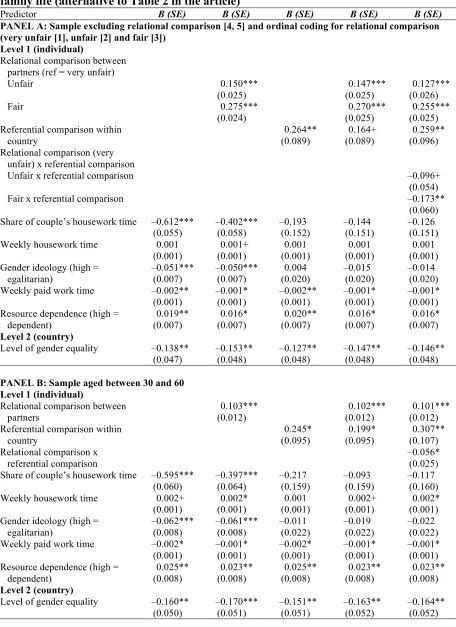
3. Alternative coding and sample for relational comparison between partners (Table S3
Panel A and S4 Panel A). As detailed in the article, we conducted robustness tests using the ordinal coding of relational comparison between partners based on the sample excluding women who reported doing less than their fair share of housework compared with their partners (Braun et al., 2008). The results of the additional models were highly consistent with those reported in the article.
4. Sample age range (Table S3 Panel B and Table S4 Panel B). Following a number of
existing studies (e.g. Braun et al., 2008; Forste and Fox, 2012; Greenstein, 2009), our analytical sample covered a wide age range: from 17 to 79 years old. To account for any potential heterogeneity arising from this wide age span, we controlled for respondents’ age as both a linear and a quadratic regressor in all of our models. To further ensure the robustness of the results, we conducted additional checks based on the analytical sample excluding the top 15% and bottom 15% of respondents in the percentile ranking for age. The results based on this restricted sample of respondents (aged between 30 and 60) were consistent with those reported in the article.
5. Non-linearity of age and weekly paid work time (Table S3 Panel C and Table S4 Panel
C). Although we included the quadratic term of age in all our models, it is possible that the women who were born between the 1940s and early 1960s may be particularly influenced by the hegemonic female-housekeeping norm. In contrast, the younger women were socialised in an environment that might have considerably redefined women’s gender role. We tested this non-linear cohort shift by including a dummy variable indicating whether the women were born before 1965, in addition to the linear and quadratic terms of age. Similarly, it is possible that the relationship between the time women spend on paid work and their gender role self-assessment/share of housework may not be linear. To ensure that our results are robust to any non-linearity in the influence of paid work time, we tested all models by including a dummy variable distinguishing between full-time employment (weekly paid work time > 35 hours) and no/part-time employment, in addition to the continuous measure of women’s weekly paid work time. The results reported in the article are robust to the inclusion of the two dummy variables in all models.
6. Individual-level interactions (Table S5). Existing research has indicated that the
S2
main aim was not to examine these individual-level moderating effects, the inclusion of these interaction terms may have influenced the interpretation of the results for our key variables and the cross-level interactions on which we focused in this research. Therefore, we also fitted additional models including a number of individual-level interactions. The results reported in the article are robust to the inclusion of the individual-level interactions.
7. Results for control variables (Table S6). To conserve space, we omitted the results for
S3
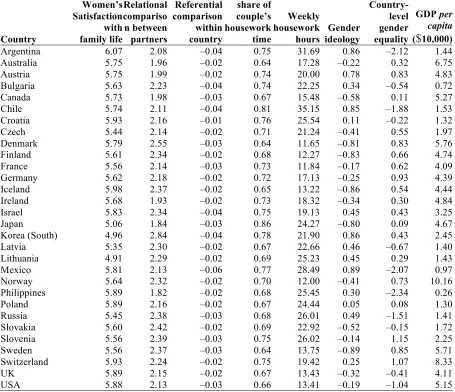
Table S1. Descriptive statistics of key variables by country
Country Women’s Satisfaction with family life Relational compariso n between partners Referential comparison within country Women’s share of couple’s housework time Weekly housework hours Gender ideology Country-level gender equality GDP per capita ($10,000)
Argentina 6.07 2.08 –0.04 0.75 31.69 0.86 –2.12 1.44
Australia 5.75 1.96 –0.02 0.64 17.28 –0.22 0.32 6.75
Austria 5.75 1.99 –0.02 0.74 20.00 0.78 0.83 4.83
Bulgaria 5.63 2.23 –0.04 0.74 22.25 0.34 –0.54 0.72
Canada 5.73 1.98 –0.03 0.67 15.48 –0.58 0.11 5.27
Chile 5.74 2.11 –0.04 0.81 35.15 0.85 –1.88 1.53
Croatia 5.93 2.16 –0.01 0.76 25.54 0.11 –0.22 1.32
Czech 5.44 2.14 –0.02 0.71 21.24 –0.41 0.55 1.97
Denmark 5.79 2.55 –0.03 0.64 11.65 –0.81 0.83 5.76
Finland 5.61 2.34 –0.02 0.68 12.27 –0.83 0.66 4.74
France 5.56 2.14 –0.03 0.73 11.84 –0.17 0.62 4.09
Germany 5.62 2.18 –0.02 0.72 17.13 –0.25 0.93 4.39
Iceland 5.98 2.37 –0.02 0.65 13.22 –0.86 0.54 4.44
Ireland 5.68 1.93 –0.02 0.73 18.32 –0.34 0.30 4.84
Israel 5.83 2.34 –0.04 0.75 19.13 0.45 0.43 3.25
Japan 5.06 1.84 –0.03 0.86 24.27 –0.80 0.09 4.67
Korea (South) 4.96 2.84 –0.04 0.78 21.90 0.86 0.43 2.45
Latvia 5.35 2.30 –0.02 0.67 22.66 0.46 –0.67 1.40
Lithuania 4.91 2.29 –0.02 0.69 25.23 0.45 0.29 1.43
Mexico 5.81 2.13 –0.06 0.77 28.49 0.89 –2.07 0.97
Norway 5.64 2.32 –0.02 0.70 12.00 –0.41 0.73 10.16
Philippines 5.89 1.82 –0.02 0.68 25.45 0.30 –2.34 0.26
Poland 5.89 2.16 –0.02 0.67 24.44 0.05 0.08 1.30
Russia 5.45 2.38 –0.03 0.68 26.01 0.49 –1.51 1.41
Slovakia 5.60 2.42 –0.02 0.69 22.92 –0.52 –0.15 1.72
Slovenia 5.56 2.39 –0.03 0.75 26.02 –0.14 1.15 2.25
Sweden 5.56 2.37 –0.03 0.64 13.75 –0.89 0.85 5.71
Switzerland 5.93 2.24 –0.02 0.75 19.42 0.25 1.07 8.33
UK 5.89 2.15 –0.02 0.67 13.43 –0.32 –0.41 4.11
USA 5.88 2.13 –0.03 0.66 13.41 –0.19 –1.04 5.15
S4
Table S2. Verification of measure reliability and validity (women’s share of housework) against external data sources
Country ISSP 2012 used in
this research Knudsen & Wærness (2008) European Sociological Review (ISSP 2002) Greenstein (2009) Journal of Marriage
and Family (ISSP 2002)
Argentina 0.75 - -
Australia 0.64 0.67 0.69
Austria 0.74 0.77 0.78
Bulgaria 0.74 0.69 0.71
Canada 0.67 - -
Chile 0.81 0.80 0.81
Croatia 0.76 - -
Czech 0.71 0.71 0.73
Denmark 0.64 0.66 0.69
Finland 0.68 0.67 0.69
France 0.73 0.77 0.81
Germany 0.72 0.76 0.75
Iceland 0.65 - -
Ireland 0.73 0.76 0.79
Israel 0.75 0.74 0.75
Japan 0.86 0.91 0.89
South Korea 0.78 - -
Latvia 0.67 0.64 0.66
Lithuania 0.69 - -
Mexico 0.77 0.69 0.71
Norway 0.70 0.73 0.76
Philippines 0.68 0.64 -
Poland 0.67 0.64 0.65
Russia 0.68 0.67 0.68
Slovakia 0.69 0.68 0.69
Slovenia 0.75 0.73 -
Sweden 0.64 0.66 0.68
Switzerland 0.75 0.77 0.78
United Kingdom 0.67 0.71 0.73