ISSN Print: 2152-2197
DOI: 10.4236/jep.2018.95033 May 24, 2018 525 Journal of Environmental Protection
Oil Spill Model Operational Application in
Damage Assessment and Case Study of
Validation
Bing Qiao, Feng Xiao, Ru Lan, Tao Li, Chunchao Li
Waterborne Transport Research Institute, Ministry of Transportation, Beijing, China
Abstract
Oil spill modeling is an important technical measure to evaluate the impact of oil spills scientifically. Because of the great uncertainty in its early develop-ment, simulation results have not been used as the basis of judgments for en-vironmental compensation cases. Despite this, scientific research institutes in many countries, including China, are still devoted to the research and devel-opment of oil spill models and their applications in environmental damage assessment, which makes it possible to apply them in the judicial arbitration of damages claims. The relevant regulations on the Chinese compensation fund for oil pollution damage from ships and the judicial authentication of environmental damage have also accredited such kind of modeling applica-tions. In order to enhance the applicability of oil spill model further, it is ne-cessary to expand its damage assessment function, and to test, calibrate and verify the accuracy of the evaluation. To this end, the author adopts the self-developed 3-dimentionaloil spill model—CWCM to simulate the “Tas-man Sea” oil spill accident. By comparing the simulation results of tidal cur-rent field, wind field, oil spill trajectory with those observed, the model coding and parameter selection are corrected, and it is realized that the simulation being basically consistent with the measured results. In addition, the results of the scale reduced simulation test of oil spill weathering are applied verifying and perfecting the weathering model of CWCM. The technical requirements and process for operational application of oil spill model in judicial arbitra-tion are also put forward. In view of the rapid simulaarbitra-tion funcarbitra-tion, the opera-tional updating program for oil spill weathering model, coupled current mod-el and dynamic update wind fimod-eld diagnostic modmod-el are put forward in order to further improve the operational evaluation function and evaluation effi-ciency of oil spill model.
How to cite this paper: Qiao, B., Xiao, F., Lan, R., Li, T. and Li, C.C. (2018) Oil Spill Model Operational Application in Damage Assessment and Case Study of Validation. Journal of Environmental Protection, 9, 525-539.
https://doi.org/10.4236/jep.2018.95033 Received: March 27, 2018
Accepted: May 21, 2018 Published: May 24, 2018 Copyright © 2018 by authors and Scientific Research Publishing Inc. This work is licensed under the Creative Commons Attribution International License (CC BY 4.0).
http://creativecommons.org/licenses/by/4.0/
DOI: 10.4236/jep.2018.95033 526 Journal of Environmental Protection
Keywords
Oil Spill Model, Ecological Environmental Damage, Identification and Evaluation, Verification, Case Study
1. Introduction
Oil spill modeling is a technical method using the principles of environmental science, and applying mathematical models to analyze and quantify drift and diffusion patterns of oil spills. Examining the scope and extent of environmental fate of oils spills may be completed by including oil spill weathering, environ-mental impact analysis, and the coupled hydrodynamic, wind field and database models. In recent years, oil spill model technology has made great progress in-ternationally. It has been widely used in oil spill risk assessment, prediction and early warning, as well as emergency response decision-making support amongst other applications.
Currently, oil spill modeling is applied in emergency response system and in-telligent information system [1] [2], as well as in-depth studies on marine eco-system impact assessment and risk prevention, such as [3]. The fast prediction model of oil spills is applied to the backwater variation zone of the Three Gorges Reservoir Area [6] to advance existing, GIS-based research on oil spill drift dif-fusion forecasting modeling [4], and to further research currently supported by special funds for scientific and technological work on the theory of oil spill mod-els [5].
Oil spill modeling is widely considered an important technical means for scientific assessment of the environmental impact of oil spills. Nevertheless, the “International Convention on Civil Liability for Oil Pollution Damage” (CLC) and the “International Fund for Compensation for Oil Pollution Damage Com-pensation Convention” (FUND) have been regarding the modeling in its pre-liminary stage since the previous century. The international maritime jurisdic-tion does not consider modeling technology as mature enough. Calculated re-sults based on the discussed models show great uncertainty. Therefore, the si-mulation results are not deemed fit as a base for compensation rulings and damage calculations continue to be determined using the traditional empirical methods instead.
DOI: 10.4236/jep.2018.95033 527 Journal of Environmental Protection function. Furthermore, suggestions for continuous improvements are made re-garding the operational program of oil spill weathering model, coupling current model, and the dynamic update wind field diagnosis model, in order to further development of the oil spill model evaluating function and operational efficien-cy.
2. Feasibility Analysis of Operational Application of Oil Spill
Model in Ecological Damage Assessment
2.1. Application Dispute and Fund Compensation Limited
Analysis
The application of oil spill modeling in the field of pollution damage compensa-tion has been limited because of a long-standing controversy. The Internacompensa-tional Maritime Commission (CMI) was founded in 1897 and undertook CLC and FUND preparation work in 1994. They adopted the guidelines on oil pollution damage to determine the scope of economic compensation claims [7]. The ele-venth clause of these guidelines states: “The compensation for environmental damage shall be limited to the actual measures taken or will be taken for rea-sonable restoration measures. The claim of damages calculated by the theoretical model on the basis of abstract quantification is not compensable.”
Despite these expressed restrictions, the guidelines also emphasize the impor-tance to carry out special research to determine the severity and scope. The fifth article states: “Pure economic loss caused by oil pollution can be compensated, but is usually limited to the following: the loss must be caused by the pollution itself. It is not enough to merely prove causation between oil spill loss and the oil discharge accident ship.” Additionally, article 12.2 states: “In order to identify or verify oil pollution damage, it is necessary to determine whether the rehabilita-tion measures are practical, and whether speeding up the natural recovery of the environment is required. If such research is in reasonable proportion to the ac-tual damage and provides or may provide the required data, reasonable fees for such research may be compensated.”
After comprehensive analysis of the above terms, it is clear that the guidelines state the need for special study of the quantification of damage in addition to providing evidence of causation. However, it is regrettable that the quantitative calculation of the oil spill model is not taken as a basis for claims. Nevertheless, the US EPA and NOAA, as well as the China Waterborne Research Institute among others, have developed an oil spill environmental damage model, and its application for damage claims in business cases remains promising.
2.2. Application Opportunity and Requirement Analysis of Fund
Compensation
DOI: 10.4236/jep.2018.95033 528 Journal of Environmental Protection measures to control or eliminate pollution costs; 3) the direct economic loss of fisheries, tourism etc.; 4) the cost of recovery of marine ecology and natural fi-shery resources; 5) China ship oil pollution damage compensation fund man-agement committee (hereinafter referred to as the “manman-agement committee”) and its secretariat by themselves or entrusting the relevant units or agencies to implement the monitoring costs incurred, such as the management committee and its secretariat by themselves or entrusting the relevant units to collect acci-dent image, the oil pollutant character image, damage image of biological re-sources, carry out the oil spill trajectory simulation, the use of oil spill surveil-lance satellite navigation, the expenses paid by the remote sensing technology for the dynamic monitoring of oil pollution; 6) other fees approved by the state council [8]. Claims document audit requirements include: The assessment of damage caused by oil spill pollution in the Marine Oil Spill Pollution Ecological Damage Assessment Report (MOSPEDAR) provided by the claimant is appro-priate, and ecological restoration measures proposed are feasible in technology.
The above terms indicate that the management committee and the secretariat may own or entrust the relevant units to carry out the monitoring work to de-termine the compensation or compensation for marine ecological restoration and natural fishery resources measures and other expenses. The monitoring work also includes “oil spill drift trajectory simulation”, and is responsible for examining whether the damage evaluation in the MOSPEDAR provided by the claimant is appropriate. On this basis, the claim is likely to get China ship source oil pollution damage compensation funding. Therefore, it is deducted that the oil spill model is feasible in the funding claims and business claims applications alike.
2.3. Application and Requirement Analysis of Environmental
Damage Judicial Expertise
According to Chinese relevant regulations, forensic identification of environ-mental damage refers to appraiser applying environenviron-mental science and technol-ogy or expertise, and use of techniques and methods of monitoring, testing, field investigation, experimental simulation or comprehensive analysis etc. within en-vironmental litigation to identify and judge the enen-vironmental pollution or eco-logical damage. The judicial authorities should prevent excessive registration and examination of qualifying institutions, which leads to vicious competition and decline in quality of identification. Authorities should encourage and sup-port the establishment of high-quality institutions with high-quality resources, while ensuring neutrality of the judicial appraisal organizations and the third party status [9].
func-DOI: 10.4236/jep.2018.95033 529 Journal of Environmental Protection tion and verifying the accuracy, and enhance its applicability in judicial exper-tise. On the other hand, it is suggest to relevant administrative departments to establish matching management system, as well as standardizing operational processes for applications.
3. Oil Spill Model Validation Case Study
3.1. Case Analysis of Oil Spill Incident Simulation Verification
3.1.1. Jiaozhou Bay “Oriental Ambassador” and Pearl River Estuary “3.24” Oil Spill Cases
The author developed the CWCM oil spill model [10] coupled with finite ele-ment simulation results of TIDE2D tidal current model [11], using Monte Carlo random walk and dissolution model for conducting 3D simulation of the oil spill trajectory and environmental fate after inputting oil spill and meteorological in-formation. By inputting the relevant data of oil spill incidents of Jiaozhou Bay “Eastern Ambassador” in 1986 and Pearl River Estuary “3.24” in 1999 into CWCM, the temporal and spatial distribution simulation results of the oil spill trajectory and fate were in good agreement with actual oil spill records [1].
In the simulation process of the above two oil spill accidents, the authors first carried out the verification of the tidal current model within the accident areas. After the tidal current model was in good agreement, the oil spill information and meteorological conditions were inputted to CWCM to perform simulation calculations. However, it was not until after collecting and inputting the actual measured meteorological data in the accident area, that the simulation results were consistent with the oil spill incident record. This highlights that up to date and accurate meteorological data is crucial to the accuracy of the oil spill model simulation results.
3.1.2. “Tasman Sea” Accident Case
“Tasman Sea” oil spill accident happened in November 2002 in Caofeidian sea area. Considering the obvious changes of the coastline in the accident period and the flow measurement period, the finite element triangular meshes of the tidal current models were made for different time periods separately. The triangular grid and its open boundary node of the accident period were shown in Figure 1.
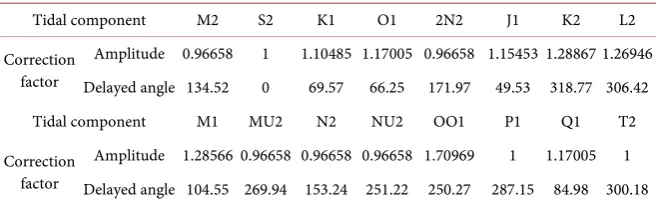
The quantity of tidal components and the amplitude and delay angle of tidal components of the boundary nodes in the numerical simulation are determined by using different literatures, respectively M2, S2, K1, O1 of four constituents
[12] and M2, S2, K1, O1, 2N2, J1, K2, L2, M1, MU2, N2, NU2, OO1, P1, Q1, T2
of sixteen constituents [13], the latter ones are used to calculate the east and north components of currents according to Equation 1and Equation 2 with pa-rameters in Table 1 [14].
(
)
(
)
16
0 i1 i i cos i i i sin i i
u u= +
∑
= F×UR× ωt E+ +UI × ωt E+ (1)(
)
(
)
16
0 i1 i i cos i i i sin i i
DOI: 10.4236/jep.2018.95033 530 Journal of Environmental Protection
Figure 1. The triangular grid and its open boundary node of “Tasman Sea” accident period.
Table 1. Value of correction factor in harmonic analysis of tidal current model
verifica-tion test.
Tidal component M2 S2 K1 O1 2N2 J1 K2 L2 Correction
factor
Amplitude 0.96658 1 1.10485 1.17005 0.96658 1.15453 1.28867 1.26946 Delayed angle 134.52 0 69.57 66.25 171.97 49.53 318.77 306.42 Tidal component M1 MU2 N2 NU2 OO1 P1 Q1 T2 Correction
factor
Amplitude 1.28566 0.96658 0.96658 0.96658 1.70969 1 1.17005 1 Delayed angle 104.55 269.94 153.24 251.22 250.27 287.15 84.98 300.18
In Equation (1) and Equation (2), u v, : the tidal current velocity component in the east and north direction; u0; v0: the tidal residual flow velocity compo-nent in the east and north direction; F Ei, i: the ith tidal component’s amplitude and delayed angle correction factors for harmonic analysis; UR UIi, i: the har-monic constants of real and imaginary value of the ith tidal component’s flow velocity in the east direction; VR VIi, i: t the harmonic constants of real and im-aginary value of the ith tidal component’s flow velocity in the north direction;
i
ω : angular velocity constant of the ith tidal component, t: GMT begun to count since 0 hour March 1, 2004.
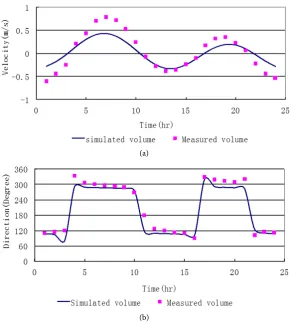
The validation and comparison results show that the flow direction simulation results are closer to the measured values when harmonic analysis of sixteen tidal currents is carried out with correction of factors (Figure 2(b)), but the simulated value of tidal current are lower than the measured value indicating there are still some deviations (Figure 2(a)). The reason may be related to the uncertainty of coastline and water depth during the period of measurement. At the same time,
[image:6.595.210.539.383.485.2]DOI: 10.4236/jep.2018.95033 531 Journal of Environmental Protection
(a)
[image:7.595.228.520.70.394.2](b)
Figure 2. Comparison of simulated and measured flow velocity and direction during
measuring period (samples).
it shows that the tidal current model still needs further refinement and im-provement.
Figure 3 shows the dialog box of CWCM input with the related information
DOI: 10.4236/jep.2018.95033 532 Journal of Environmental Protection
Figure 3. Dialog box of CWCM inputting the related information of “Tasman Sea” oil
spill incident.
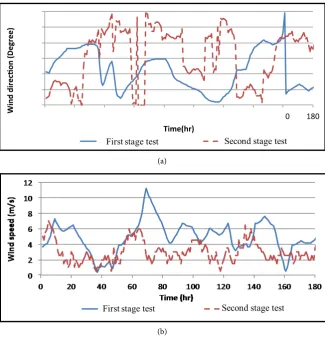
(a)
(b)
Figure 4. Wind direction (a) and speed (b) adopted in validation test of “Tasman Sea” oil
spill accident case.
diagram in Figure 6. However, the simulation results coupled with tidal current model of the flow measurement period and the input of the first stage wind field data is also reliable, as shown in the chart built in Figure 6.
Insert, add and obtain incident scenario (spill, condition, par
Natural disaster Accident report
Ship accident Fire & explosion accidentOther disaster Oil spill & HNS accident Source Position Time Lon Lat angle radian Type Amount(ton)
continuity Instantaneous
Date Time Release hours Parameters Sea condition Wind data Calmness Smaller wave Medium wave Large wave Big wave Storm surge Particle numbers Spill time(hours) Calc. time steps Output time steps
3D simulate HNS calc.
Temperature Water Air OK Cancel Set Open Save 1 hour 2 hours 4 hours 6 hours 12 hours 24 hours Read Delete Delete all Wind direction/speed Crude oil - - -- -
-First stage test Second stage test
[image:8.595.210.536.292.630.2]DOI: 10.4236/jep.2018.95033 533 Journal of Environmental Protection
[image:9.595.214.538.65.192.2](a) (b)
Figure 5. (a) Comparison between record and simulated oil traces before coding
correc-tion of CWCM program; (b) Simulated oil trace after the correccorrec-tion.
Figure 6. Main plot: simulation result using second stage wind data; Chart built:
simula-tion result using tidal current model in current measurement period.
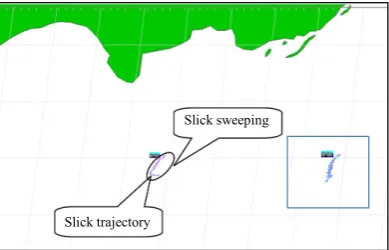
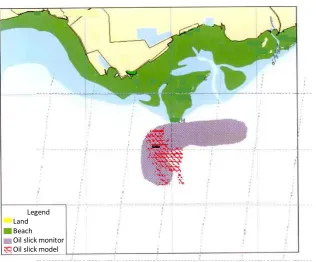
106 hours simulation was carried out using the first, second stage wind data separately, and the result compared overlayed with the interpretation results of related satellite images [16] shows that most of the location and range of the oil spill trajectory simulated using the first stage wind data can be located in the oil contaminated zone interpreted by the satellite, but the oil slick range is smaller than that of the satellite interpretation (Figure 7). However, the simulation re-sults using the second stage wind data cannot match the satellite image interptation results. It is shown that although the wind field diagnostic model can re-produce the wind condition better in the first 12 hours, the long term diagnos-tic simulation needs to update the initial data dynamically to improve the ac-curacy.
3.2. Calibration Analysis of Reduced Scale Oil Spill Weathering
Simulation Test
Reduced scale simulation experiments of oil spill weathering of four oil types in winter and summer were carried out in Shenzhen using self-made marine oil spill weathering simulator [17] [18] [19] [20]. Test oil types are respectively: di-esel oil and heavy oil in winter (temperature 11˚C - 23˚C), Oman and Wen-Chang crude oils in summer (temperature 27˚C - 34˚C). The size of simu-lation test device is 5.0 m long × 3.0 m wide × 1.0 m water deep. There are two permeable pushing water plates with a distance of about 1.4 m placed in the tank
Trace record 11-12.5 hours
later
Trace simulated 11-12.5 hours
later
Slick sweeping
[image:9.595.278.473.237.362.2]DOI: 10.4236/jep.2018.95033 534 Journal of Environmental Protection
Figure 7. The 106th hour simulation result using first stage wind data overlaid with
satel-lite interpretation map.
moving back and forth according to the cycle of 1 min. The speed of motion is about 0.3 m/s, and the weathering test time is 1 month per period.
3.2.1. Weathering Model of Oil Spill Source Term
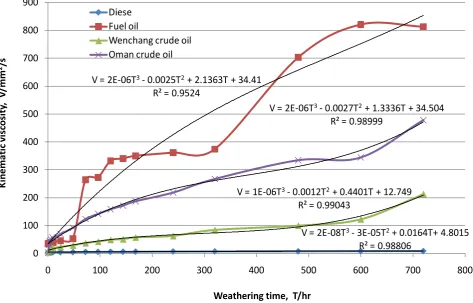
Weathering test results (see Table 2 and Figure 8 and Figure 9) show that the different oil types and different environmental temperature and light conditions will affect the weathering speed. Weathering is faster in summer than that in winter, and significantly faster when oil viscosity is lower (kinematic viscosity of diesel at 20˚C 4.584 mm2/s; Oman crude oil at 50˚C 3.38 mm2/s) than when oil viscosity is higher (kinematic viscosity of Wen-Chang crude oil at 50˚C 4.955 mm2/s; fuel oil at 100˚C 35.57 mm2/s). The viscosity if oil types with more com-plicated components (crude oil, fuel oil), increases rapidly associated with the weathering process (Figure 8). Water apparently encapsulated in the fuel oil as its moisture content reached 70% at 100 hours of weathering (Figure 9).
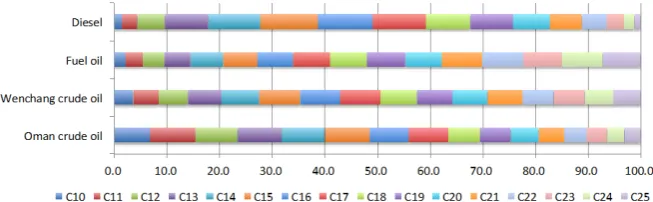
It can be seen from Table 2, that C10 - C14 in four kinds of oils are all wea-thered completely at 10 to 20 days in summer and more than 30 days in winter; weathering of C15 - C20 in winter is not obviously, weathering of C15 - C17 in summer is partially, weathering of C18 - C20 in summer is not obviously, and C21 - C24 of all oils are basically non weathering in winter and summer. The ra-tio of GCMS peak area of C10 to C24 components before weathering and wea-thering for 1 month are shown in Figure 10 and Figure 11, from which it can be analyzed that the proportion of hydrocarbon weathering components are about 41.1% in Oman crude oil, 32.9% in Wen-Chang crude oil, 26.9% in diesel oil and 10.4% in fuel oil.
DOI: 10.4236/jep.2018.95033 535 Journal of Environmental Protection
Figure 8. Dynamic changes and statistical regression curves of viscosity.
Figure 9. Water content in four types oil spill weathering tests.
V = 2E-08T3- 3E-05T2+ 0.0164T+ 4.8015
R² = 0.98806 V = 2E-06T3- 0.0025T2+ 2.1363T + 34.41
R² = 0.9524
V = 1E-06T3- 0.0012T2+ 0.4401T + 12.749
R² = 0.99043
V = 2E-06T3- 0.0027T2+ 1.3336T + 34.504
R² = 0.98999
0 100 200 300 400 500 600 700 800 900
0 100 200 300 400 500 600 700 800
Kin em at ic v is co sit y, V /m m 2/s
Weathering time, T/hr
Diese Fuel oil
Wenchang crude oil Oman crude oil
W = 5E-10T3- 7E-07T2+ 0.0003T + 0.0079
R² = 0.86012 W = 2E-06T3- 0.002T2+ 0.7061T+ 2.6533
R² = 0.91837
W = -2E-09T3- 1E-05T2+ 0.0182T - 0.1901
R² = 0.93581
W = -2E-08T3+ 2E-05T2- 0.001T + 0.1643
R² = 0.98336
-10 0 10 20 30 40 50 60 70 80 90
0 100 200 300 400 500 600 700 800
W ater co nten t, W /%
Weathering time, T/hr
Diese Fuel oil
[image:11.595.65.537.373.702.2]DOI: 10.4236/jep.2018.95033 536 Journal of Environmental Protection
Figure 10. The ratio of GCMS peak area of C10 to C24 components before weathering.
Figure 11. The ratio of GCMS peak area of C10 to C24 components weathering for 1
[image:12.595.209.539.371.507.2]month.
Table 2. Table type styles (Table caption is indispensable).
Oil type C10 - C11 C12 C13 - C14 C15 - C17 C18 - C20 C21 - C24 Diesel 120 h Weathering finished
Obvious
weathering is not obvious Weathering
Basically non weathering Fuel oil 240 h Weathering finished
Oman
crude oil 96h Weathering finished
240 h Weathering
finished Partial weathering
Weathering is not obvious Wenchang
crude oil 480 h Weathering finished
3.2.2. Influence Model of Oil Spill Weathering on Water Quality
The results of water quality comparison of similar diesel oil in oil spill weather-ing tests were compared. Because the oil spill slick of “Tasman Sea” accident was thinner similar to that of diesel oil in weathering test, actual monitored water quality [16] was compared with the simulated test [19] to calibrating the simula-tion model based on reduced scale oil spill weathering test. When DO, COD, and oil concentration adjustment factors were taken (205, 8, 1) and reduced scale simulation ratios(1:2, 1:48, 1:368) concentration of water quality calculated by model were similar with the actual monitored ones in the same oil spill wea-thering time period.
simula-DOI: 10.4236/jep.2018.95033 537 Journal of Environmental Protection tion ratios (1:16 - 1:145, 1:26 - 1:232, 1:13 - 1:116, 1:3 - 1:29) used the calculated water quality index at the same spill time is 0.9 - 4.6, and ratios oil content ex-ceeding the standard are 2.4 - 17.2, which are in good agreement with the real monitoring results of the spill.
4. Conclusions and Recommendations
1) As important means of damage monitoring analysis and judgment, applica-tion of oil spill model in judicial identificaapplica-tion of environment damage and damage fund claims business has been recognized in China. Therefore, it is ne-cessary to extend damage evaluation function of oil spill model, and to test, to calibrate and to verify the evaluation accuracy of the model to enhance its appli-cability.
2) The simulation accuracy of oil spill model depends on the scientific merit of the model theory and parameter selection, the correctness of software coding, and the authenticity of oil spill source item and of meteorological and hydrolog-ical data. CWCM oil spill model developed by the author is verified and com-pared by using environmental monitoring information and the oil spill accident case data. Its short-term oil drift and diffusion simulation results are consistent with the real spill data. However, in order to further improve the evaluation function and accuracy of oil spill model, the oil spill weathering model and water quality impact assessment model still need to be improved according to the late oil spill weathering reduced scale simulation test and calibration results. Addi-tionally there is a need to enhance the accuracy of 3-D current model coupled by supplying dynamic updates of diagnostic wind field and other functions.
3) It is recommended that competent departments are established to improve record supervision of the damage assessment model of appraisal institutions, in-cluding, the requirement of R & D and applying units of oil spill models to pro-vide complete and detailed explanation on the ecological environmental damage simulation function and scientific principle at the time of filing, and to submit audit documents issued by authorized inspection and testing organizations, to standardize supporting operational application programs and processes, etc.
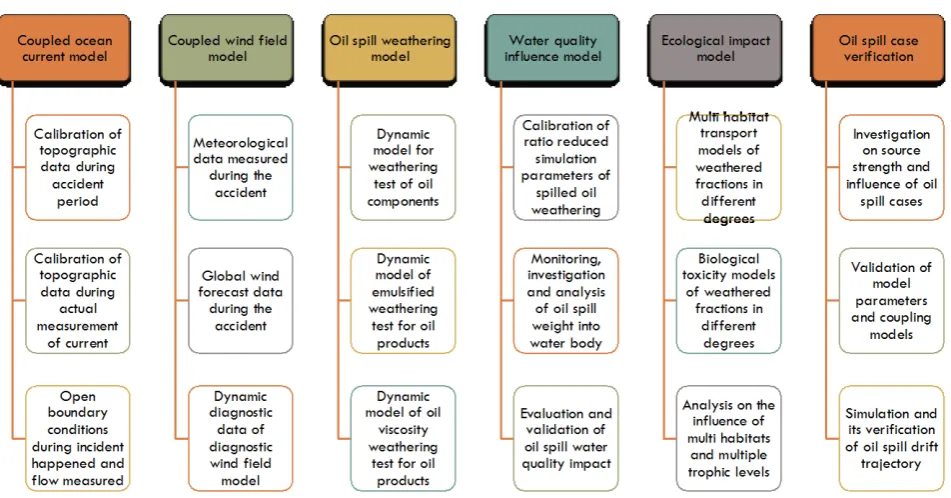
To further improve the operational evaluation function and evaluation effi-ciency of oil spill model, it is recommended to improve the coupled current model, wind field model, oil spill weathering model, water quality impact model, ecological impact model, and to carry out the oil spill case verification. The up-dating scheme of oil spill model for operational application is shown in Figure 12.
Acknowledgements
DOI: 10.4236/jep.2018.95033 538 Journal of Environmental Protection
Figure 12. Update scheme of oil spill model for operational application.
Funded
Being funded by the National Key R & D Program of China (2016YFC0503600).
References
[1] Qiao, B. (2001) Oil Spill Model Development and Application for Emergency Re-sponse System. Journal of Environmental Science, 13, 252-256.
[2] Qiao, B., Zhao, Q., Zhao, P. and Yang, X.C. (2001) Development of Intelligent In-formation System for Oil Spill Emergency Response in Shenzhen (OSERIIS 2000).
Proceedings of the 2001 Annual Academic Conference of China Institute of Naviga-tion, December 2001, Tokyo.
[3] Qiao, B. and Tang, X.Y. (2002) Assessment of Oil Spill Impact on Marine Ecosys-tem and Risk Prevention. Proceedings of the Symposium on Offshore Oil Spill Emergency Planning and Container Transport across the Taiwan Straits, Apirl 2002, Taibei, 3-1-3-8.
[4] Liu, Y.C., Yin, P.H., Lin, J.G. and Zhang, J. (2002) Prediction of Oil Spill Spreading and Transport over the Sea Based on GIS. Journal of Dalian Maritime University, 28, 41-44.
[5] Lou, X. and Liu, S.G. (2008) Review of Oil Spill Model Theory and Research. Envi-ronmental Science and Management, 33, 33-37.
[6] Fan, X.H., Zhang, F., Deng, J., Huang, L.W. and Wang, X. (2012) Research and Ap-plication of Oil Spill Fast Forecast Model on Three Gorges Reservoir Area in Back-water Area. Journal of Wuhan University of Technology (Transportation Science & Engineering), 36, 967-970.
[7] Liu, S.J. and Zou, L. (1994) Guidelines for Oil Pollution Damage of the Internation-al Maritime Committee. Annual of China Maritime Law, No. 5, 463-468.
DOI: 10.4236/jep.2018.95033 539 Journal of Environmental Protection
the Guidelines for Compensation for Oil Pollution Damage Claims by Oil Vessels (Trial Version). Marine Hazard Prevention Issued [2016] No. 376.
[9] Ministry of Justice and the Ministry of Environmental Protection (2015) Notice on Standardizing the Management of Judicial Authentication of Environmental Dam-age. Announcement by the Department [2015] No.118.
[10] Qiao, B. (1998) Monte Carlo Three Dimensional Dissolution Model of Marine Spills—CWCM. Proceedings of the 3rd Youth Academic Annual Meeting of China Association for Science and Technology the Fourth Volume: Resources, Environ-ment, Science and Sustainable Development, Science Press, Beijing, 199-201. [11] Walters, R.A. (1987) A Model for Tides and Currents in the English Channel and
Southern North Sea. Advances in Water Resources, 10, 138-148.
https://doi.org/10.1016/0309-1708(87)90020-0
[12] Shi, M.C. (2007) Physical Oceanography. Shandong Education Press, Jinan. [13] Koji, M. (2004) NAO.99b Tidal Prediction System.
http://www.miz.nao.ac.jp/staffs/nao99/index_En.html
[14] Schureman, P. (1958) Manual of Harmonic Analysis and Prediction of Tides. Spe-cial Publication 98, US Coast and Geodetic Survey, Department of Commerce. [15] Qiao, B., Song, Y., Cai, X.H., Chen, X.P. and Li, C.C. (2009) Validation of CWCM
Oil Spill Model in Mainland China and Its Prediction Technology. Cross Strait Symposium on Emergency Response to Marine Oil Pollution, Jinmen, 25-27 No-vember 2009, 11.
[16] Gao, Z.H., Yang, J.Q. and Wang, P.G. (2005) Theory, Method and Case Study of Marine Oil Spill Ecological Damage Assessment. Ocean Press.
[17] Wu, H.T., Qiao, B., Xie, Y.L., Li, S.Y., Zhou, Y.S., Lin, P., Xiao, F. and Zhao, Y. (2009) The Development of One Kind of Weathering Simulator of Spilled Oil on the Sea. In: Qiao, B., Ed., Marine Pollution Prevention and Emergency Response Technology, China Environmental Science Press, Beijing, 168-171.
[18] Qiao, B., Zhao, Y., Li, S.Y., Xiao, F., Wu, H.T., Liu, X.F. and Zhou, Y.S. (2014) Ex-perimental Study on the Change of Oil Spill Appearance and Carbon Stable Isotope Ratio Changing with Weathering. Marine Environmental Science, 33, 598-602. [19] Qiao, B., Wu, H.T., Xiao, F., Zhao, Y., Lan, R., Zhou, Y.S. and Li, C.C. (2015)
Com-parative Study on Water Quality Impacts between Marine Oil Spill Weathering Ex-periment and Real Oil Spill. Excellent Papers on Chinese Navigation Technology Symposium, Pujiang Education Press, Shanghai, 602-617.
[20] Qiao, B. (2014) Analysis of Potential Influence of Diesel Oil Leakage Accident on Soil and Groundwater. International Symposium on Remediation and Management of Soil and Groundwater Pollution, Beijing, November 2014.