The Sperm Quality Analyzer IIc is a small, com-pact device that combines optical detection and computer analysis of the data acquired. The device was developed for evaluating the semen of men, but several studies have already been published dem-onstrating its usability for evaluating semen quality in certain animals, including, among others, dogs (Iguer-Ouada and Verstegen; 2001; Neuman et al., 2002; Rijsselaere et al., 2002; Fukui et al., 2004; Vyt et al., 2004).
According to the basic data, the principle for establishing indicators is based on the turbulence effect of semen. This phenomenon has been studied in some domestic animals, particularly ruminants, and brings together the evaluation of the density and the movement of sperm. While examining a semen sample using electro-optical methods for microscopy, this phenomenon appears as moving waves prompting a change in optical density. This turbulence occurs only in very dense ejaculates and
is caused by the collective movement of individual sperm. The wave frequency depends on the con-centration of motile sperm and on the intensity of their movement; the sperm motility index (SMI) was established to characterise them. In order that this phenomenon might also be used in the evalu-ation of human semen, equipment was developed that was capable of measuring the SMI in human semen, which has a low density and does not mani-fest the characteristic signs of collective movement (Bartoov et al., 1991). The SMI is defined as the frequency of changes in optical density caused by sperm movement in the optical field under exami-nation. The SMI cannot be established if it is a matter of dead or immotile sperm, which do not cause changes in optical density (Bartoov et al., 1991; Iguer-Ouada and Verstegen, 2001). A number of studies have been devoted to the relationship of the SMI to motility parameters. The numerical value of the SMI is affected by both the number of
Using the Sperm Quality Analyzer (SQA IIc) to evaluate
dog ejaculates
P. PRINOSILOVA, Z. VEZNIK, A. ZAJICOVA, D. SVECOVA
Veterinary Research Institute, Brno, Czech Republic
ABSTRACT: 38 fresh ejaculates were examined, of which 23 were cryopreserved in three diluents differing in concentration of glycerol and examined after thawing. For each ejaculate we established the concentration, motility, speed of sperm, percentage of live sperm and the morphological image of the ejaculate using routine laboratory diagnosis and SQA parameters at the initial value and after a 120-minute survival test. The values of the param-eters found through routine diagnosis and using the SQA device were statistically confronted. From the results it emerges that the device functions on the basis of the turbulence effect of the semen, and therefore on the intensity and character of the moving mass of sperm. From a research perspective, the SQA device is less usable, since the values it provides are not absolutely comparable with the values found through routine laboratory diagnosis. For the practitioner, however, the device may be useful, since the value of the sperm motility index (SMI) indicates the quality of the semen through the close connection of two parameters, concentration and motility. For a more precise assessment of the ejaculate, however, it is necessary to also analyse the remaining parameters of routine laboratory sperm analysis. To be useful in clinical practice for the evaluation of semen, it would be necessary to establish SMI limit values for ejaculates of varying quality.
Keywords: dog; ejaculate; sperm analysis; Sperm Quality Analyzer (SQA)
motile sperm and the quality of their movement, as indicated by Schieferstein et al. (1998) and Bartoov et al. (1991). The SMI value falls during functional tests together with motility, when the same con-centration of sperm in the sample is maintained (Bartoov et al., 1991; Iguer-Ouada and Verstegen, 2001). Although immotile sperm do not provide an SMI value, a statistically significant correlation has been found between the SMI and the overall concentration and percentage of motility in human semen (Bartoov et al., 1991).
Another parameter for evaluating semen while using the SQA device is FSC (functional sperm concentration), the value of which brings together active sperm and evaluates their quantity. Both the SMI and FSC parameters significantly correlated with the CASA parameters and the SQA device tested by the cited authors was judged to be use-ful in the management of male infertility (Suzuki et al., 2002). A positive correlation was found by comparing the values of the percentage of mor-phologically normal sperm obtained by the SQA IIc device with the evaluation of the morphology according to strict criteria. Shibahara et al. (2002) stated that the SQA IIc may be used as an initial screening method for evaluating the morphology of male sperm, but for a strategy for treating infer-tility they nevertheless recommended evaluation by microscopy using strict criteria (Kruger et al., 1986). Johnston et al. (1995) also presents a high correlation of the SMI with the morphological im-age of human semen obtained using microscopy. Iguer-Ouada and Verstegen (2001)discovered a statistically significant correlation between the SMI and the concentration of dog sperm in values of sperm concentration up to 200 × 106
sperma-tozoa/ml. At semen concentrations higher than 200 × 106 spermatozoa/ml, the correlations were
not statistically significant. A similar conclusion was also reached by Rijsselaere et al. (2002), who in their study demonstrated the dependence of the SMI values on sperm motility and the concentra-tion of fresh ejaculates up to a value of 150 × 106
spermatozoa/ml.
Apart from indices, the device provides pa-rameters given by the WHO for the qualitative evaluation of semen, that is to say values for con-centration, motility and the percentage of normal sperm. According to Comodo et al. (1997), the SMI values are converted into sperm concentration, to-tal motility and morphologically normal sperm us-ing specific algorithms.
The aim of this study was to establish the whether the SQA device would be useful for assessing dog semen quality, given the biological differences be-tween ejaculates from dogs and humans. The values obtained by the SQA device and the values obtained using routine methods for sperm assessment were compares in an attempt to determine the usability of each individual parameter and the device itself for assessment of the quality of ejaculates from dogs in clinical practice.
MATERIAL AND METHODS
Semen obtained from dogs was assessed on the one hand using the SQA device and on the other us-ing routinely applied laboratory methods for sperm analysis (Veznik et al., 2005).
Animals and method of collection
Twenty dogs of different breeds, ranging in age from 1 to 11 years old (mean age 4.5 years) were included in the study. The breeds were: an Afghan Hound, Bassett Hound, Beagle, Bull Terrier, Czech Short-haired Terrier, Doberman, Yorkshire Terrier, Cocker Spaniel, German Shepherd dog, Labrador Retriever, Leonberger, Rottweiler, Shetland Sheepdog and Irish Wolfhound. In all, 38 ejaculates were evaluated, and 23 of those were cryopreserved in three diluents differing in con-centration of glycerol. The semen was collected by manual manipulation into plastic test-tubes with a funnel. Clenching the collector in the palm was sufficient to minimize thermal shock. Mainly the second sperm rich fraction of each ejaculate, was collected. In all, 226 prepared samples of ejaculate were evaluated.
Method of work with the SQA
analysed in 10-second periods. This test is repeated 4 times over a 45-second evaluation period and the values are processed to produce the final result, which appears on the display.
The SQA IIc evaluates the following six parameters designed to estimate the fertility of the sample:
SMI – sperm motility index. Value generated by
computer on the basis of detected changes in a beam of light. This parameter is the basis for the other parameters. It is an item of numerical data internal to the device which determines the quality of the ejaculate.
FSC – functional sperm concentration. Defines
the concentration of live, functional sperm in mil-lions per ml (sperm which are motile and also mor-phological normal).
MSC – motile sperm concentration. Defines the
concentration of progressively motile sperm in mil-lions per ml.
Total Cell Concentration – one of the World
Health Organization (WHO) parameters, expressing the total number of cells, living or dead, per ml.
Percent Normal Motility – another WHO
pa-rameter, expressing the percentage of cells with normal motility.
Percent Normal Morphology – a third WHO
parameter, the percentage of cells with a normal morphology. A normal morphology is defined by “strict criteria” in the WHO manual (strict criteria – Kruger et al., 1986).
Overall qualitative assessment of ejaculates using routine sperm analysis and SQA
Plan of laboratory examination of semen. After
collection, the test-tube with semen was placed on a laboratory thermal desk heated to 35°C and the following parameters were examined: semen vol-ume, sperm concentration, motility and speed of sperm movement, identification of live and dead sperm and assessment of the morphology.
The concentration was examined hemocyto-metrically in a Bürker Chamber. The motility was established using a subjective method in a micro-scope 200–400× magnification. A drop of semen was placed on a microscope slide and covered with a coverslip, at 35°C. The speed of movement was established using the propulsivity method according to Baker et al. (1957). Eosin-nigrosin dye was used to identify live and dead sperm. The morphological assessment was carried out by examining a
prepara-tion dyed according to Karras (Gamcik et al., 1976) by microscope magnified 1 000× while using immer-sion, and evaluated using a multiparametric method, the SASMO programme (Veznik et al., 2001).
The survival test was carried out at laboratory temperature (22°C) in ejaculates diluted with physi-ological saline buffered with a phosphate buffer at pH 7.2. The ejaculate was diluted to a concentra-tion of 100 × 106 spermatozoa/ml. After 120 min
the ejaculate was heated to 35°C and then evalu-ated by establishing functional indicators and the morphological assessment.
Preparing the semen for long-term conserva-tion. The individual ejaculates were divided into 3 aliquots and centrifuged at 500 G for 10 min, the seminal plasma was separated and then frozen and stored at –18°C. Each aliquot was diluted with a Tris-fructose-citric acid-egg yolk extender (modi-fied according to Andersen, 1975) of three different glycerol concentrations (4%, 6%, 8%, respectively) to the final sperm concentration of around 500 × 106
spermatozoa/ml. The diluted semen was filled into labelled 0.5 ml straws, which were sealed with poly-vinylalcohol. The straws were equilibrated at 4ºC for 2 hours and then frozen in liquid nitrogen vapour in a metal straw-holder frozen to –100°C and were after 10 minutes plunged into the liquid nitrogen.
Thawing and incubation. The straws were
thawed in a water bath at 65ºC for 6 seconds and then emptied into a 35°C physiological saline buff-ered to pH 7.2 that contain 20% seminal plasma, to obtain a final concentration of 100 × 106
spermato-zoa/ml. In the sample thus obtained, the SQA pa-rameters and the papa-rameters according to routine laboratory examination by microscopy were again established as an initial value (0 min) and after a 120-minute survival test (120 min).
To compare the results obtained by evaluating the measurements using the SQA IIc and methods of routine sperm analysis, an investigation was con-ducted based on the statistical processing of the data obtained and the indices constructed.
The study of factors influencing SQA results
Table 1. Average values for sperm analysis of fresh semen (n = 38)
0 min 120 min
Average SD Max. Min. Average SD Max. Min. Motility (%) 77.4 13.19 95.0 35.0 52.5 17.31 90.0 10.0 Sp. speed (µm/s) 58.4 33.65 144.8 11.9 34.6 29.55 114.3 0 Live sperm (%) 83.7 12.15 97.0 39.0 80.4 12.64 93.1 38.0 Normospermia (%) 68.6 20.80 92.0 7.5 61.4 23.00 87.0 2.5 Concentration (mil./ml) 261.032 224.3951 1 225.600 17.066
c(M) (mil./ml) 200.887 189.6417 1 103.040 9.386 c(M + N) (mil./ml) 144.058 151.0130 843.826 1.558
0 min = initial value; 120 min = value after 120-minute survival test; SD = standard deviation; Max. = maximum value; Min. = min-imum value; c(M) = concentration of motile sperm; c(M+N) = concentration of motile and morphologically normal sperm
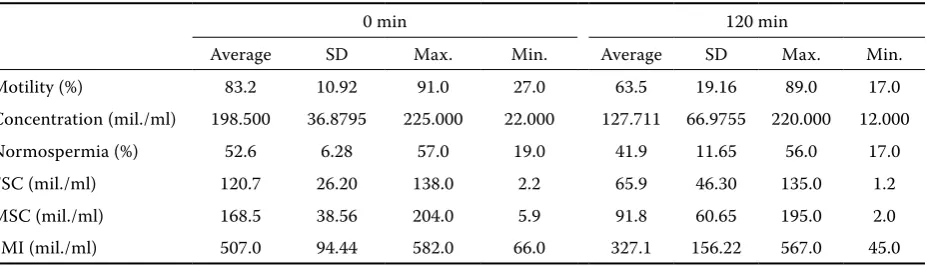
Table 2. Average values for SQA parameters, fresh semen (n = 38)
0 min 120 min
Average SD Max. Min. Average SD Max. Min. Motility (%) 83.2 10.92 91.0 27.0 63.5 19.16 89.0 17.0 Concentration (mil./ml) 198.500 36.8795 225.000 22.000 127.711 66.9755 220.000 12.000 Normospermia (%) 52.6 6.28 57.0 19.0 41.9 11.65 56.0 17.0 FSC (mil./ml) 120.7 26.20 138.0 2.2 65.9 46.30 135.0 1.2 MSC (mil./ml) 168.5 38.56 204.0 5.9 91.8 60.65 195.0 2.0 SMI (mil./ml) 507.0 94.44 582.0 66.0 327.1 156.22 567.0 45.0
0 min = initial value; 120 min = value after 120-minute survival test; SD = standard deviation; Max. = maximum value; Min. = minimum value; FSC = functional sperm concentration; MSC = motile sperm concentration; SMI = sperm motility index
from each dilution was established on the SQA and hemocytometrically in a Bürker chamber.
To analyse the effects of motility and concentra-tion of sperm, the fresh dog semen was diluted with buffered saline at ratios of 2 : 1, 1 : 1 and 1 : 2. The concentration for the resulting groups of ejaculates was established using a Bürker chamber and the Sperm Quality Analyser and the subjective motility using a microscope and the SQA.
The assertion of Comodo et al. (1997) that all the SQA parameters derived mathematically from the SMI values was tested by a statistical comparison of the individual SQA and SMI parameters.
Statistical analysis
The statistical analysis was carried out using the STATplus programme (Matouskova et al., 1992). The level of significance was set at P < 0.05.
RESULTS
Overall qualitative assessment of ejaculates using routine sperm analysis and SQA
The average initial values for individual param-eters of routine sperm analysis and values after the 120-minute survival test are shown at Table 1. The average initial values of SQA parameters and val-ues after the 120-minute survival test are shown in Table 2.
[image:4.595.68.532.588.721.2]Table 3. Average values of sperm analysis for frozen/thawed semen (cryopreserved in three diluents differing in
concentration of glycerol, n = 69)
0 min 120 min
Average SD Max. Min. Average SD Max. Min. Motility (%) 41.0 12.9 60.0 5.0 31.3 15.04 70.0 1.0 Sp. speed (µm/s) 59.6 33.55 195.3 0 45.3 28.11 102.3 0 Live sperm (%) 58.0 11.78 88.2 33.0 53.1 12.93 82.5 12.0 Normospermia (%) 40.0 13.91 77.0 16.5 24.9 10.17 59.5 5.0 Concentration (mil./ml) 92.305 30.430 168.0 44.8 92.305 30.430 168.0 44.8 c(M) (mil./ml) 38.496 20.818 141.100 6.400 28.447 15.893 67.200 2.592 c(M + N) (mil./ml) 14.686 8.186 37.600 1.750 7.142 5.508 26.343 0.492
0 min = initial value; 120 min = value after 120-minute survival test; SD = standard deviation; Max. = maximum value; Min. = minimum value; c(M) = concentration of motile sperm; c(M+N) = concentration of motile and morphologically normal sperm
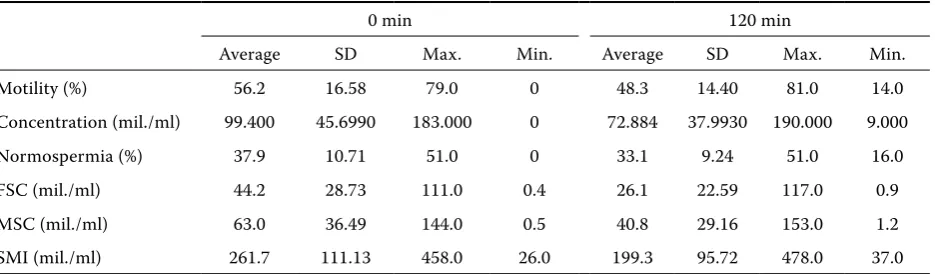
Table 4. Average values of SQA parameters, frozen/thawed semen (cryopreserved in three diluents differing in
concentration of glycerol, n = 69)
0 min 120 min
Average SD Max. Min. Average SD Max. Min. Motility (%) 56.2 16.58 79.0 0 48.3 14.40 81.0 14.0 Concentration (mil./ml) 99.400 45.6990 183.000 0 72.884 37.9930 190.000 9.000 Normospermia (%) 37.9 10.71 51.0 0 33.1 9.24 51.0 16.0 FSC (mil./ml) 44.2 28.73 111.0 0.4 26.1 22.59 117.0 0.9 MSC (mil./ml) 63.0 36.49 144.0 0.5 40.8 29.16 153.0 1.2 SMI (mil./ml) 261.7 111.13 458.0 26.0 199.3 95.72 478.0 37.0
0 min = initial value; 120 min = value after 120-minute survival test; SD = standard deviation; Max. = maximum value; Min. = minimum value; FSC = functional sperm concentration; MSC = motile sperm concentration; SMI = sperm motility index
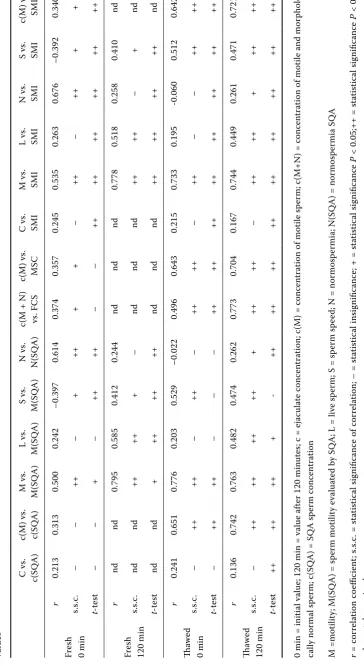
sperm did not show any correlation with the SQA concentration. A significant correlation was, how-ever, found with the MSC (P < 0.05). There was a correlation of the concentration of motile and mor-phologically normal sperm with the value of the FSC index (P < 0.05). The values for normospermia established by microscopy showed a correlation (P < 0.01) with the SQA values for normospermia, given the highly significant difference in the aver-ages (P < 0.01); after 120 min no correlation was found. The same dependence was obtained when comparing the values for normospermia and the SMI at both the initial value and after 120 min.
Averages of 23 thawed ejaculates in three differ-ent concdiffer-entrations of glycerol are shown in Tables 3
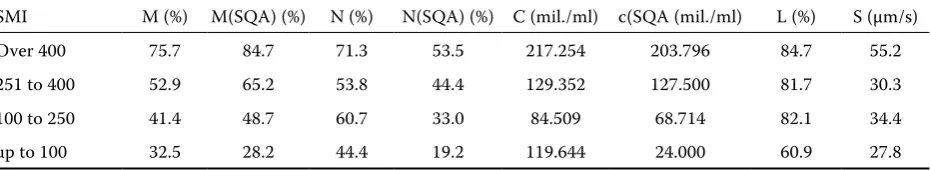
[image:5.595.66.534.582.719.2]Table 6. Comparison of parameter values for routine sperm analysis and SQA parameters with SMI values for fresh
semen (n = 76 examination summarized from the initial values and values after the 120 min survival test)
SMI M (%) M(SQA) (%) N (%) N(SQA) (%) C (mil./ml) c(SQA (mil./ml) L (%) S (µm/s) Over 400 75.7 84.7 71.3 53.5 217.254 203.796 84.7 55.2 251 to 400 52.9 65.2 53.8 44.4 129.352 127.500 81.7 30.3 100 to 250 41.4 48.7 60.7 33.0 84.509 68.714 82.1 34.4 up to 100 32.5 28.2 44.4 19.2 119.644 24.000 60.9 27.8
M = motility; M(SQA) = SQA motility; N = normospermia; N(SQA) = SQA normospermia; C = sperm concentration; c(SQA) = SQA sperm concentration; L = live sperm; S = sperm speed
highly significant (P < 0.01). There was a high corre-lation (P < 0.01) for the SMI values with the motility values both at initial values and after 120 min.
The concentration of motile sperm showed a high correlation with the SQA concentration at the initial value and after 120 min (P < 0.01). The correlation between the concentration of motile sperm and the MSC was also highly significant (P <
0.01). The concentration of motile and morpho-logically normal sperm showed a highly significant correlation with the FSC index both at the initial value and after 120 min of survival test (P < 0.01). In both cases, the difference in the averages was highly significant (P < 0.01).
The values for normospermia established by micro-scopy at the initial value showed no significant cor-relation with the values for normospermia established using the SQA device, nor with the SMI values. In contrast, 120 min after thawing the values for nor-mospermia did correlate with both the SQA values for normospermia and the SMI values (P < 0.05).
The comparison of the parameter values of rou-tine sperm analysis and the SQA parameters for fresh semen arranged into 4 categories according to SMI values are shown in Table 6. Assessment is summarized from the initial values and values after the 120-minute survival test.
The study of selected factors influencing the SQA results
The study was focused on the effect of sperm motility on the SQA indicator. Figure 1 depicts the declining concentration of the killed semen, while the concentration evaluated using the SQA did not produce any values. In Figure 2 the descending se-ries of concentrations of fresh semen, diluted with physiological saline, in comparison with the con-centration found using the SQA is shown, and at the same time the motility established by microscopy and with the SQA and the SMI values.
The statistical evaluation of the dependences of individual SQA parameters on the SMI showed a high significance in all measurements (average r = 0.98, P < 0.01).
DISCUSSION
[image:7.595.66.532.116.201.2]The concentrations obtained through routine lab-oratory diagnosis and the SQA were not statistically different. After the 120-minute survival test, the fall in values of the SQA concentration was evident, while the sperm concentration in the experimen-tal samples of sperm remained unchanged. From
Figure 1. Sperm concentration and concentra-tion established by SQA in killed semen ����������������
���� ���
��� ��� ��� ��� ��� �� �
��
���
��
��
�� �� �� �� �
the results it was evident that the change in SQA concentration was influenced by a fall in sperm motility in the ejaculate. The fall in the sperm mo-tility established was highly correlated with a fall in the SQA motility, and moreover both at the initial value and after the 120-minute survival test. The experiment with the concentration series of killed sperm proved convincingly the dependence of SQA measuring on sperm motility. Immotile sperm do not provide impulses permitting the establishment of an SMI value and, therefore, the prerequisites for the other SQA parameters, which were likewise zero. This finding concords with the contention of Bartoov et al. (1991) and also with the results of Iguer-Ouada and Verstegen (2001), who also assert the essential role of motility on the SMI.
The values for normospermia evaluated by the SQA attained a maximum of 57% in high quality ejaculates. In the experiment, the maximum value for normospermia obtained was 92% and the aver-age value was 68.6%. The averaver-age value of normos-permia is somewhat higher in comparison with the normospermia values (57.5%) presented by Veznik et al. (2003) in research into the qualitative evalu-ation of the ejaculates of a group of
experimen-tal dogs, and comes closer to the lower limit for the conventional value for normospermia of 70% (Veznik et al., 2000). The value for normospermia is closely derived from the SMI value, just like the other SQA parameters, which are merely a math-ematical algorithm of the SMI.
Since the device is limited by maximum values which for sperm concentration do not exceed 200 × 106 spermatozoa/ml, even highly concentrated
se-men will induce in the device only the maximum possible SMI value, which in our research was 582. The SMI value is dependent on the fact that the sample will at the same time have a high motil-ity. Iguer-Ouada and Verstegen (2001) showed that, at semen concentrations higher than 200 × 106 spermatozoa/ml, the correlation between the
concentration of dog sperm and the SMI is statis-tically insignificant, probably because the system is saturated.
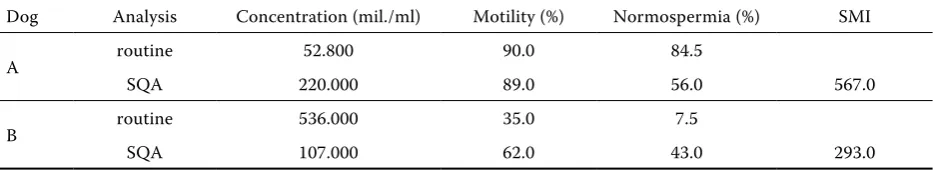
In the following case studies we demonstrated the significant influence on the SMI value of sperm motility and concentration. The results are pre-sented in Table 7.
(A) A two-year old Labrador, brought in for a sperm examination for experimental purposes, was �
�� ��� ��� ��� ��� ��� ��� ���
� �� �� �� �� �� �� �� �� �� ��� � ���
��� ��� ��� ��� ��� ��� �� �
��� �� �� �� �� �� �� �� �� �� �
��� ��� ��� ��� ��� ��� ��� ���
��
���
��
��
���� ��� �������������
������������� �����������������
����������������� ���
��� ��������
�������� ������������ ��������������� ������������������� �����
���������� ��������������
[image:8.595.73.528.83.263.2]�� �� �� �
Figure 2. Artificial descending series of concentrations and motility values for fresh semen in comparison with SQA parameters
Table 7. The two case studies
Dog Analysis Concentration (mil./ml) Motility (%) Normospermia (%) SMI
A routine 52.800 90.0 84.5
SQA 220.000 89.0 56.0 567.0
B routine 536.000 35.0 7.5
[image:8.595.64.531.671.756.2]found to produce semen of low concentration with good motility. A high SMI value was obtained as a result of a high percentage of motile spermatozoa even if sperm concentration/ml was lower.
(B) An ejaculate with a high concentration of sperm and at the same time a lower motility was taken from a four-year-old Czech short-haired ter-rier. The examination was carried out with the aim of discovering why bitches covered had not become pregnant. It follows from the present results that the SMI value was affected not only by a low motility of spermatozoa, but also by their high concentra-tion. According to the SMI result, semen of this kind would be categorized as relatively good ejaculate.
The case studies demonstrate the fact that values of the SQA parameters are affected by both the motility of sperm and their concentration.
CONCLUSION
The SQA IIc device functions on the basis of the effect of semen turbulence, that is to say on the in-tensity and character of the moving mass of sperm. From a research perspective, the SQA device is less usable, since the values it gives are not absolutely comparable with the values obtained by routine laboratory diagnosis. For the practitioner, howev-er, the device may be useful, since the SMI value shows the quality of semen by closely connecting two parameters, concentration and motility. For the precise examination of an ejaculate, it is, how-ever, necessary to establish the other parameters of sperm analysis. This is in accordance with the contention of Rijsselaere et al. (2002), who consider the SQA IIc less usable in the sperm analysis of diluted, fresh semen, but on the contrary assert the possible suitability of the device for the objective examination of post-thaw motility.
For use in clinical practice for the purpose of evaluating semen, it would be necessary to estab-lish the limit SMI values for groups of ejaculates of varying quality.
REFERENCES
Andersen K. (1975): Insemination with frozen dog semen based on a new insemination technique. Zuchthygiene, 10, 1.
Baker F., Gragle R.G., Salisbury G.W., Van Demark N.L.
(1957): Spermatozoa velocities in vitro. A simple
method of measurement. Fertility and Sterility, 8, 149–155.
Bartoov B., Ben-Barak J., Mayesky A., Sneider M., Yogev L., Lightman A. (1991): Sperm motility index: a new parameter for human sperm evaluation. Fertility and Sterility, 56, 108–112.
Comodo F., Inaudi P.,Petrilli S., D´Antona N. (1997): Sperm quality analyzer (SQA): A reliable tool for semen parameters evaluation. In: Proc. 10th World Congress for In Vitro Fertilization and Assisted Reproduction, Vancouver, Canada.
Fukui Y., Togawa M., Abe N., Takano Y., Asada M., Okada A., Iida K., Ishikawa H., Ohsumi S. (2004): Validation of the sperm quality analyzer and the hypo-osmotic swelling test for frozen-thawed ram and minke whale (Balaenoptera bonarensis) spermatozoa. Journal of Reproduction and Development, 50, 147–154. Gamcik P., Kozumplik J., Schwarc F., Vlcek Z., Zibrin M.
(1976): Artificial Insemination and Andrology in Live-stock (in Czech). Príroda, Bratislava. 574 pp.
Iguer-Ouada M., Verstegen JP. (2001): Validation of the sperm quality analyzer (SQA) for dog sperm analysis. Theriogenology, 55, 1143–1158.
Johnston R.C., Clarke G.N., Liu D.Y., Baker H.W. (1995): Assessment of the sperm quality Analyzer. Fertility and Sterility, 63, 1071–1076.
Kruger T.F., Menkveld R., Stander F.S.H., Lombard C.J., Van der Merve J.P., Van Zyl J.A., Smith K. (1986): Sperm
morphologic features as a prognostic factor in vitro
fertilization. Fertility and Sterility, 46, 1118–1123. Matouskova O., Cigler M., Chalupa J., Hruska K. (1992):
STAT Plus – Manual (in Czech). 1st ed. Veterinary Research Institute, Brno. 168 pp.
Neuman S.L., Mcdaniel C.D., Frank L., Radu J., Hester N. P.Y. (2002): Use of a sperm quality analyser on semen of turkey breeders to monitor storage time effects and age-related changes during a reproductive cycle. Brit-ish Poultry Science, 43, 465–471.
Rijsselaere T., Van Soom A., Maes D., DeKruif A. (2002): Use of the Sperm Quality analyzer (SQA II-C) for the Assessment of Dog Sperm Quality. Reproduction in Domestic Animals, 37, 158–163.
Shibahara H., Suzuki T., Obara H., Hirano Y., Onagawa T., Taneichi A., Takamizawa S., Sato I. (2002): Accu-racy of the normal sperm morphology value by Sperm Quality analyzer IIC: comparison with the strict cri-teria. International Journal of Andrology, 25, 45. Schieferstein G., Hook-Vervier B., Schwarz M. (1998):
Sperm motility index. Archives of Andrology, 40,
43–48.
Compari-son of the Sperm Quality Analyzer IIC variables with the computer-aided sperm analysis estimates. Inter-national Journal of Andrology, 25, 49.
Veznik Z., Matouskova O., Svecova, Zajicova A. (2001): The use of the computer technology for the evaluation of the strict morphological sperm analysis. Veterinarni Medicina, 46, 35–40.
Veznik Z., Svecova D., Zajicova A., Bendova J., Faldikova L., Zraly Z., Netolicka S., Pospisil L., Diblikova I., Zu-dova D., Matouskova O. (2000): Evaluation of semen for assisted reproduction and selection of breeding males – Strict analysis of sperm morphology SASMO (in Czech). Veterinary Research Institute, Brno. 105 pp. Veznik Z., Svecova D., Zajicova A., Prinosilova P. (2003):
Functional evaluation of dog ejaculates with a priority
aspect of acrosome integrity. Veterinarni Medicina, 48, 221–228.
Veznik Z., Svecova D., Zajicova A., Prinosilova P. (2005): Repetitorium of spermatology and andrology and methods of sperm analysis (in Czech). Veterinary Re-search Institute, Brno. 197 pp.
Vyt P., Maes D., Rijsselaere T., Dejonckheere E., Castryck F., Van Soom A. (2004): Motility assessment of porcine spermatozoa: a comparison of methods. Reproduction in Domestic Animals, 39, 447–453.
Received: 05–01–21 Accepted after corrections: 05–05–04
Corresponding Author