Approximation of Statistical Analysis and
Estimation by Morphological Adaptation in a
Model of Slime Mould
Jeff Jones and Andrew Adamatzky
Centre for Unconventional Computing University of the West of England
Coldharbour Lane Bristol, BS16 1QY, UK.
[email protected], [email protected]
Abstract. True slime mould Physarum polycephalum approximates a range of complex computations via growth and adaptation of its proto-plasmic transport network, stimulating a large body of recent research into how such a simple organism can perform such complex feats. The properties of networks constructed by slime mould are known to be in-fluenced by the local distribution of stimuli within its environment. But can the morphological adaptation of slime mould yield any information about theglobalstatistical properties of its environment? We explore this possibility using a particle based model of slime mould. We demonstrate how morphological adaptation in blobs of virtual slime mould may be used as a simple computational mechanism that can coarsely approx-imate statistical analysis, estimation and tracking. Preliminary results include the approximation of the geometric centroid of 2D shapes, ap-proximation of arithmetic mean from spatially represented sorted and unsorted data distributions, and the estimation and dynamical tracking of moving object position in the presence of noise contaminated input stimuli. The results suggest that it is possible to utilise collectives of very simple components with limited individual computational ability (for ex-ample swarms of simple robotic devices) to extract statistical features from complex datasets by means of material adaptation and sensorial fusion.
Keywords:Morphological Computation,Physarum polycephalum, centroid, arithmetic mean, noisy estimation, sensorial fusion
1
Introduction - Morphological Computation
schooling [30], collective insect movement [5], and bacterial patterning [24]. In all these examples there is a population of entities in space, coupled by sensory information about their environment. The collective morphology of the group is generated from the local interactions and movement of individual members of the population. These interactions generate complex, self-organised and emer-gent behaviour. The resulting morphological patterns of the population show adaptation to the environment, for example avoidance of obstacles, detection of prey, and avoidance of predators.
The complex adaptation in seen biological systems suggests a literal form of morphological computation, driven by dynamic patterning in a changing envi-ronment. An ideal candidate for a morphological computation medium would be a material capable of the complex sensory integration, movement and adap-tation of a living organism, yet composed of relatively simple components that are amenable to understanding and control. The giant single-celled amoeboid organism Physarum polycephalum meets both criteria. During the plasmodium stage of its life cycle it adapts its body plan in response to a range of environ-mental stimuli (nutrient attractants, repellents, predators) during its growth, foraging and feeding. The plasmodium is composed of a transport network of protoplasmic tubes which spontaneously exhibit contractile activity which is used to distribute nutrients throughout its body plan.
Plasmodium of slime mould is amorphous in shape and ranges from the microscopic scale to up to many square metres in size. It is a giant syncytium formed by repeated nuclear division, comprised of a sponge-like actomyosin com-plex co-occurring in two physical phases. The gel phase is a dense matrix subject to spontaneous contraction and relaxation, under the influence of changing con-centrations of intracellular chemicals. The protoplasmic sol phase is transported through the plasmodium by the force generated by the oscillatory contractions within the gel matrix. Protoplasmic flux, and thus the behaviour of the organ-ism, is affected by local changes in temperature, space availability, chemoattrac-tant stimuli and illumination [6], [22], [25], [27]. ThePhysarum plasmodium can thus be regarded as a complex functional material capable of both sensory and motor behaviour. Indeed Physarum has been described as a membrane bound reaction-diffusion system in reference to both the complex interactions within the plasmodium and the rich computational potential afforded by its material properties [3]. The study of the computational potential of thePhysarum plas-modium was initiated by Nakagaki et al. [26] who found that the plasplas-modium could solve simple maze puzzles. This research has been extended and the plas-modium has demonstrated its performance in, for example, path planning and plane division problems [33], spanning trees and proximity graphs [2], [1], sim-ple memory effects [31], the imsim-plementation of individual logic gates [35] and
2
Basic Method and Overview of Paper
Although slime mould has desirable computational properties, it also has limita-tions due to the fact that it is a living organism. Although relatively simple and inexpensive to culture, slime mould is also slow (compared to classical computing substrates) and must be maintained within strict environmental conditions. It may also be relatively unpredictable in its behaviour. Although unpredictability is useful in wild conditions, it can be a hindrance when repeatable measures of its performance are required. We therefore require a synthetic model of slime mould.
We used the multi-agent approach introduced in [13]. Agents sense the con-centration of a hypothetical ‘chemical’ in a 2D lattice, orient themselves towards the locally strongest source and deposit the same chemical during forward move-ment. The agent population spontaneously forms emergent transport networks which undergo complex evolution, exhibiting minimisation and cohesion effects under a range of sensory parameter settings. The dynamical network patterns were found to reproduce a wide range of Turing-type reaction-diffusion pattern-ing [12]. External stimuli by nutrients and repellents are represented by pro-jecting positively weighted and negatively weighted values respectively into the lattice and the network evolution is constrained by the distribution of nutrients and repellents. Network evolution is affected by nutrient distribution, nutrient concentration and repellent placement. The networks formed by the model re-produced the connectivity of slime mould by approximating networks in the Toussaint hierarchy of proximity graphs [14], as originally demonstrated in [1]. Using a combination of attractant and repellent stimuli the method is also ca-pable of approximating the Convex Hull, Concave Hull and Voronoi diagram [19]. By using a feedback process to dynamically control the concentration of attractant stimuli the networks were able to approximate simple instances of the Travelling Salesman Problem (TSP) [15].
Much of the previous research using this model has concentrated on its net-work minimisation behaviours, however the bulk properties of larger collectives has also been studied. In [36] larger population sizes were found to reproduce the oscillatory patterns and transitions seen inPhysarum and these aggregates were found to exhibit controllable collective amoeboid movement [17] and dis-tributed conveyor transport [37]. These larger aggregates have also been found to be capable of material computation: In [20] a simple unguided method based on material shrinkage was shown to have good performance on instances of the TSP.
adaptation of the agent population. In Section 4 we examine the performance of the shrinkage method on spatial arrangements of 1D numerical datasets in extracting the arithmetic mean. The ability of the collective to cope with dynami-cally changing stimuli is assessed in Section 5 in which we attempt to use the blob to track the position of a simulated mobile target in the presence of noise-free and noise-contaminated stimuli, and using different stimulus types. The mechanisms of cohesion, shrinkage and shape adaptation by which the material computation is performed is described in Section 6, including some limitations and drawbacks of the approach. We conclude in Section 7 by examining the properties that en-able these bulk collectives to extract global information and suggest further po-tential applications in statistics and robotics. Due to the dynamical nature of the material adaptation the reader is encouraged to refer to the supplementary video recordings at http://uncomp.uwe.ac.uk/jeff/statistics_estimation.htm. A full description of the model and its parameters for these experiments is given in the appendix.
3
Sclerotinisation as an Inspiration for Centroid
Computation
The sclerotium stage is a part of the life cycle ofPhysarum, whose entry is pro-voked by adverse environmental conditions, particularly by a gradual reduction in humidity. In prolonged dry conditions the mass of plasmodium aggregates together, abandoning its protoplasmic tube network to form a compact, typ-ically circular or elliptical, toughened mass [21]. Sclerotinisation protects the organism from environmental damage and the slime mould can survive for many months — or even years — in this dormant stage, re-entering the plasmodium stage when moist conditions return. Biologically, the sclerotium stage may be interpreted as a primitive survival strategy and it has been interpreted compu-tationally as a biological equivalent of freezing or halting a computation [4] in spatially represented biological computing schemes.
of the sclerotium position. Possible reasons why regular sclerotium position was not formed include the variations in the current active zone of the plasmodium immediately before sclerotinisation, variations in protoplasmic transport, and the layout of the tube network and slime capsule before sclerotium formation (Physarum has recently been shown to be sensitive to its previous locations, as recorded by its slime capsule [29]). It is also not fully understood how environ-mental factors affect sclerotium formation. Do influences such as the drying agar substrate influence the plasmodium? For example, if outer regions of the agar dry more quickly and harden before inner regions, the differences in substrate hardness may influence plasmodium movement [34].
The above factors, coupled with the innate network formation behaviour of the organism, render it infeasible to uniformly shrink the organism under con-trollable conditions. The process of sclerotium formation must therefore be in-terpreted as an inspiration for spatially represented computational mechanisms, rather than as a computation in itself. To investigate computation by shrinkage and aggregation mechanisms we use the particle model which can uniformly re-spond and adapt to changes in synthetically imposed environmental conditions. We must approximate the environmental conditions which provoke sclerotium formation. We do this by simulating the removal of all stimuli, thus allowing the virtual plasmodium to adapt and shrink in time. The coarse results presented in Fig. 1h suggest that the plasmodium may approximate the centroid of the distribution of nutrients. The geometric centroid is a weighted mean of all the X and Y co-ordinates of a shape. For a two-dimensional shape with uniform thickness the centroid can be considered as the centre of mass of the shape and, for certain complex shapes, the centre of mass may lie outside the shape itself. Can the virtual plasmodium shed any light on any computation — or otherwise — by the Physarum plasmodium?
com-putational sense, that the physical adaptation over time (via shape minimisation and shrinkage) may abstract some computationally (and perhaps biologically. . . ) useful information about the original configuration. These preliminary results led us to further investigate methods and results in the approximation of statistical properties of complex datasets by morphological adaptation.
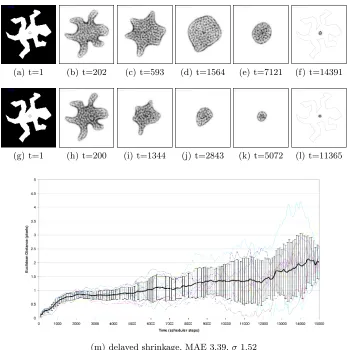
To assess different morphological adaptation methods and to see how well the adaptation approximates the centroid we initiated a large mass of virtual material in the pattern of a number of shapes. The shapes selected have different properties, such as solid, containing holes, concave, and convex. The material was held in the initial pattern by projecting attractants into the lattice correspond-ing to the original pattern for 50 scheduler steps. The centroid of each of the original patterns was computed conventionally by the mean value of all points within the pattern (for example Fig. 2a, circled). Since the particle population was initially configured as the original pattern the centroid of the population obviously initially matched the centroid of the original. The attractant stimuli was then completely removed from the lattice and the material underwent mor-phological adaptation via its emergent relaxation behaviour. Two mormor-phological adaptation mechanisms were investigated. In the first method shape adaptation was separate from shrinkage and the blob was allowed to adapt its shape whilst retaining the same number of particles. Shrinkage was delayed for 5000 sched-uler steps and only shape adaptation was initially used. After the material has recovered an approximately circular shape (at 5000 scheduler steps) the popu-lation was then reduced in size by randomly removing particles from the blob (at probability p =0.0005). As particles were removed the blob automatically shrunk in size, the shrinkage of the blob allowing a visual result of the centroid position (Fig. 2a-f). In the second method the shrinkage was implemented im-mediately after the stimulus was removed and occurred simultaneously with the shape adaptation (Fig. 2g-l). During both methods the centroid of the virtual material is computed conventionally by averaging the co-ordinates of all particles within the blob and compared to the centroid of the original pattern and the experiments were halted when the population size became <50. The Euclidean distance between the original centroid and blob centroid (the mean absolute er-ror, MAE) over ten runs is shown in the graphs for delayed shrinkage (Fig. 2m) and immediate shrinkage (Fig. 2n) respectively.
(a) (b)
(c) (d) (e) (f) (g)
[image:7.612.138.480.135.539.2](h) (i) MAE 3.39,σ1.35
(a) t=1 (b) t=202 (c) t=593 (d) t=1564 (e) t=7121 (f) t=14391
(g) t=1 (h) t=200 (i) t=1344 (j) t=2843 (k) t=5072 (l) t=11365
(m) delayed shrinkage, MAE 3.39,σ1.52
[image:8.612.134.481.116.466.2](n) immediate shrinkage, MAE 2.09,σ1.36
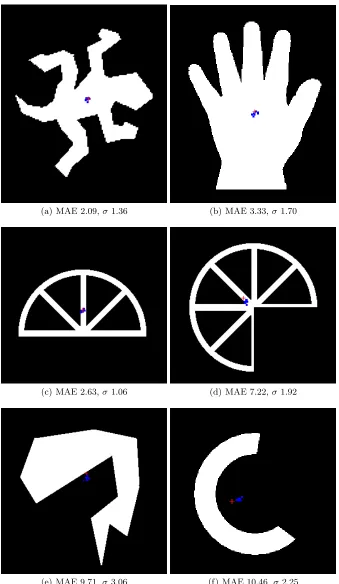
(a) MAE 2.09,σ1.36 (b) MAE 3.33,σ1.70
(c) MAE 2.63,σ1.06 (d) MAE 7.22,σ1.92
[image:9.612.139.478.116.700.2](e) MAE 9.71,σ3.06 (f) MAE 10.46,σ2.25
Results for the variety of shapes using the immediate shrinkage method are shown in Fig.3. Each sub-figure shows the centroid position of the original shape (marked by a red cross) and the distribution of blob centroids (the final position of the blob after adaptation and shrinkage) over ten runs, marked as a distribu-tion blue dots. The results show better performance at tracking the centroid of convex shapes, including those with holes (Fig.3a-c). As shapes become increas-ingly concave, the error begins to increase. The worst performance is on shapes with strongly concave features where the centroid lies outside the boundary of the original shape (Fig.3e-f).
4
Approximation of Arithmetic Statistics
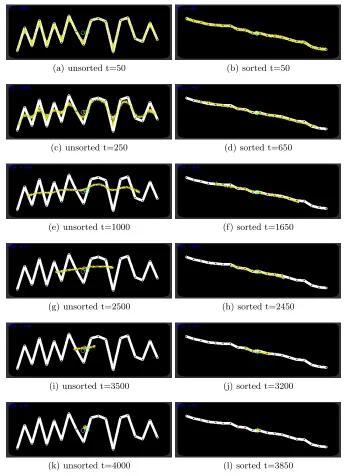
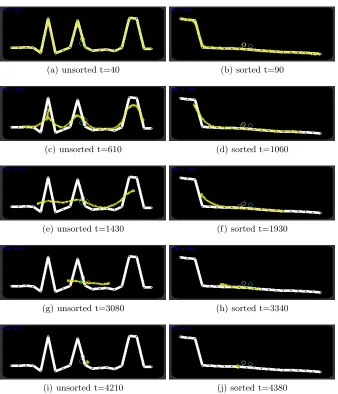
Instead of aggregating the geometric properties of a shape in two dimensions can we utilise the shrinkage method to summarise arithmetic properties of a spatially represented numerical dataset? To assess this possibility we randomly generated 20 numbers from the range of 0 to 100 and used these values as Y axis positions. The generated data values were sampled from a uniform distribution but had a wide range of variance across all experiments (σof between 542 and 1293 for the sorted data experiments andσbetween 462 and 1159 for the unsorted data experiments). X axis positions were generated using regular spacing of 20 pixels between the data points and we then connected these data points to give a shaped path on which to initialise the virtual material. The method was assessed over 50 randomly generated datasets for both unsorted lists of data (Fig. 4a,c,e,g,i,k) and for data points pre-sorted by value (Fig. 4b,d,f,h,j,l). During each run the virtual material was initially held in place by attractant projection for 20 steps of the model (Fig. 4a) and the attractant was then removed, causing the adaptive population to smooth and shrink the original shape. For unsorted data values the initial behaviour was to shrink away from sharp peaks and troughs connecting the data points (Fig. 4c) until an approximately smooth line was formed (Fig. 4e). This band of material then shrunk horizontally from each end (Fig. 4g,i). Each experiment was halted when the population size of the blob was < 50 and the final Y-axis position of the centre of the remaining population was compared to the arithmetic mean of the original data (Fig. 4k). In the case of the pre-sorted data values the smoothing of the line was much more short lived and the line began shrinking from both ends almost immediately. For the unsorted data points the mean error of the final blob position when compared to the numerically calculated arithmetic mean was 5.90 pixels (σ3.7) and for the pre-sorted population the mean error was 2.23 pixels (σ1.72). We did not find any strong correlation between the standard deviation of the randomly generated data points and performance (error) of the final position of the blob (Pearson correlation coefficient of ρ = -0.07 for sorted data and ρ = 0.09 for unsorted data).
(a) unsorted t=50 (b) sorted t=50
(c) unsorted t=250 (d) sorted t=650
(e) unsorted t=1000 (f) sorted t=1650
(g) unsorted t=2500 (h) sorted t=2450
(i) unsorted t=3500 (j) sorted t=3200
[image:12.612.134.479.124.600.2](k) unsorted t=4000 (l) sorted t=3850
(a) unsorted t=40 (b) sorted t=90
(c) unsorted t=610 (d) sorted t=1060
(e) unsorted t=1430 (f) sorted t=1930
(g) unsorted t=3080 (h) sorted t=3340
[image:13.612.140.478.162.556.2](i) unsorted t=4210 (j) sorted t=4380
5
Spatial Approximation of Noisy Estimation Functions
Estimation functions seek to provide accurate information (output) about certain properties of a physical system using inputs which are corrupted or unreliable in some way. Estimation may be by simple statistical summation of previous inputs, or can be aided by construction of a model of the system or recursive knowledge about previous estimation errors [9]. An example application is the tracking of the actual position of a vehicle [38] given inputs (for example image snapshots or GPS co-ordinates) which are corrupted with noise, thus providing incorrect information about the position of the vehicle at any single positional update. The model of vehicle behaviour may have certain assumptions about normal vehicle movement. For example, vehicles typically move forwards or backwards and steer to the left or to the right or their current position. This simple model information suggests, for example, that sudden crab-like movement sideways without moving forwards is unusual and likely to be caused be erroneous position data.
Organisms such as Physarum slime mould live in an environment which is extremely noisy, from a signals perspective. Moreover Physarum does not pos-sess any special senses or neural systems which are necessary in higher creatures to determine the presence of nutrients or threats. YetPhysarumhas been shown to be capable of complex choices in terms of optimal path selection [26], nutrient quality [23] and nutrient composition [7]. The organism is able to integrate com-plex spatial and temporal information in a distributed manner throughout its amorphous body plan. Behavioural selection based on the sensorial fusion of dis-parate input stimuli is via changes in streaming and overall movement direction. Chemotaxis gradients (both attractant and repellent) coming into contact with the plasmodium affect the properties of the membrane, in terms of membrane softening or changes in local oscillation frequencies, ultimately causing changes in streaming behaviour towards attractants and away from repellents.
We examined noisy estimation of object tracking in 2D environments using attractant (+ve) stimuli, repellent (−ve) stimuli and a fusion of both attractant and repellent (±ve) stimuli. 2D environments were represented by placing the blob in the middle of a square lattice, tracking movement of a simulated vehicle moving on the X-Y plane. Attractant stimuli were represented by the temporary projection of point attractant at stimulus locations into the lattice for a 10 sched-uler steps. Attractant stimuli near the periphery of the blob caused the blob to stream towards the stimulus. Repellent stimuli were represented by simulated illumination of the environment. The Area inside a square region surrounding the stimulus location (50×50 pixels wide, corresponding to the approximate size of the blob area) was masked off and all regions outside this square were exposed to temporary projection (for 10 scheduler steps) of simulated illumination. Illu-mination was simulated by the following method: If an agent is located within an illuminated region the value of sensed chemoattractant is reduced by multiplying it by a weighting factor of 0.1, thus reducing the value of sensed chemoattrac-tant in the illuminated region. The illumination causes exposed areas of the blob to migrate away from exposed regions. For combined +veand−vestimuli the scheduler alternated between +veand−vestimuli every 10 steps.
We represented the movement of the original vehicle movement positionpby an outward spiral movement initiated in the centre of the arena. We recorded tracking of the moving signal by the blob in both noise-free and noise contam-inated conditions. For the noise contamcontam-inated signals the original X-axis and Y-axis position of the vehiclepwas recorded and each axis position was contam-inated with Gaussian noise of σ = 20 to give the noisy stimulus n. The noisy stimulusnwas projected to the blob by a temporary projection of point attrac-tant stimulus or masked repellent region. The aggregate position of the blob was recorded by the centroid of all particles comprising the blobb. The position of the moving stimulus was updated every 25 steps. As the distance from the start position increased, the displacement of the simulated vehicle at each movement update became larger. The positions of p, n and b were recorded along with the absolute error (in pixels) of the position of the noisy stimulus n compared to original stimulus p and the error of the position of the original stimulus p compared to the blob centreb.
(a) +vestimuli (b)±vestimuli (c)−vestimuli
[image:16.612.150.469.189.521.2](d)
lag between the current blob position and the actual target position to cause a larger overall error. The combined±vestimuli condition performs slightly better than +vestimuli alone but the best performance in tracking is attained by the −ve(repellent only) stimulus condition (Fig. 6c).
When both the X and Y position of the moving target is contaminated with Gaussian noise of σ = 20, both the +veand ±ve conditions lose track of the target as its displacement increases (Fig. 7a and b, and the two corresponding plots in Fig. 7g). Only the −ve repellent stimulus alone is able to track the target, although its error also increases over time (Fig. 7c and corresponding plot in Fig. 7g). The effect of corrupting the stimuli signal with noise in both axes is indicated in Fig. 7d-f which shows the history of noise corrupted signals superimposed on the original signal and blob position. In all three stimulus types the plots (both noise free and noise contaminated) show oscillations in the accuracy of tracking the original target. This is due to the lag time of the blob in adjusting its position (i.e. shifting its mass of particles) in response to the moving target.
6
Mechanisms of Material Computation
The results demonstrate that it is possible to use very simple material-based shrinkage and adaptation behaviour to indirectly reveal and summarise proper-ties of geometric and arithmetic datasets. The actual computational mechanism is very simple: The mechanism transforms and shrinks the original shape into a minimal configuration. For a 2D shape this minimisation first withdraws exter-nal projections, then approximates a circle which, if reduced in size, will reduce to a point location. The method approximates the centroid of objects containing holes and also (although to a lesser degree of accuracy) concave objects whose centroid lies outside the shape itself. The adaptation occurs at the periphery of the mass of particles, initially withdrawing any projections into the main mass. The cohesion of the blob then pulls outward regions of the collective together and even away from the original starting shape area (in the case of concave shapes) to approximate the centroid (Fig. 3e-f and supplementary recordings). It is notable that the shrinkage of narrow projections occurs more quickly than in shapes which have a larger curve radius.
(a) +vestimuli (b)±vestimuli (c)−vestimuli
(d) noisy stimuli (e) noisy stimuli (f) noisy stimuli
[image:18.612.142.466.110.578.2](g)
be responsible for the apparent weighting of the final position of the blob in the case of pre-sorted data with a skewed distribution.
The ability of the self-oscillating amoeboid blob of material to track the noise contaminated target is, in part, due to the innate cohesion of the blob and in part due to the relatively large area of the blob. Although the blob streams towards (or away from, in the case of−vestimuli) potentially incorrect locations, the continuous update of (albeit noisy) positions ensures that the blob is not influenced too strongly by any one particular data point. Furthermore, any particularly erroneous data point stimulus actually has less of an effect on the blob than smaller errors. For +ve stimuli with a very small error margin from the true location (e.g. code 1 in Fig. 8, top) this will cause regions on both sides of the blob to move towards the stimulus site. For moderately large errors (code 2 in Fig. 8, top) the blob will stream outwards towards the erroneous stimuli but the cohesion of the remainder of the blob will give a resistant force against deformation. A large erroneous stimulus (code 3 in Fig. 8, top) is less likely to influence the blob at all, since the blob is attracted more strongly to closer stimuli.
(a)
[image:19.612.223.412.345.496.2](b)
Fig. 8. Effect of increasingly erroneous signals on blob tracking response for attractant and repellent stimuli. Blob indicated by blue oval, actual target lo-cation indicated by green cross, erroneous +ve location stimuli as red circles, erroneous−velocation stimuli as red squares. Larger numbers indicate increas-ingly large errors of position. Top: position of erroneous +ve point attractant stimuli, Bottom: position of erroneous−vestimuli mask zones.
(code 2 in Fig. 8, bottom) cause an influx into the masking zone which is resisted partly by the presence of unexposed particles inside the masking zone and partly due to the relatively large migration distance. For very large errors (code 3 in Fig. 8, bottom) the entire blob is exposed to the repellent stimuli and thus the overall position of the blob does not shift significantly. This ability to integrate and absorb a large number of noisy inputs allows the blob to track the original target despite the large noise component contaminating the signal.
The representation of numerical data in classical algorithms is efficient and inexpensive, in terms of computer resources. The transformation to a spatial unconventional computing representation requires significant spatial resources in terms of image area. It is not possible to reduce the representation of a single data point lower than a certain size because the emergent material effects are exerted only above a certain particle sensor size (>= 3 pixels). Furthermore, the speed of the model framework is mostly dependent on image area size (the diffusion of the environment at each scheduler step requires a convolution operation at each site) and partially dependent on population size. The time taken for the material to relax to a state where the result can be ‘read’ is also dependent on the size range of the data involved which also limits the practicality of the method as it currently stands. However it may be possible in future work to improve the spatial encoding of the numerical data used in the model to a more compact and efficient scheme.
7
Conclusions
The results in this paper demonstrate that the collective bulk mechanical properties which emerge from, and are embodied within, low-level local interac-tions, such as cohesion, minimisation and shape adaptation, can be harnessed to extract statistical properties of complex 1D, 2D and noisy dynamical datasets. The impetus behind this research is not to discover the ‘best’ method of calcu-lating these functions, since numerical methods of doing so are already well un-derstood and indeed more accurate. Instead the purpose is to try to understand what are theminimal requirements for discovering such information within these datasets. Future robotic devices will hopefully be able to access such embodied material computation to gain information about features of their environment which would otherwise require external or off-line processing. Mechanical analo-gies are also a useful method to explain and understand complex algorithms in computational geometry [32] and in statistics more generally [8]. We specu-late that material computation methods may in future provide both practical methods for the distributed solution of statistical problems and also potentially generate novel statistical metrics based on collective material properties. More generally, this may provide a greater understanding of how simple organisms with limited computational abilities can approximate complex problems.
Acknowledgements
This work was supported by the EU research project “Physarum Chip: Growing Computers from Slime Mould” (FP7 ICT Ref 316366)
8
Appendix: Particle Model Description
The multi-agent model of Physarum uses a population of coupled mobile par-ticles with very simple behaviours, residing within a 2D diffusive lattice. The lattice stores particle positions and the concentration of a local diffusive fac-tor referred to generically as chemoattractant. Particles deposit this chemoat-tractant factor when they move and also sense the local concentration of the chemoattractant during the sensory stage of the particle algorithm. Collective particle positions represent the global shape of the material.
8.1 Generation of Virtual Plasmodium Cohesion and Shape Adaptation
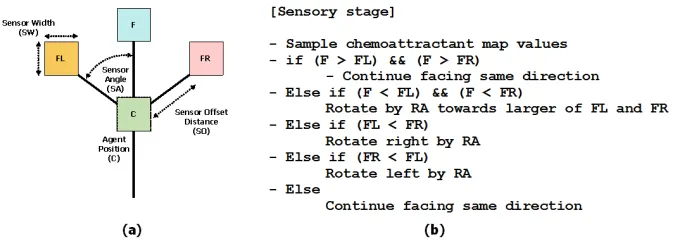
local coupling to occur. For the experiments in this article we used an SO value of 9. During the sensory stage each particle changes its orientation to rotate (via the parameter rotation angle, RA) towards the strongest local source of chemoattractant (Fig. 9b). Variations in both SA and RA parameters have been shown to generate a wide range of reaction-diffusion patterns [12] and for these experiments we used SA 90 and RA 45 which results in stronger and more rapid adaptation and cohesion of the virtual material. After the sensory stage, each particle executes the motor stage and attempts to move forwards in its current orientation (an angle from 0–360 degrees) by a single pixel forwards. Each lattice site may only store a single particle and particles deposit chemoattractant into the lattice (5 units per step) only in the event of a successful forwards movement. If the next chosen site is already occupied by another particle the move is abandoned and the particle selects a new randomly chosen direction. The particles act independently and iteration of the particle population during both sensory and motor stages is performed randomly to avoid any artifacts from sequential ordering.
For the object tracking experiments we require a means of moving the po-sition of the blob in response to the changing data. This is implemented by exploiting the self-organised amoeboid movement of the blob under oscillatory conditions. Instead of randomly selecting a new direction if a move forward is blocked, the particle increments separate internal co-ordinates until the nearest cell directly in front of the particle is free. When a cell becomes free, the particle occupies this new cell and deposits chemoattractant into the lattice at the new site. The effect of this behaviour is to remove the fluidity of the default movement of the population. The result is a surging, resistant pattern of movement. The strength of the resistance effect can be damped by a parameter pIDwhich de-termines the probability of a particle resetting its internal position co-ordinates, lower values providing stronger inertial movement. For these experiments we use a pID value of 0.05 which provides enough internal oscillations within the blob to generate amoeboid movement.
8.2 Environment and Problem Data Representation
Fig. 9. Architecture of a single particle of the virtual material and its sensory algorithm. (a) Morphology showing agent position ‘C’ and offset sensor positions (FL, F, FR), (b) Algorithm for particle sensory stage.
the data series were generated using pseudo-random number generators (gener-ating numbers with a uniform distribution) and these numbers were spatially represented by marking the lattice pixel sites corresponding to these numbers in order to initialise the material at these locations. Neighbouring sites were linked by straight lines six pixels wide in order to provide a continuous path on which to inoculate the virtual plasmodium.
8.3 Material Shrinkage Mechanism
of testing for particle division and particle removal was every 2 scheduler steps. This relatively high frequency (compared to other applications using the virtual material approach, e.g. [20]) is due to the strong shrinkage invoked by the par-ticular SA/RA combination used, necessitating a high adaptation frequency to maintain connectivity of the material as it adapts and shrinks.
References
1. A. Adamatzky. Developing proximity graphs byPhysarum polycephalum: does the plasmodium follow the toussaint hierarchy.Parallel Processing Letters, 19:105–127, 2008.
2. A. Adamatzky. If BZ medium did spanning trees these would be the same trees asPhysarum built. Physics Letters A, 373(10):952–956, 2009.
3. A. Adamatzky, B. de Lacy Costello, and T. Shirakawa. Universal computation with limited resources: Belousov-zhabotinsky and Physarum computers. International Journal of Bifurcation and Chaos, 18(8):2373–2389, 2008.
4. A. Adamatzky and J. Jones. Programmable reconfiguration ofPhysarummachines. Natural Computing, 9(1):219–237, 2010.
5. J. Buhl, D.J.T. Sumpter, I.D. Couzin, J.J. Hale, E. Despland, E.R. Miller, and S.J. Simpson. From disorder to order in marching locusts. Science, 312(5778):1402, 2006.
6. A.C.H. Durham and E.B. Ridgway. Control of chemotaxis in Physarum poly-cephalum. The Journal of Cell Biology, 69:218–223, 1976.
7. A. Dussutour, T. Latty, M. Beekman, and S.J. Simpson. Amoeboid organism solves complex nutritional challenges. Proceedings of the National Academy of Sciences, 107(10):4607, 2010.
8. R. W. Farebrother. Visualizing statistical models and concepts, volume 166. CRC Press, 2002.
9. M. S. Grewal and A. P. Andrews. Kalman filtering: theory and practice using MATLAB. Wiley. com, 2011.
10. D. Helbing. Traffic and related self-driven many-particle systems. Reviews of modern physics, 73(4):1067, 2001.
11. D. Helbing, P. Molnar, I.J. Farkas, and K. Bolay. Self-organizing pedestrian move-ment. Environment and planning B, 28(3):361–384, 2001.
12. J. Jones. Characteristics of pattern formation and evolution in approximations of Physarum transport networks. Artificial Life, 16(2):127–153, 2010.
13. J. Jones. The emergence and dynamical evolution of complex transport networks from simple low-level behaviours. International Journal of Unconventional Com-puting, 6(2):125–144, 2010.
14. J. Jones. Influences on the formation and evolution of Physarum polycephalum inspired emergent transport networks. Natural Computing, pages 1–25, 2011. 15. J. Jones. Towards programmable smart materials: Dynamical reconfiguration of
emergent transport networks. Int. Journal of Unconventional Comput., 7(6):423– 447, 2011.
16. J. Jones and A. Adamatzky. Towards Physarum binary adders. Biosystems, 101(1):51–58, 2010.
18. J. Jones and A. Adamatzky. Material approximation of data smoothing and spline curves inspired by slime mould.Bioinspiration and Biomimetics, Submitted, 2013. 19. J. Jones and A. Adamatzky. Slime mould inspired generalised voronoi diagrams
with repulsive fields. Int. J. Bifurcation and Chaos, In-Press, 2013.
20. J. Jones and A. Adamatzky. Computation of the travelling salesman problem by a shrinking blob. Natural Computing, 13(1):1–16, 2014.
21. J.A. Jump. Studies on sclerotization in physarum polycephalum.American journal of botany, pages 561–567, 1954.
22. U. Kishimoto. Rhythmicity in the protoplasmic streaming of a slime mould, Physarum polycephalum.The Journal of general physiology, 41(6):1223–1244, 1958. 23. T. Latty and M. Beekman. Food quality affects search strategy in the acellular
slime mould,Physarum polycephalum. Behavioral Ecology, 20(6):1160, 2009. 24. M. Matsushita, J. Wakita, H. Itoh, K. Watanabe, T. Arai, T. Matsuyama, H.
Sak-aguchi, and M. Mimura. Formation of colony patterns by a bacterial cell pop-ulation. Physica A: Statistical Mechanics and its Applications, 274(1):190–199, 1999.
25. T. Nakagaki, S. Uemura, Y. Kakiuchi, and T. Ueda. Action spectrum for sporu-lation and photoavoidance in the plasmodium of Physarum polycephalum, as modified differentially by temperature and starvation. Photochem. Photobiol., 64(5):859–862, 1996.
26. T. Nakagaki, H. Yamada, and A. Toth. Intelligence: Maze-solving by an amoeboid organism. Nature, 407:470, 2000.
27. T. Nakagaki, H. Yamada, and T. Ueda. Interaction between cell shape and contrac-tion pattern in thePhysarum plasmodium.Biophysical Chemistry, 84(3):195–204, 2000.
28. R. Pfeifer and F. Iida. Morphological computation: Connecting body, brain and environment. Japanese Scientific Monthly, 58(2):48–54, 2005.
29. C.R. Reid, T. Latty, A. Dussutour, and M. Beekman. Slime mold uses an exter-nalized spatial memory to navigate in complex environments. Proceedings of the National Academy of Sciences, 109(43):17490–17494, 2012.
30. C.W. Reynolds. Flocks, herds and schools: A distributed behavioral model. In ACM SIGGRAPH Computer Graphics, volume 21, pages 25–34. ACM, 1987. 31. T. Saigusa, A. Tero, T. Nakagaki, and Y. Kuramoto. Amoebae anticipate periodic
events. Phys. Rev. Lett., 100(1), 2008.
32. J.A. Sellares and G. Toussaint. On the role of kinesthetic thinking in computa-tional geometry. International Journal of Mathematical Education in Science and Technology, 34(2):219–237, 2003.
33. T. Shirakawa, A. Adamatzky, Y.-P. Gunji, and Y. Miyake. On simultaneous construction of voronoi diagram and delaunay triangulation by Physarum poly-cephalum.International Journal of Bifurcation and Chaos, 19(9):3109–3117, 2009. 34. A. Takamatsu, E. Takaba, and G. Takizawa. Environment-dependent morphology in plasmodium of true slime moldPhysarum polycephalum and a network growth model. Journal of theoretical Biology, 256(1):29–44, 2009.
35. S. Tsuda, M. Aono, and Y.-P. Gunji. Robust and emergent Physarum logical-computing. BioSystems, 73:45–55, 2004.
36. S. Tsuda and J. Jones. The emergence of synchronization behavior in Physarum polycephalum and its particle approximation. Biosystems, 103:331–341, 2010. 37. S. Tsuda, J. Jones, and A. Adamatzky. Towards Physarum engines. Applied
Bionics and Biomechanics, 9(3):221–240, 2012.