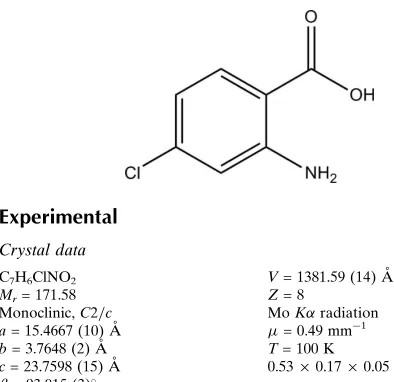
2-Amino-4-chlorobenzoic acid
Abeer Mohamed Farag,aSiang Guan Teoh,aHasnah Osman,aChin Sing Yeapb‡ and Hoong-Kun Funb*§
a
School of Chemical Sciences, Universiti Sains Malaysia, 11800 USM, Penang, Malaysia, andbX-ray Crystallography Unit, School of Physics, Universiti Sains Malaysia, 11800 USM, Penang, Malaysia
Correspondence e-mail: hkfun@usm.my
Received 23 November 2010; accepted 1 December 2010
Key indicators: single-crystal X-ray study;T= 100 K; mean(C–C) = 0.001 A˚; Rfactor = 0.030;wRfactor = 0.089; data-to-parameter ratio = 32.5.
The title compound, C7H6ClNO2, is almost planar, with an
r.m.s. deviation of 0.040 A˚ . An intramolecular N—H O hydrogen bond generates an S(6) ring motif. In the crystal, molecules are linked into centrosymmetric dimers by pairs of O—H O hydrogen bonds. These dimers are stacked along [010].
Related literature
For the pharmacological properties of quinazolinone deriva-tives, see: Prakash Naiket al.(2009); Bembeneket al.(2010); Milleret al.(2010); Sikorskaet al.(1998). For the stability of the temperature controller used in the data collection, see: Cosier & Glazer (1986). For hydrogen-bond motifs, see: Bernsteinet al.(1995).
Experimental
Crystal data
C7H6ClNO2 Mr= 171.58 Monoclinic,C2=c a= 15.4667 (10) A˚
b= 3.7648 (2) A˚
c= 23.7598 (15) A˚
= 93.015 (3)
V= 1381.59 (14) A˚3 Z= 8
MoKradiation
= 0.49 mm1 T= 100 K
0.530.170.05 mm
Data collection
Bruker APEXII DUO CCD diffractometer
Absorption correction: multi-scan (SADABS; Bruker, 2009)
Tmin= 0.780,Tmax= 0.975
34764 measured reflections 3645 independent reflections 3175 reflections withI> 2(I)
Rint= 0.035
Refinement
R[F2> 2(F2)] = 0.030 wR(F2) = 0.089
S= 1.07 3645 reflections 112 parameters
H atoms treated by a mixture of independent and constrained refinement
max= 0.55 e A˚
3 min=0.21 e A˚
[image:1.610.46.243.498.689.2]3
Table 1
Hydrogen-bond geometry (A˚ ,).
D—H A D—H H A D A D—H A
O2—H1O2 O1i
0.853 (16) 1.787 (16) 2.6354 (8) 173.0 (16) N1—H1N1 O1 0.851 (15) 2.102 (14) 2.6918 (9) 126.0 (13)
Symmetry code: (i)x;yþ1;z.
Data collection:APEX2(Bruker, 2009); cell refinement:SAINT
(Bruker, 2009); data reduction:SAINT; program(s) used to solve structure: SHELXTL (Sheldrick, 2008); program(s) used to refine structure:SHELXTL; molecular graphics:SHELXTL; software used to prepare material for publication:SHELXTLandPLATON(Spek, 2009).
The authors thank the Malaysian Government and Universiti Sains Malaysia (USM) for the RU research grant (815002). AMF thanks the Libyan Government for providing a scholarship. HKF and CSY thank USM for the Research University Grant No. 1001/PFIZIK/811160.
Supplementary data and figures for this paper are available from the IUCr electronic archives (Reference: HB5757).
References
Bembenek, S. D., Hocutt, F. M., Leonard, B. E. Jr, Rabinowitz, M. H., Rosen, M. D., Tarantino, K. T. & Venkatesan, H. (2010). US Patent Appl. 20100204226.
Bernstein, J., Davis, R. E., Shimoni, L. & Chang, N.-L. (1995).Angew. Chem. Int. Ed. Engl.34, 1555–1573.
Bruker (2009).APEX2,SAINTandSADABS. Bruker AXS Inc., Madison, Wisconsin, USA.
Cosier, J. & Glazer, A. M. (1986).J. Appl. Cryst.19, 105–107.
Miller, J. R., Venkataraman, T., Melnick, M. M., Lall, M., Donovan, C., Sarver, R. W., Lee, D.-Y., Ohren, J. & Emerson, D. (2010).Chem. Biol. Drug Des. 75, 444–454.
Prakash Naik, H. R., Bhojya Naik, H. S., Ravikumar Naik, T. R., Raghavendra, M., Aravinda, T. & Lamani, D. S. (2009).Phosphorus Sulfur Silicon Relat. Elem.184, 460–470.
Sheldrick, G. M. (2008).Acta Cryst.A64, 112–122.
Sikorska, M., Mrozek, R. & Rzqczynska, Z. (1998).J. Therm. Anal. Calorim. 51, 467–475.
Spek, A. L. (2009).Acta Cryst.D65, 148–155.
Acta Crystallographica Section E
Structure Reports
Online
ISSN 1600-5368
supporting information
Acta Cryst. (2011). E67, o37 [https://doi.org/10.1107/S1600536810050166]
2-Amino-4-chlorobenzoic acid
Abeer Mohamed Farag, Siang Guan Teoh, Hasnah Osman, Chin Sing Yeap and Hoong-Kun Fun
S1. Comment
Anthranilic acid is required as a starting compound to prepare quinoline derivatives. Quinazolinones are well known as
biologically active compounds. Quinazolinones have been studied for their interesting pharmacological properties such as
analgesic, antiinflammatory, antibacterial, anticonvulsant, antihypertensive, antimalarial, anticancer activities and as
treatment of diabetic complications such as cataracts, nephropathy and neuropathy (Prakash Naik et al., 2009), as well as
used as prolyl hydroxylase inhibitors (Bembenek et al., 2010) and antibacterial drugs (Miller et al., 2010). New
complexes have been prepared from 2-amino-4-chlorobenzoic acid by Sikorska et al., (1998).
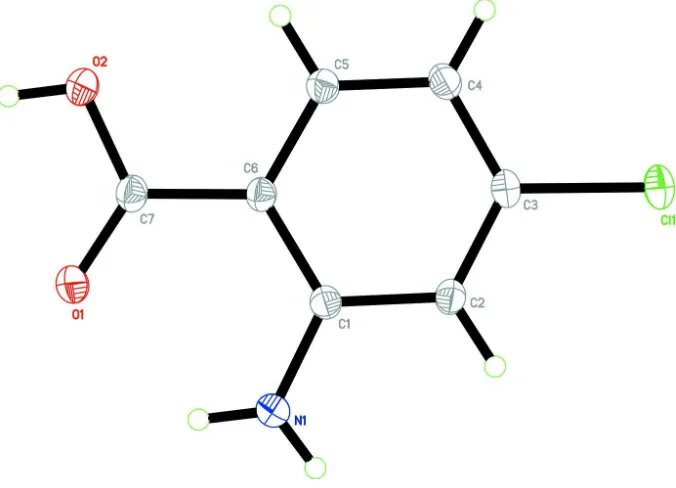
The title compound (Fig. 1) is almost planar with maximum deviation of 0.097 (1) Å at atom O1. An intramolecular N1
—H1N1···O1 hydrogen bond generates S(6) ring motif (Bernstein et al., 1995). In the crystal, the molecules are linked
into centrosymmetric dimers by O2—H1O2···O1 hydrogen bonds and these dimers are stacked down b axis (Fig. 2, Table
1).
S2. Experimental
The attempt to prepare the Schiff base ligand by stirring 2-amino-4-chlorobenzoic acid (1 mol) and salicyldehyde (1 mol)
together at 70 °C for 3 h in 10 ml of ethanol was unsuccessful. The resulting orange solution was filtered and orange
needles were formed after a few days of slow evaporation of the solvent at room temperature. Unfortunately, the crystals
were that of the starting material (2-amino-4-chlorobenzoic acid) with melting point 119 °C.
S3. Refinement
The O– and N-bound hydrogen atoms were located from difference Fourier map and refined freely. The rest of hydrogen
Figure 1
The molecular structure of title compound with 50% probability ellipsoids for non-H atoms.
Figure 2
[image:3.610.134.473.356.661.2]2-Amino-4-chlorobenzoic acid
Crystal data
C7H6ClNO2 Mr = 171.58 Monoclinic, C2/c Hall symbol: -C 2yc a = 15.4667 (10) Å b = 3.7648 (2) Å c = 23.7598 (15) Å β = 93.015 (3)° V = 1381.59 (14) Å3 Z = 8
F(000) = 704 Dx = 1.650 Mg m−3
Mo Kα radiation, λ = 0.71073 Å Cell parameters from 9945 reflections θ = 2.6–37.5°
µ = 0.49 mm−1 T = 100 K Needle, orange 0.53 × 0.17 × 0.05 mm
Data collection
Bruker APEXII DUO CCD diffractometer
Radiation source: fine-focus sealed tube Graphite monochromator
φ and ω scans
Absorption correction: multi-scan (SADABS; Bruker, 2009) Tmin = 0.780, Tmax = 0.975
34764 measured reflections 3645 independent reflections 3175 reflections with I > 2σ(I) Rint = 0.035
θmax = 37.5°, θmin = 1.7° h = −26→26
k = −6→6 l = −38→40
Refinement
Refinement on F2 Least-squares matrix: full R[F2 > 2σ(F2)] = 0.030 wR(F2) = 0.089 S = 1.07 3645 reflections 112 parameters 0 restraints
Primary atom site location: structure-invariant direct methods
Secondary atom site location: difference Fourier map
Hydrogen site location: inferred from neighbouring sites
H atoms treated by a mixture of independent and constrained refinement
w = 1/[σ2(F
o2) + (0.0479P)2 + 0.5195P] where P = (Fo2 + 2Fc2)/3
(Δ/σ)max = 0.001 Δρmax = 0.55 e Å−3 Δρmin = −0.21 e Å−3
Special details
Experimental. The crystal was placed in the cold stream of an Oxford Cryosystems Cobra open-flow nitrogen cryostat
(Cosier & Glazer, 1986) operating at 100.0 (1) K.
Geometry. All e.s.d.'s (except the e.s.d. in the dihedral angle between two l.s. planes) are estimated using the full covariance matrix. The cell e.s.d.'s are taken into account individually in the estimation of e.s.d.'s in distances, angles and torsion angles; correlations between e.s.d.'s in cell parameters are only used when they are defined by crystal symmetry. An approximate (isotropic) treatment of cell e.s.d.'s is used for estimating e.s.d.'s involving l.s. planes.
Refinement. Refinement of F2 against ALL reflections. The weighted R-factor wR and goodness of fit S are based on F2, conventional R-factors R are based on F, with F set to zero for negative F2. The threshold expression of F2 > σ(F2) is used only for calculating R-factors(gt) etc. and is not relevant to the choice of reflections for refinement. R-factors based on F2 are statistically about twice as large as those based on F, and R- factors based on ALL data will be even larger.
Fractional atomic coordinates and isotropic or equivalent isotropic displacement parameters (Å2)
x y z Uiso*/Ueq
Cl1 0.400495 (11) 0.03406 (5) 0.207389 (8) 0.02000 (6)
O2 0.11545 (4) 0.57721 (19) 0.00817 (2) 0.02167 (12)
N1 0.07764 (4) 0.0546 (2) 0.16254 (3) 0.02152 (13)
C1 0.15675 (4) 0.1453 (2) 0.14497 (3) 0.01451 (11)
C2 0.23039 (4) 0.0671 (2) 0.18024 (3) 0.01549 (12)
H2A 0.2241 −0.0407 0.2150 0.019*
C3 0.31151 (4) 0.1502 (2) 0.16319 (3) 0.01506 (11)
C4 0.32545 (4) 0.3164 (2) 0.11206 (3) 0.01691 (12)
H4A 0.3810 0.3700 0.1015 0.020*
C5 0.25346 (4) 0.3983 (2) 0.07761 (3) 0.01614 (12)
H5A 0.2610 0.5113 0.0434 0.019*
C6 0.16899 (4) 0.31592 (19) 0.09275 (3) 0.01417 (11)
C7 0.09544 (5) 0.4008 (2) 0.05369 (3) 0.01611 (12)
H1O2 0.0692 (10) 0.603 (5) −0.0126 (7) 0.038 (4)*
H1N1 0.0309 (10) 0.083 (4) 0.1425 (6) 0.034 (4)*
H2N1 0.0757 (11) −0.069 (5) 0.1911 (7) 0.042 (4)*
Atomic displacement parameters (Å2)
U11 U22 U33 U12 U13 U23
Cl1 0.01555 (8) 0.02243 (10) 0.02140 (9) 0.00327 (6) −0.00502 (6) −0.00029 (6)
O1 0.0145 (2) 0.0335 (3) 0.0191 (2) −0.0014 (2) −0.00278 (17) 0.0055 (2)
O2 0.0174 (2) 0.0316 (3) 0.0157 (2) −0.0006 (2) −0.00240 (18) 0.0067 (2)
N1 0.0141 (2) 0.0308 (4) 0.0196 (3) −0.0016 (2) 0.0007 (2) 0.0075 (3)
C1 0.0134 (2) 0.0150 (3) 0.0150 (2) 0.0001 (2) −0.00005 (19) 0.0001 (2)
C2 0.0147 (3) 0.0169 (3) 0.0146 (2) 0.0013 (2) −0.0012 (2) 0.0011 (2)
C3 0.0136 (2) 0.0155 (3) 0.0158 (2) 0.0016 (2) −0.00237 (19) −0.0019 (2)
C4 0.0134 (2) 0.0203 (3) 0.0169 (3) −0.0005 (2) −0.0001 (2) −0.0009 (2)
C5 0.0152 (3) 0.0187 (3) 0.0144 (2) −0.0007 (2) 0.0000 (2) −0.0002 (2)
C6 0.0139 (2) 0.0154 (3) 0.0130 (2) 0.0005 (2) −0.00089 (19) −0.0004 (2)
C7 0.0159 (3) 0.0183 (3) 0.0140 (2) 0.0013 (2) −0.00138 (19) −0.0003 (2)
Geometric parameters (Å, º)
Cl1—C3 1.7425 (7) C2—C3 1.3746 (10)
O1—C7 1.2415 (9) C2—H2A 0.9300
O2—C7 1.3197 (9) C3—C4 1.3933 (10)
O2—H1O2 0.854 (16) C4—C5 1.3816 (10)
N1—C1 1.3572 (9) C4—H4A 0.9300
N1—H1N1 0.851 (16) C5—C6 1.4078 (9)
N1—H2N1 0.826 (17) C5—H5A 0.9300
C1—C2 1.4093 (10) C6—C7 1.4651 (10)
C1—C6 1.4185 (9)
C7—O2—H1O2 107.8 (11) C5—C4—C3 117.38 (6)
C1—N1—H1N1 123.2 (10) C5—C4—H4A 121.3
C1—N1—H2N1 117.9 (12) C3—C4—H4A 121.3
H1N1—N1—H2N1 117.7 (15) C4—C5—C6 121.95 (7)
N1—C1—C6 123.17 (6) C6—C5—H5A 119.0
C2—C1—C6 118.28 (6) C5—C6—C1 119.45 (6)
C3—C2—C1 119.92 (6) C5—C6—C7 119.34 (6)
C3—C2—H2A 120.0 C1—C6—C7 121.20 (6)
C1—C2—H2A 120.0 O1—C7—O2 121.70 (7)
C2—C3—C4 123.01 (6) O1—C7—C6 123.38 (7)
C2—C3—Cl1 118.00 (5) O2—C7—C6 114.92 (6)
C4—C3—Cl1 118.99 (5)
N1—C1—C2—C3 178.90 (7) N1—C1—C6—C5 −179.53 (8)
C6—C1—C2—C3 −1.19 (11) C2—C1—C6—C5 0.57 (11)
C1—C2—C3—C4 0.96 (12) N1—C1—C6—C7 −0.92 (12)
C1—C2—C3—Cl1 −177.87 (6) C2—C1—C6—C7 179.18 (7)
C2—C3—C4—C5 −0.05 (12) C5—C6—C7—O1 174.64 (7)
Cl1—C3—C4—C5 178.77 (6) C1—C6—C7—O1 −3.97 (12)
C3—C4—C5—C6 −0.59 (12) C5—C6—C7—O2 −5.06 (11)
C4—C5—C6—C1 0.33 (11) C1—C6—C7—O2 176.34 (7)
C4—C5—C6—C7 −178.31 (7)
Hydrogen-bond geometry (Å, º)
D—H···A D—H H···A D···A D—H···A
O2—H1O2···O1i 0.853 (16) 1.787 (16) 2.6354 (8) 173.0 (16)
N1—H1N1···O1 0.851 (15) 2.102 (14) 2.6918 (9) 126.0 (13)