Original citation:
A combined DEM–FEM numerical method for Shot Peening parameter optimisation. Advances in Engineering Software, 79. pp. 13-26.
http://dx.doi.org/10.1016/j.advengsoft.2014.09.001 Permanent WRAP url:
http://wrap.warwick.ac.uk/71252 Copyright and reuse:
The Warwick Research Archive Portal (WRAP) makes this work of researchers of the University of Warwick available open access under the following conditions. Copyright © and all moral rights to the version of the paper presented here belong to the individual author(s) and/or other copyright owners. To the extent reasonable and practicable the material made available in WRAP has been checked for eligibility before being made available.
Copies of full items can be used for personal research or study, educational, or not-for-profit purposes without prior permission or charge. Provided that the authors, title and full bibliographic details are credited, a hyperlink and/or URL is given for the original metadata page and the content is not changed in any way.
Publisher statement:
© 2015 Elsevier, Licensed under the Creative Commons Attribution-NonCommercial-NoDerivatives 4.0 International http://creativecommons.org/licenses/by-nc-nd/4.0/ A note on versions:
The version presented here may differ from the published version or, version of record, if you wish to cite this item you are advised to consult the publisher’s version. Please see the ‘permanent WRAP url’ above for details on accessing the published version and note that access may require a subscription.
A combined DEM-FEM numerical method for Shot Peening parameter optimisation
K. Murugaratnam a
, S. Utili a,b
, N. Petrinic a
a
Department of Engineering Science, University of Oxford, Parks Road, Oxford OX1 3PJ
b
School of Engineering, University of Warwick, Coventry CV4 7AL
Email: [email protected]
Corresponding author
Kovthaman Murugaratnam
Department of Engineering Science University of Oxford
Parks Road, Oxford OX1 3PJ
United Kingdom
email : [email protected]
Abstract
A numerical modelling approach capable of simulating Shot Peening (SP) processes of
industrial interest was developed by combining the Discrete Element Method (DEM) with the
Finite Element Method (FEM).
In this approach, shot-shot and shot-target interactions as well as the overall shot flow were
simulated efficiently using rigid body dynamics. A new algorithm to dynamically adapt the
coefficient of restitution (CoR) for repeated impacts of shots on the same spot was
implemented in the DEM code to take into account the effect of material hardening. Then, a
parametric study was conducted using the Finite Element Method (FEM) to investigate the
influence of the SP parameters on the development of residual stresses.
Finally, a two-step coupling method is presented to combine the output of DEM simulation
with FEM analyses to retrieve the Compressive Residual Stresses (CRS) after multiple
impacts with the aim to evaluate the minimum area required to be modelled to realistically
capture the field of residual stresses. A series of such coupled analyses were performed to
determine the effect of peening angle and the combination of initial velocity and mass flow
rate on CRS.
1. Introduction
Shot Peening (SP) is common industrial cold working process that is applied to induce a field
of Compressive Residual Stresses (CRS) on the surface of a metallic component [1].
Compressive stresses are beneficial in increasing resistance to fatigue failures, corrosion
fatigue, fretting, wear etc. In the process, a huge number of tiny spherical particles impact the
treated surface. The overall process is ruled by multiple parameters, which need to be
controlled and monitored in order to induce an appropriate CRS distribution providing
additional resistance to the treated component [2]. The treatment surface is impacted by a
large amount of round metallic particles, the so called ‘shots’, at high velocities. Each shot
acts as a tiny peen hammer, causing the surface to yield in plastic deformation and leaving a
concave depression, termed dimple, on the surface of the target component. The stress field
of the depression is similar to the field of a flat bar being bent. The concave side of the bar is
in compression and the convex side is in tension. The normal stress along the cross section of
the bar varies from a maximum compressive stress on the concave surface, to zero stress at
the neutral axis up to a maximum tensile stress on the convex surface.
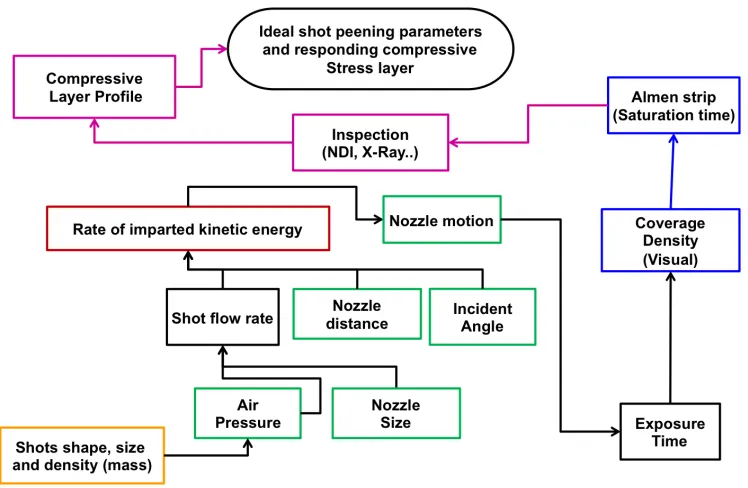
Several parameters have a direct influence on the CRS. The most important ones are:
shot density, shot shape and material, impact angle, air pressure (shot velocity), nozzle
geometry (diameter, peening angle and distance to the treated surface), and exposure time.
Figure 1 provides a succinct conceptual visualization of how the peening parameters affect
the peening quality.
[image:5.595.74.448.94.338.2]
Figure 1:Parameters affecting the peening process.
Currently section of the optimal SP parameters is carried out empirically by
performing several peening tests. The current empirical procedures are time – consuming and
very expensive. An efficient numerical method for the simulation of SP processes is needed
to provide a faster procedure for the selection of the optimal parameters for SP requiring the
use of far less experimental tests which would be employed as validation of the numerical
method rather than as a tool to search for the optimal values of the parameters. Moreover, an
efficient numerical model can also help improve quality control and increase confidence in
the SP process.
In this paper a novel combined DEM-FEM numerical approach was developed to
simulate the SP process. Modelling SP processes is very complex since it involves the
interaction of a metallic surface with an enormous number of shots. Experimental studies are
normally extremely costly, especially when aiming to optimise the set of peening parameters.
Numerical simulations allow for the understanding of the influence of the individual peening
to be achieved. SP parameters are customarily chosen on the basis of either empirical laws or
past practice. The relationship between the desired peening effect, particularly the residual
stress distribution of the treated surface, and the peening parameters is still unknown and
needs to be investigated. In fact, different values of peening parameters may give rise to very
different fields of residual stress distribution.
Single and multiple shot impacts have been analysed by Al-Hassani et al. [3] , Deslaef
et al. [4], Majzoobi et al. [5], Meguid et al. [6], Han et al. [7] , Hong et al. [8], and Baskaran
et al. [9]. Al-Hassani et al. [3] investigated the single shot impacts at various angles. Deslaef
et al. [4] examined the effect of rigid and deformable shots. Majzoobi et al. [5] conducted a
three dimensional numerical study where multiple shots impact on a target surface at
different velocities. They concluded that the obtained residual stress distribution highly
depends on impact velocity and number of impacts and that the maximum CRS rises as the
velocity increases only up to a point and thereafter it begins to decline. Meguid et al. [6]
performed dynamic finite element analyses of single shot impacts investigating the effects of
shot velocity, size and shape and target characteristics on CRS concluding that the effects of
shot parameters were more significant than the strain-hardening rate of the target material.
Most of the SP studies performed in the literature do not model the shot-shot
interaction occurring during the travel from the nozzle to the target surface and the shot
rebounds from the target surface. Discrete element models were proposed by Han et al. [7],
Hong et al. [8] and Baskaran et al. [9] to analyze the shot-shot and shot-target interaction in
more detail, assuming both shot and target surface being rigid bodies. Later on, Baskaran et
al. [8] coupled the DEM with FEM. However, the relationship between the peening
parameters employed as input data in the DEM and the resulting CRS in FEM has not been
Cao et al. [10] proposed an approximate model able to relate Almen intensity to shot
velocity, however the relationship with the residual stresses in the shot peened object was not
investigated. Many approaches recorded in published research deal with the prediction of
residual stresses due to SP but do not relate them with Almen intensity and are therefore of
limited practical interest. In contrast, Guagliano [11] employed the FEM to predict the
residual stresses induced by SP on a metal target surface and related these stresses to Almen
intensity simulating the impact of a few shots on a flat plate.
An explicit dynamic algorithm for modelling up to 1000 impacts was described by
Wang et al. [12] who showed that the FEM is able to investigate macroscopic effects (e.g.
curvature) of SP as well as microscopic effects (e.g. local plasticity and residual stresses).
The study, however, did not include any shot-shot interaction.
On the other hand, this paper focuses on the development of an appropriate numerical
model that can be used to optimise the peening process and the in turn the material response.
In the following section, first the peening process is expounded. The proposed SP numerical
model for the analysis of the shot stream in DEM and single shot impact analysis run by FEM
are discussed next. A section describing the obtained results is followed by conclusions.
2. Shot Peening numerical model
2.1 Discrete element modelling of a shot stream
The Discrete Element Method (DEM) records the motion of each single particle and its
interaction with other particles and surfaces using Newton’s laws of motion. The state of the
system is updated incrementally, at short time intervals using explicit time integration based
on a leap-frog central difference scheme. At every time step, particle accelerations, velocities
and positions are calculated. Contact mechanics laws relate the inter-particle elastic force
Damping is employed at contacts in order to account for the loss of kinetic energy during shot
interaction.
The contact law
Shots are modelled as elastic isotropic bodies. The Hertz-Mindlin non-slip contact law was
employed to model the shot-shot interaction and the shot-target surface interaction. The
model is based on the work of Mindlin [13] .
In the normal direction, the exact analytical solution for the pressure and therefore the
force upon the contact is given by the Hertz law. According to this law, the normal
force-displacement (N-δ) relationship is non-linear. Considering a collision between 2 particles
with elastic modulus E, Poisson’s ratio ν and radii 𝑅!and 𝑅!
F! = !!E∗ R∗ δ!
!
! (Eq. 1)
where the equivalent Young’s Modulus 𝐸∗, the equivalent radius 𝑅∗ are defined as
!
!∗=
(!!!!!)
!! +
(!!!!!)
!! (Eq. 2)
!
!∗= !
!!+
!
!! (Eq. 3)
with 𝐸!,𝑣!,𝑅! and 𝐸!,𝑣!,𝑅! being the Young’s Modulus, Poisson ratio and radius of each sphere
in contact. Additionally there is a damping force, 𝐹!!, given by:
F!!= −2 !
!β S!m∗𝑣! (Eq. 4)
where 𝑚∗ = !! !+
! !!
!!
is the equivalent mass, 𝑣! is the normal component of the relative
𝛽= !!!"!!!!!! (Eq. 5)
S! =2E∗ R∗δ
! (Eq. 6)
where 𝑒 is the CoR.
Tangential forces
The tangential force, 𝐹!, depends on the tangential overlap 𝛿! and the tangential stiffness 𝑆!.
𝐹! =−𝑆!𝛿! (Eq. 7)
with
𝑆! =8𝐺∗ 𝑅∗𝛿! (Eq. 8)
with 𝐺∗ being the equivalent shear modulus.
! !∗=
(!!!!!) !! +
(!!!!!)
!! (Eq. 9)
Additionally, tangential damping is given by:
𝐹!!= −2 !!𝛽 𝑆!𝑚∗𝑣! (Eq. 10)
where 𝑣! is the relative tangential velocity.
As in the normal direction, we assume that the plastic dissipation can be expressed by a CoR.
However, it is important to note that dissipation can also occur due to friction. Therefore,
unlike the normal case, the contact law is made by a linear spring, a dashpot and a slider. The
CoR will be assumed equal to the normal case: 𝑒! =𝑒!. In the same way the tangential
The coefficient of restitution
Metal spheres do not behave elastically but undergo permanent deformations during
collisions at high speed, when the contact tractions exceed their elastic limits. This means that
the particle kinetic energy is dissipated by the occurrence of plastic strains and elastic wave
propagation. According to the study by Wu et al. [14], the latter phenomenon is negligible in
comparison with the energy dissipated by plastic deformations. To use a contact law
characterised by an elasto-plastic model such as those typical of continuum mechanics would
be overly complex and unaffordable from a computational point of view. As a result, the
adopted model simulates the shots interaction by approximating the energy and momentum
loss by means of the so-called coefficient of restitution.
Hertz-Mindlin law applies to purely elastic bodies whereas CoR was derived from
experiments on elasto-plastic. The approximation introduced by our law is to separate out the
elastic and plastic deformations.The relationships among the CoR, the incoming velocity, the
collision time and the contact force/displacement, were discussed in [15] and the FE analysis
agreed closely with the results produced by applying the Hertz theory. The coefficient
expresses the total amount of energy dissipated and momentum loss during an impact without
calculating the permanent local deformations undergone by the interacting surfaces. It is
defined as:
e=!!
!! (Eq. 11)
with V𝑟and 𝑉! the rebound and impact velocities respectively.
The CoR is likely to affect significantly the final CRS, therefore it should be
determined as accurately as possible for the various types of interactions. The CoR depends
on both the impact velocity, and the impact angle 𝜃! . Therefore, ideally values of 𝑒!and 𝑒!
should be experimentally determined for a set of values of 𝑉! intial velocity and 𝜃! the angle
on the history of previous collisions on the shot and plastic deformation occurred by the
component. In Table 1, experimental data about the values of the CoR for shot-surface
interaction for successive hits are reported. Keeping track of the location of each impact on
the target surface over time, it is possible to implement values of CoR in the DEM code
which change over time as a function of the number of previous impacts at the same location.
In this way, it is possible to assess the effect of an impact dependent CoR on the obtained
CRS and whether a value of the CoR averaged out of the number of collisions per spot could
[image:11.595.104.447.345.413.2]be applied instead.
Table 1: CoR for shot interaction after Bhuvaragham et al. [8].
Impact No Input velocity m/sec Rebound velocity m/sec CoR
1 100 40.27 0.396
2 100 54.04 0.540
3 100 58.28 0.583
4 100 76.31 0.763
The CoR for sphere-sphere interaction, 𝑒!!! is different from the sphere-flat plate
interaction𝑒!!!. In the absence of experimental data, 𝑒!!! = 0.4 was assumed for both normal
and tangential direction independent of the angle of impact and of the relative velocity
between colliding shots.
To assign a prescribed a viscous damping force, 𝐹!, was applied to the two shots involved in
the collision:
F!= −ηv (Eq. 12)
with 𝜂 being the damping coefficient and v the relative velocity between the two colliding
particles. The relationship here employed to work out the damping coefficient corresponding
to the desired CoR is from Tsuji et al. [16]. They numerically integrated the differential
coefficients, then evaluated the CoR as ratio between initial and final velocity to obtain the
relationship of CoR versus viscous coefficient.
𝜂 = 𝛼 𝑚𝐾!𝛿 !
! with 𝛼= !
!
!!" (!)
!" ! !!!! (Eq.13)
Model setup
3D DEM analyses were performed using the commercial discrete element code EDEM [17].
The input data for the simulations consists of: the nozzle inner diameter 𝑑! and the distance
𝑑, between nozzle and target surface, the angle between nozzle and treated surface, the
so-called angle of attack 𝜃. Spherical shots of equal size were randomly generated at the nozzle
cross section using the Particle Factory function in EDEM. The number of shots delivered
from the nozzle in a given time period is a function of the presented mass flow rate used in
the peening process. The initial velocity of the shots, 𝑉!, is a function of the air pressure of the
peening system. In this simulation a variation of 5% around the initial velocity was applied.
SP quality is determined by the generated CRS pattern within the target component derived
by the energy transfer and plastic deformation. The impact energy can be easily extracted
from the DE simulation. One way to evaluate the impact energy is to determine the velocity
of the shot just before impact. In the DEM simulation, the shots impacting on the target were
continuously monitored and recorded along with time of impact, impact position and the
components of this velocity along three coordinates are 𝑉!", 𝑉!" and 𝑉!" respectively.
Coefficient of restitution for repeated impacts
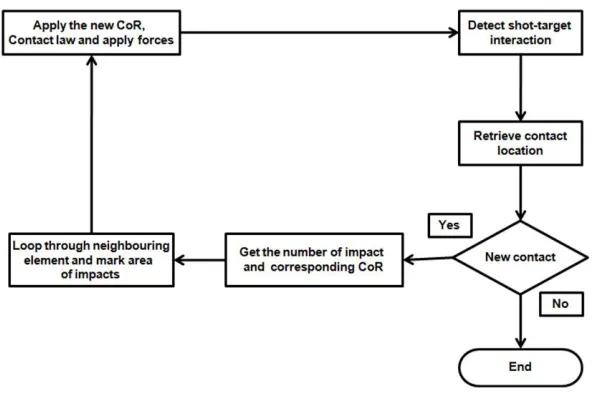
Algorithm and implementation
An algorithm to change the CoR for repeated impacts for the same location was implemented
module for every shot-shot and shot-target collision. Once a shot-target collision is detected,
the contact location of the target surface is retrieved and for every new contact the facets
falling within the predefined impact diameter is recorded. The corresponding CoR data for
the impact number is then retrieved from Table 1 and applied to compute the contact forces.
Figure 2 shows the process flow diagram. The results depend on the mesh size, the number of
impacts per geometry face and the values of the CoR data. The shot-shot, shot-target
interaction including the resulting CRS were compared and analysed for the constant CoR
case and for the case of variable CoR which progressively increases with number of impacts.
[image:13.595.77.374.330.531.2]
2.2 DEM/FEM coupling
The DEM is unable to model the plastic deformations and residual stresses induced on the
treated surface. Hence, a FE analysis is needed to determine the compressive residual stresses
of the surfaces. In our system a user Defined Library (UDL) is created within the EDEM
application to log locations and impact velocities. This information is then used to create the
Abaqus input files. Depending on the target geometry size and number of impacts, the input
file can become very large. Since running a set of programs to generate a computable FE
input from the DEM output can be very time consuming, we implemented an algorithm to
generate the Abaqus input files within the DEM code.
In the simulation, the DEM application uses a coarse mesh while the FEM analyses
require a finer mesh to capture the CRS. This would require the coupling algorithm to match
the meshes in DEM and FEM according to the impact location. Previously, Baskaran et al.
[9] coupled DEM and FEM by recording the forces, location and indentation information to
apply the equivalent pressure to retrieve the CRS. They retrieved the indentation information
from simulations of single shot impacts. The circular pressure zone was modelled as an
octagonal zone to follow the mesh pattern. However, in this study shots were assumed to
impact the target surface in the normal direction only. Hence, this method is unable to
replicate the different indentations produced by shots impacting the treated surface at
different angles. Moreover, the subsequent shots impacting the intended area will rebound
differently.
In our approach instead, the shots are modelled in FEM as rigid particles and placed
right above the location recorded in DEM. A new step is created with initial conditions using
the shot impact velocity from DEM. In the next step, the impact is performed and excluded in
future steps. In this way, we retrieve the exact indentation for different shots sizes impacting
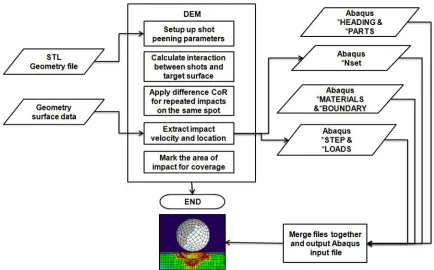
there is no need to employ the same mesh for the DEM and FEM analyses. Figure 3
illustrates the algorithm via a flow diagram detailing the coupling between the DEM code
EDEM and the FEM code Abaqus [16,17]. The coupling can be outlined in the following
steps:
1. The *.stl geometry file is loaded into Abaqus and the material properties are selected. The
input file is created and separated into dynamic and static parts. These are parts of the
main input file that need to be populated and parts of the file that will remain unchanged
regardless of the number of impacts, location etc. The main input file is divided into four
separate files. The dynamic parts are discarded and the static parts are saved to be used
later in step 6.
2. The same *.stl file is loaded into the commercial EDEM program along with a file
containing the geometry surface data from FEM.
3. The SP model is set up with the individual peening parameters.
4. The DEM SP simulation is run, applying the CoR for repeated impacts. For each new
shot-target contact the impact location and velocity are recorded.
5. When the simulation ends, two separate files are created containing the *Nset, *Step and
*Loads parts of the Abaqus file. Impacts that are further away from each other are
grouped together and are computed simultaneously in the same time step. This reduces
the computation time and the output size of the file.
6. The two output files created from the EDEM simulations are then merged together with
the two files from step one to generate the main Abaqus input file.
3. Results
3.1 Discrete element modelling of shot stream
3.1.1 Effect of peening parameters
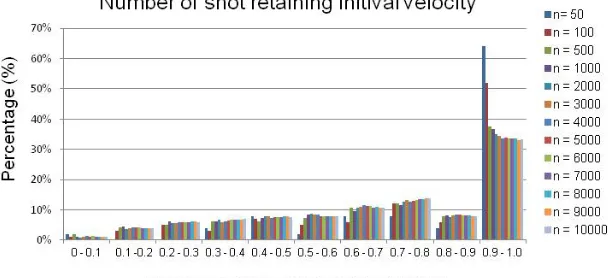
First, the number of impacts after which the system reaches a steady sate was investigated.
Impact velocities just before the shot-target collision were recorded and analysed. Figure 4
shows the distribution of normalised impact velocities for the considered reference case: mass
flow rate 𝑟!= 9.25 m/s, initial velocity 𝑣!"#= 75 m/s, angle of attack 𝜃 = 67.5°, distance 𝑑=
20mm and shot diameter 𝑑!!!" = 0.58mm. These parameters were adopted from Hong et al.
[8]. It emerges that in the first 50 impacts about 64% of shots hitting the target surface with a
velocity within 10% from the initial velocity (𝑣!"#=0.9𝑣! ~ 1.0𝑣!). This indicates that these
shots had only little or no interaction with other shots before hitting the target surface. The
remaining 36% of shots (18 shots) had energy dissipation due to interaction with others shots.
Steady state is reached after an initial period of 4000 impacts, with 33.65% of impacts hitting
the surface with initial velocity. The longest transient state occurs with the highest mass flow
rate of 13 kg/min and lowest initial velocity 50 m/s and angle of attack 𝜃 = 90° and distance
d= 20 mm. Since the steady state is reached after 4000 impacts, the impact number of 10 000
can be taken as the steady state for all combination of parameters used in this study.
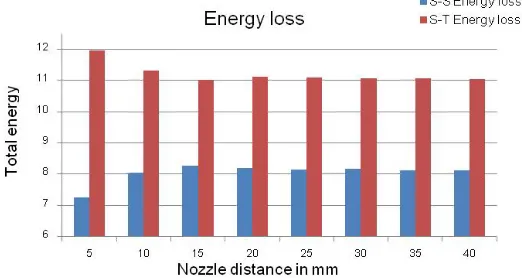
[image:17.595.86.390.562.701.2]3.1.2 Effect of nozzle distance
Next, the effect of the distance between the nozzle and target surface was investigated.
Distances ranking from 5mm to 30 mm were investigated. Figure 5 shows the total number of
interactions for different distances 𝑑. Figure 6 shows the total energy loss for different
distances 𝑑. The effect of distance on the peening quality was not found to be significant
when 𝑑 greater than 20 mm is employed and shot diameter is 0.58 mm and therefore 20 mm
was chosen as the peening distance between nozzle and component.
[image:18.595.80.333.317.465.2]
Figure 5:Number of shot-shot and shot-target collisions for different Nozzle distance d.
[image:18.595.81.342.549.689.2]
3.1.3 Effect of mass flow and initial velocity
A matrix simulation covering various mass flow rates and initial velocities was carried out
next. Table 2 shows the different parameters for different mass flow rates. For simplicity a
dimensionless flow rate parameter 𝜺 is introduced: !!!∗ !!" !∗ !!!!" .
where 𝑟! is the mass flow rate of the nozzle, 𝑑!" the average particle diameter, 𝑣! initial
velocity and 𝑚!!!" the shot mass.
Figure 7 shows the number of shot-shot and shot-target interactions for the different initial
velocities. It can be concluded that the number of shot-shot and shot-target interaction
increases with lower initial velocity. Compared to the shot-target collisions, the shot-shot
interactions nearly doubles from 75 m/s to 200 m/s.
[image:19.595.77.381.393.544.2]
Figure 7: Shows the number of shot-shot and shot-target interactions at different initial velocities.
The effect of mass flow rate and initial velocity on the distribution of normalised impact
velocity for 𝜃 =90° and 𝜃 = 62.5° was investigated next. Figure 8 shows the percentage of
shot retaining their normalised initial velocity higher than 90% for different mass flow rate
For a lower 𝜀 value, more shots hit the surface with initial velocity than in the simulation with
a higher value 𝜀 . The key parameters r!= 5.5, 𝜃 = 62.5° and V!=100 m/s corresponds to
the lowest value of 𝜀 = 0.667where at which point about 56% of impacts maintained their
initial velocity at impact (𝑣!"#= 0.9𝑣! ~ 1.0𝑣!). This indicates that the shots had little or no
energy dissipation from the nozzle to the surface. Figure 9 confirms that for a lowest value of
𝜀, case H9, the energy loss due to shot-target interaction is the lowest.
The lowest percentage of normalised impact velocity was encountered with the highest value
𝜀= 3.154, corresponding to case H1 with the mass flow rate r!= 13 and 𝑣! =50 m/s where
only 3.89% of shots maintained their initial velocity.
Highest energy loss was encountered in case H7, corresponding to r!= 9.25 and V! =
100 m/s . The second highest was H4 with parameters s r!= 13 and V!= 100 m/s. This
indicates that velocity is an important factor for shot-target energy dissipation.
Figure 8: Shows percentage of shot retaining their normalised initial velocity higher than 90% for different mass flow rate and initial velocity.
[image:20.595.79.301.428.543.2][image:20.595.79.282.600.710.2]
In can be concluded that with a higher mass flow rate 𝑟! the energy dissipation increases due
to the large number of shot-shot interactions. A lower mass is therefore more suitable for the
peening process with smaller shot-shot interactions associated with lower energy dissipation.
With a lower initial velocity the shots do not move quickly enough and the likelihood of
interactions with rebounding shots increases. With a much higher initial velocity the shots
move quicker and the probability of interactions between the shots decreases. Lower mass
flow rate implies less energy dissipation for shot interaction but also less transferred energy.
However this could be countered by longer peening time. The optimal combination depends
on the cost of peening time and how the industry chooses this parameter.
Looking at results from 𝜃 =90° and 𝜃= 62.5° it can be concluded that the angle of attack
has a significant influence on the outcome. Hence, the angle of attack needs to be
investigated next.
Table 2: Different parameter values for different mass flow rates and velocities and their corresponding after Hong et al. [7].
No 1 2 3 4 5 6 7 8 9
𝜺 3.154 2.244 2.103 1.577 1.496 1.334 1.122 0.890 0.667
𝒓𝒎kg/min 13 9.25 13 13 9.25 5.5 9.25 5.5 5.5
𝑽𝒐m/s 50 50 75 100 75 50 100 75 100
3.1.4 Effect of angle of attack
The effect of angle of attack was investigated with the following parameters; mass flow rate
𝑟!= 9.25 m/s, initial velocity 𝑣!= 100 m/s, distance 𝑑 = 20mm and shot diameter 𝑑!!!" =
0.58mm. Figure 10 shows the percentage of shots retaining their initial velocity for different
angles of attack, where impact velocity is 90-100% of initial velocity. Analysing the velocity
at impact, for 𝜃 =35°, about 74% of shot retained their initial velocity and had fewer
interactions between shots. Shot-shot interactions increased significantly when 𝜃 =90° and
rebounding shots coinciding with incoming shots. The percentage of shots retaining their
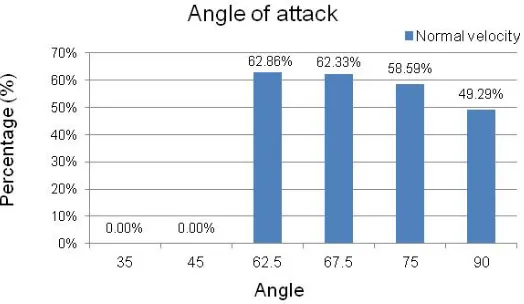
initial velocity decreases with the angle of attack increasing. To measure CRS, the normal
impact velocity is more significant than the tangential component. Figure 11 shows the effect
of angle of attack on the percentage of particles retraining their normal impact velocity (𝑣!=
100 m/s). Looking at the normal impact velocity it can be shown that θ=62.5° provides the
highest percentage of shots retaining initial velocity at impact (62.83%). No shots retraining
their normal impact velocity when θ<45°. This is a useful information for the industry
providing the target inclination for the process.
Figure 10:Effect of angle of attack on the percentage of particles maintaining their initial velocity at impact.
[image:22.595.90.353.309.471.2]
[image:22.595.91.353.570.722.2]
3.1.5 Effect of shot diameters
The distribution of impact velocities for differ shot diameters was examined. Specially, five
different shot diameters 𝑑!!!"= 0.4, 0.58, 0.75, 1.0 and 1.5 mm with the process parameters
𝑟!= 9.25 kg/min,𝑣!= 75 m/s, θ=62.5° and 𝑑 = 20 mm were studied. The total mass and
mass flow rate are kept constant such that when the shot size is decreased, the overall peening
time is increased. Figure 12 shows the number of shots per second delivered from the nozzle
for the different shot diameters. For 𝑑!!!"= 0.4 mm a high number of shots (590, 000) are
delivered from the nozzle compared to 11, 200 shots for 𝑑!!!"= 1.5 mm. The shot-shot
collision decreased almost linearly for 𝑑!!!"= 0.4 mm (18, 057) towards 𝑑!!!"= 1.5 mm (2,
174). Figure 13 shows the shot-shot and shot-target interaction numbers for the different shot
diameters.
[image:23.595.83.311.403.514.2]
Figure 12: Number of shots delivered per second vs. shot diameter.
[image:23.595.78.305.579.716.2]
3.1.6 Effect of changing the CoR for subsequent impacts
CoR and the energy dissipation for shot-target interaction with changing CoR. In practice the
region of influence will depend on the impact velocity, angle of impact and the shot size. The
indentation area is affected by shot size, the impact velocity (the higher the velocity the larger
the dimple) and the angle of impingement (an oblique angle generates an elliptical dimple).
For simplicity, the region of influence was chosen as the average shot diameter (0.58mm).
When applying the CoR dynamically the energy dissipation decreases with the increase of
indentation radius. Table 3 shows the results for constant and variable CoR for 10,000
impacts. A target location that is being hit for the first time has a low CoR, resulting in high
energy dissipation. The next shot hitting a location that was hit previously and plastically
deformed the target surface has a higher CoR, resulting in lower energy dissipation.
Subsequent shots hitting the target surface will rebound with a higher velocity than the first
shot and retaining more of their kinetic energy. Figure 14 shows the energy dissipation for
shot-target with a constant CoR 0.4 and the energy dissipation for shot-target interaction with
changing the CoR for the case with indentation radius 0.58 mm.
[image:24.595.88.352.509.666.2]
Results show that shot-shot interaction decreases and shot-target interaction number
increases. More importantly the average normal velocity at impact increases, which is
important for the generation of compressive residual stress. Changing the CoR for repeated
[image:25.595.97.503.233.339.2]impacts will result in a more intense compressive residual stress distribution.
Table 3: Shows the results for indentation radius 𝑑!!!".
Constant CoR Variable CoR with indentation radius 0.58
Shot-Shot collision 6485 5912
Shot-Target collision 13959 15615
Total Energy Loss through
Shot-target collision in J 21.99 13.1993
Average velocity at impact in m/s 78.29 79.3572
Average normal velocity at impact in m/s 62.38 63.7258
3.1.7 Coverage
Coverage is defined as the percentage of a given surface that is obliterated by dents or
dimples. Coverage beyond 100% is referred to as full coverage or multiples of time to
achieve 100% coverage. However, in practice, the size of impressions will vary due to the
shot size variation, shot velocity, impact angle and peened material properties. The current
model only considers the shot size. Other relevant parameters can be assigned as a function
taking into account a more realistic size of indentation.
The imported target geometries consist of a triangular mesh. The UDL implemented within
the DE application counts the number of impacts for every single mesh element, providing a
rapid way to analyse the individual peening parameters and peening quality. Visualizing the
impact location in the DE simulation can give a good indication of the peening coverage.
Figure 15 and Figure 16show the shot impact location in DEM. Surface location coloured in
particular location can be extracted and analysed in more detail. This allows analysing SP
processes with multiple nozzles and complex geometries to comprehend more complex
[image:26.595.73.301.182.362.2]conditions.
Figure 15: Show the peening process of turbine rotor.
[image:26.595.78.296.439.618.2]
3.2. FEM analysis
3.2.1. Single shot analysis
The three-dimensional FE model was developed to investigate single shot impacts on the
circular plate. A comparison was made with the numerical study of Meguid et al. [6] and
Hong et al. [8] . The circular plate was given the following geometric properties; 𝑅 =
4𝑑!!!", height 𝐻 =3𝑑!!!" where 𝑑!!!" is the shot diameter, mass density = 7800 kg/m3,
elastic modulus 𝐸 = 200 GPa, initial yield stress 𝜎 = 600 MPa and linear strain hardening
parameter 𝐻! = 800 MPa. The plate was retrained against all displacements and rotations on
the bottom end and was modelled using eight-node linear brick elements with reduced
integration (C3D8R) with element size 0.05𝑑!!!" x 0.05𝑑!!!" x 0.05𝑑!!!". The shot was
modelled as rigid sphere with a mass positioned at its centre. The diameter of the shot was
𝑑!!!" = 1 mm and mass 𝑚!!!" = 4.085 mg. Additionally, coulomb law with friction µ = 0.25
was applied during the contact. The results are plotted in a normalized manner with the
residual stress 𝜎!! normalized with 𝜎! the initial yield stress of the component. The stresses
distribution plotted with the normalized deformed depth along the centre line of the
component. Figure 17 shows the material model and Figure 18 shows three-dimensional
finite element mesh. Numerical validation of single shot impact with Meguid et al. [6] is
shown on Figure 19.
Figure 18: The three-dimensional finite element mesh in Abaqus.
Figure 19: Validation of single shot impact with Meguid et al.[5].
3.3 DEM/FEM coupled analysis
A number of coupled analyses were performed with 4000 shots impacting a flat surface. The
plate was given the following 5mm x 5mm x 3mm, mass density = 7800 kg/m3, elastic
modulus 𝐸 = 200 GPa, initial yield stress 𝜎 = 600 MPa and linear strain hardening parameter
𝐻! = 800 MPa. All displacements and rotations of the plate bottom were restrained. The
diameter of the shot was 𝑑!!!" = 1 mm and mass 𝑚!!!" = 4.085 mg. A friction coefficient of
μ = 0.25 was applied during the contact. The CRS distribution over time was measured at the
midpoint of the flat surface to evaluate the saturation time. Figure 20 the dimensional finite
[image:28.595.81.346.310.439.2]Analyses were performed to evaluate the minimum area size required to be modelled to
retrieve the true residual stresses. Three different simulations were performed to evaluate the
effect of standard, average and variable CoR in DEM on the resulting CRS in FEM. Further a
coupled analysis was performed to access the effect of the peening angle on the resulting
CRS and the influence of mass flow rate and velocity on CRS. Figure 20 shows the coupled
[image:29.595.75.240.238.396.2]analysis in FEM.
Figure 20: The three dimensional finite element numerical simulation model of the multi shot impact in Abaqus.
3.3.1 Minimum simulation domain
Analyses were performed to evaluate the size of the area required to be modelled to retrieve
the true residual stresses. The impact area diameter were defined as 1 x R, 2 x R, 3 x R and 4 x
R from the midpoint where R is the radius of the shot. Figure 21 shows the minimum area 3 x
R.
[image:29.595.76.330.589.695.2]The CRS is measured at the midpoint and at 3 different points ( Midpoint (0,0,0), point1
(0.1,0,0.1) and point2 (-0.1,0,-0.1) and point3 (0.1,0,-0.1) around the midpoint. The three
measurement points lie within the distance of the smallest minimum area 1 X R. The plastic
strain generated by the high velocity impacts of the shots varies on the surface layer. Since
the surface residual compression progressively relaxed with increased SP coverage condition
[19], the depth of the CRS layer is consider as the suitable factor to be considered for the
different cases. To determine a precise CRS state of the peened material, an average CRS is
determined from the four measurements. Figure 22 and Figure 23 show the CRS resulting
from analysing different area from the same simulation for peening angle θ = 90° and 35°.
Evaluating the CRS for different area, it can be noted that the depth of the compressive zone
only changes very little when the peening area is greater than 3 x R. The compressive stress
at the surface layer various for the different areas. Table 4 shows the depth of the CRS zone
[image:30.595.80.353.477.624.2]for different impact area.
Figure 23: Shows the CRS resulting from analysing different area from the same simulation for peening angle 35°.
Table 4: Shows the depth of the CRS zone for different impact area.
Impact Area 1 R 2 R 3 R 4 R
Number of impacts 2 12 35 66
Depth of CRS Zone 0.80mm 0.92mm 0.91mm 0.93mm
3.3.2 Effect of COR
Three different simulations were performed to evaluate the effect of standard (0.4), average
(0.57) and variable CoR in DEM on the resulting CRS in FEM. Only little variation of the
depth of the compressive zone was encountered in the different simulations. Figure 24 shows
the effect of CoR in DEM on the CRS in FEM. Table 5 shows the depth of the CRS zone for
different CoR in FEM.
[image:31.595.145.447.380.444.2][image:32.595.79.314.79.206.2]
Figure 24: Shows the effect of CoR in DEM on the CRS in FEM.
Table 5: Shows the depth of the CRS zone for different CoR in FEM
0.4 0.57 (Table 1) Variable
No. Impacts 35 38 29 Depth of CRS Zone 0.896 0.922mm 0.882mm
3.3.3 Peening angle
Coupled analyses were performed to investigate the effect of peening angle on CRS.
Simulations were performed with the peening angle θ= 90°,75°,67.5°,62.5°,45° and 35°.
The peening angle θ has an effect of the coverage. A lower penning angle will cover a larger
area than peening the component at angle θ= 90°. Figure 25 shows the impact location for
different peening angles in DEM. CRS results in Figure 26 show that the CRS zone is large
when the angle θ = 75° and 90°. Table 6 shows the depth of the CRS zone for different
Figure 25: Shows the impact location for peening angle in DEM, θ=35°,45°, 62.5°, 67.5°, 75° and 90°.
[image:33.595.80.349.314.468.2]
Figure 26: Shows the effect of peening angle on the CRS.
Table 6: Shows the depth of the CRS zone for different peening angle.
Angle 35° 45° 62.5° 67.5° 75° 90° No. Impacts 20 30 36 44 40 35 Depth of CRS
Zone 0.54 mm 0.59 mm 0.76 mm 0.70 mm 1 mm 0.9mm
3.3.4 Influence of mass flow rate and velocity on CRS
The DEM analyses have shown that for a lower value of 𝜀 more shots retain their initial
[image:33.595.73.527.548.605.2]shot-target interactions and the number of impacts increases when 𝜺 increases. When peening with
a lower mass flow rate and lower initial velocity, the shots are delivery more precisely onto
the surface. The resulting CRS are analysed for the nine different cases and shown in Figure
27. Analysing the resulting CRS graphs for the nine different cases show that for the case
where ε is small the CRS zone is the largest and the CRS zone is small when 𝜀 is large.
Results also show that when using a higher initial velocity like in cases H4, H7 and H9 the
CRS zone is deeper than in cases where a lower initial velocity is applied such as in case H1,
H2 and H6. Table 7 shows the number of impacts for area 3 x R for different values of 𝜺
adopted from Table 2 and corresponding depth of CRS zone.
[image:34.595.81.361.353.491.2]Figure 27: Shows the influence of mass flow rate and velocity on CRS.
Table 7: Number of impacts for area 3 x R for different values of 𝜺 adopted from table 3 and corresponding depth of CRS zone.
No 1 2 3 4 5 6 7 8 9
𝜺 3.154 2.244 2.103 1.577 1.496 1.334 1.122 0.890 0.667
𝒓𝒎kg/min 13 9.25 13 13 9.25 5.5 9.25 5.5 5.5
𝑽𝒐m/s 50 50 75 100 75 50 100 75 100
Impacts 48 49 48 37 40 35 31 29 33
Depth of CRS
4. Conclusions
A new computational framework for SP processes based on both the discrete element and the
finite element methods has been presented. The introduced framework allowed to run an
extensive parametric analysis of the influence of the several mechanical parameters involved
in the SP process. Visualizing the shot impact locations in DEM can help to investigate the
coverage build-up when peening a mechanical component of complex geometry with very
little computational effort: for instance a simulation with 10 000 impacts can be simulated in
only a few minutes on a single computer with an Intel i7 870 processor (4 cores) with 8 MB
cache and 16 GB of memory running Linux CentOS.
The current model can be used to analyze the shot flow and assist in improving current nozzle
designs and develop new ones. In the DEM simulations, the shot flow reached steady state
after 4000 impacts with the parameters used in this study. From the parametric analyses it
emerged that the air pressure in the nozzle (𝑣!) is the most important factor, followed by the
mass flow rate 𝑟! and the duration of the peening process.
The new DEM-FEM coupling proposed in this paper provides a convenient way to
couple the commercial DEM and FEM applications. A routine manages the interface between
EDEM and Abaqus. The EDEM application generates an Abaqus input file, which is then
used to analyse the treatment surface and resulting CRS. Analyses were performed to
evaluate the minimum size of the area required to be modelled to retrieve the true residual
stresses, which was found to be 3 x R where R is the radius of the shot.
Investigating the angle of attack and the normal impact velocity, it emerged that the
normal impact velocity can be quite large and in some cases up to 60% of the initial velocity.
For the cases considered considered in this study, the optimal angle of attack in DEM was
found to be θ= 62.5°. However analyzing the peening angle in the combined analysis
A novel algorithm was implemented to change the CoR for repeated impacts
accounting for work hardening and the impact area. Results showed that changing the CoR
decreases the number of shot-shot collisions and increases shot-target collisions. The average
impact velocity increases compared to the case where the CoR of first impact or the average
of the CoRs of successive impacts is employed. Instead only a very small variation in CRS
was encountered in the different cases. A higher number of impacts resulted in a deeper CRS
zone.
Energy transfer per unit time is a significant factor that has to be evaluated. Similar
amounts of energy can be transferred onto the target surface using different peening
parameters in short time. It was found that for a higher mass flow rate and lower initial
velocity fewer shots retain their initial velocity at impact but the number of impacts is larger.
Results from the coupled analysis showed that the initial velocity is more important than the
mass flow rate and that when the initial velocity is high (100 m/s) the CRS depth zone is
deeper than in the cases where a lower velocity was used. However, a relation between CRS
and mass flow rate could not be established.
The existing computational SP model can be adopted such that Almen strips can be
virtually placed onto the peening component. Future work will investigate the peening of
more complex geometries with curved surfaces and edges, where Almen strips cannot be
used during the peening process. Using the proposed computational model it will be then
possible to predict the percentage of coverage and Almen intensity reducing the need for
expensive experimental testing.
Acknowledgements
References
[1] A.Niku-Lari, “An overview of Shot Peening,” Intl Conf Shot Peen. Blast Clean.,
pp. 1–25, 1996.
[2] J. O. Almen and P. H. Black, Residual Stresses and Fatigue in Metals. New
York: McGraw-Hill, 1963, p. 226.
[3] Al-Hassani S.T.S., “Mechanical aspects of residual stress development in SP,”
in International Conference on Shot Peening - 1, 1981, pp. 14–17.
[4] E. Rouhaud, D. Deslaef, and S. Rasouli-Yazdi, “3D Finite Element models of
shot peening processes,” in Journal of Materials Science Forum, 2000, pp. 241–246.
[5] G. H. Majzoobi, R. Azizi, and A. Alavi Nia, “A three-dimensional simulation of
shot peening process using multiple shot impacts,” Journal of Materials Processing Technology, vol. 164–165. pp. 1226–1234, 2005.
[6] S. A. Meguid, G. Shagal, J. C. Stranart, and J. Daly, “Three-dimensional
dynamic finite element analysis of shot-peening induced residual stresses,” Finite Elem. Anal. Des., vol. 31, no. 3, pp. 179–191, 1999.
[7] K. Han, D. Peric, D. R. J. Owen, and J. Yu, “A combined finite/discrete element
simulation of shot peening processes - Part II: 3D interaction laws,” Eng. Comput., vol. 17, pp. 680–702(23), 2000.
[8] T. Hong, J. Y. Ooi, and B. Shaw, “A numerical simulation to relate the shot
peening parameters to the induced residual stresses,” Eng. Fail. Anal., vol. 15, no. 8, pp. 1097–1110, 2008.
[9] B. Bhuvaraghan, S. M. Srinivasan, Y. Potdar, D. Paul, S. A., and P. Weitzman,
“SP modeling by combining DEM and FEM,” in International Conference on Shot Peening -10, 2008, pp. 131–142.
[10] W. Cao, R. Fathallar, and L. Castex, “Correlation of Almen arc height with residual stresses in shot peening process,” Mater. Sci. Technol., vol. 2, pp. 967–973, 1995.
[11] M. Guagliano, “Relating Almen intensity to residual stresses induced by shot peening: a numerical approach,” J. Mater. Process. Technol., vol. 110, no. 3, pp. 277–286, 2001.
[12] Z. Wang, C. Jiang, X. Gan, Y. Chen, and V. Ji, “Influence of shot peening on the fatigue life of laser hardened 17-4PH steel,” Int. J. Fatigue, vol. 33, no. 4, pp. 549–556, 2011.
[14] S. X. Wu, G. Dong, and W. Zhang, “The application of technology of cleaning by blast and peening,” , China Foundry Mach. Technol, no. 2, pp. 5–7.
[15] C. Thornton, “Coefficient of Restitution for Collinear Collisions of Elastic-Perfectly Plastic Spheres,” J. Appl. Mech., vol. 64, no. 2, pp. 383–386.
[16] Y. Tsuji, T. Tanaka, and T.Ishida, “Lagrangian numerical simulation of plug flow of cohesionless particle in a horizontal pipe,” Powder Technol., vol. 71, pp. 239–250, 1992.
[17] EDEM, “EDEM 2.5 User guide.” 2013.
[18] Hibbitt Karlsson and Sorenson Inc, “ABAQUS User Manual Version 6.9.”
![Table 1: CoR for shot interaction after Bhuvaragham et al. [8].](https://thumb-us.123doks.com/thumbv2/123dok_us/9509151.456299/11.595.104.447.345.413/table-cor-shot-interaction-bhuvaragham-et-al.webp)