Original citation:
Hagmann-von Arx, Priska, Lemola, Sakari and Grob, Alexander. (2016) Does IQ = IQ? Comparability of intelligence test scores in typically developing children. Assessment. Permanent WRAP URL:
http://wrap.warwick.ac.uk/80309 Copyright and reuse:
The Warwick Research Archive Portal (WRAP) makes this work by researchers of the University of Warwick available open access under the following conditions. Copyright © and all moral rights to the version of the paper presented here belong to the individual author(s) and/or other copyright owners. To the extent reasonable and practicable the material made available in WRAP has been checked for eligibility before being made available.
Copies of full items can be used for personal research or study, educational, or not-for profit purposes without prior permission or charge. Provided that the authors, title and full bibliographic details are credited, a hyperlink and/or URL is given for the original metadata page and the content is not changed in any way.
Publisher’s statement:
‘The final, definitive version of this paper has been published in Assessment on 05/08/2016 by SAGE Publications Ltd, All rights reserved. © The Authors Published version: http://dx.doi.org/10.1177/1073191116662911 A note on versions:
The version presented here may differ from the published version or, version of record, if you wish to cite this item you are advised to consult the publisher’s version. Please see the ‘permanent WRAP URL’ above for details on accessing the published version and note that access may require a subscription.
Does IQ = IQ? Comparability of Intelligence Test Scores in Typically Developing
Children
Priska Hagmann-von Arx1, Sakari Lemola2, and Alexander Grob1
1Department of Psychology, University of Basel, Basel, Switzerland 2Department of Psychology, University of Warwick, Coventry, United Kingdom
Corresponding author:
Abstract
Numerous intelligence tests are available to psychological diagnosticians to assess children’s intelligence, but whether they yield comparable test results has been little studied. We
examined test scores of 206 typically developing children aged 6 to 11 years on five German intelligence tests (Reynolds Intellectual Assessment Scales; Snijders Oomen Nonverbal Intelligence Test; Intelligence and Development Scales; Wechsler Intelligence Scale for Children, 4th edition; Culture Fair Intelligence Test Scale 2), which were individually administered. On a sample level, the test scores showed strong correlation and little or no mean difference. These results indicate that the tests measure a similar underlying construct, which is interpreted as general intelligence. On an individual level, however, test scores significantly differed across tests for 12% to 38% of the children. Differences did not depend on which test was used but rather on unexplained error. Implications for the application of intelligence assessment in psychological practice are discussed.
Does IQ = IQ? Comparability of Intelligence Test Scores in Typically Developing Children Intelligence test scores (IQs) measured in childhood are predictive of real-life
success, including educational achievement, occupational prestige, income, and health (Batty, Deary, & Gottfredson, 2007; Deary, Strand, Smith, & Fernandes, 2007; Gottfredson & Deary, 2004; Strenze, 2007). Accordingly, in psychological practice, intelligence test scores are taken into account for school-career decisions or diagnostic classifications, such as intellectual impairment or learning disabilities (e.g., dyscalculia or dyslexia), to determine the most appropriate intervention for a child. Thus, intelligence is one of the most frequently measured constructs in psychology (Goldstein, Princiotta, & Naglieri, 2015).
al., 2008). Yet despite the variety of subtests used in different test procedures, intelligence test scores may be comparable because of the principle of aggregation (Rushton, Brainerd, & Pressley, 1983). This principle states that the sum of multiple measurements is a more stable estimator than any single measurement because errors are averaged out. Regarding
intelligence tests, aggregated subtest scores result in a composite score that reflects the general factor of intelligence (Jensen, 1998; Lubinski, 2004; Spearman, 1927).
It is generally assumed that composite intelligence test scores from different tests will be very similar for the same person, but there are reasons why this may not be the case. For example, a stratified sampling plan ensures that the assessed sample is as representative as possible of the general population according to selected demographic characteristics such as age, sex, ethnicity, educational attainment, or geographical area (Sattler, 2001)—information that is extracted from a national census. However, the intelligence tests may have sample stratifications that do not match. Another reason is related to the so-called Flynn effect, that is, the increase in average intelligence of about 3 to 5 intelligence points per decade (Flynn, 1987, 2009). As a result of this effect, people will score lower on an intelligence test using more recent norms than on a test standardized in earlier times. Finally, for tests used in psychological practice, reliability coefficients above .90 are required (Evers, 2001). Although composite intelligence test scores may meet this criterion, they still include measurement error, which can lead to unsystematically diverging test scores. In sum, there are several reasons why intelligence test scores could differ systematically (i.e., theoretical assumptions, administration format, standardization sample, year of standardization) or unsystematically (i.e., unreliability).
Previous studies have reported strong correlations between different composite intelligence test scores in typically developing children as well as in children with
Shear, Howe, & Bishop, 2014; Floyd et al., 2008; Hagmann-von Arx, Grob, Petermann, & Daseking, 2012; Hagmann-von Arx, Petermann, & Grob, 2013), indicating that different intelligence tests measure similar underlying constructs. However, these studies focused on analyses on a sample level, and less is known regarding the comparability of children’s composite intelligence test scores on an individual level. For instance, Floyd and colleagues (2008) obtained data from different samples of school-aged children and undergraduate students previously described in published test manuals and journal articles. All participants completed at least two intelligence tests standardized in English-speaking countries,
including the Differential Abilities Scales (DAS; Elliott, 1990), standardized from 1987 to 1989; the Kaufman Assessment Battery for Children (2nd ed.; K-ABC-II; Kaufman & Kaufman, 2004), standardized from 2001 to 2003; and the third (WISC-III; Wechsler, 1991) and fourth (WISC-IV; Wechsler, 2003) editions of the Wechsler Intelligence Scale for Children, standardized in 1989 and from 1998 to 2003, respectively. Results revealed that around 34% of the participants achieved composite intelligence test scores that differed from each other by more than the sum of half of each test’s 90% confidence interval, indicating that composite scores obtained on different intelligence tests given to the same participants may not be identical. Using generalizability theory analyses, Floyd and colleagues (2008) further showed that children’s test scores did not depend on which test was used but that the differences in intelligence test scores have to be interpreted as unspecific error. Finally, they showed that the generalizability of intelligence test scores based on just one test is rather low, which supports the notion that multiple measures of intelligence should be used when the stakes are high (Hagmann-von Arx et al., 2008; Meyer et al., 2001).
may achieve very discrepant test scores (i.e., on an individual level). However, as the authors focused on test procedures used in English-speaking countries standardized several years ago, it remains unknown to what extent these results can be generalized to intelligence tests currently being used in other language groups.
The goal of the present study was to compare children’s composite intelligence test scores obtained in five intelligence tests currently being used in German-speaking countries (Reynolds Intellectual Assessment Scales, RIAS; Snijders Oomen Nonverbal Intelligence Test, SON-R 6-40; Intelligence and Development Scales, IDS; WISC-IV; Culture Fair Intelligence Test Scale 2, CFT 20-R). On the sample level we expected that composite intelligence test scores obtained from the five tests would show strong correlations and that mean scores would not differ significantly from each other. On an individual level we investigated whether children obtain comparable intelligence test scores (i.e., scores within the sum of half of each test’s 90% confidence interval) on the five intelligence tests. Further, we investigated whether differences in intelligence test scores depend on which test is used, and, whether a single intelligence test score can be generalized to other intelligence test scores. Finally, we explored whether differences in intelligence test scores depend on specific test conditions, including the time interval between two tests, the order of test administration, and qualitative nominal intelligence levels.
Method Participants
children to participate and assent was obtained from the children prior to the beginning of the study.
Measures
The RIAS (Reynolds & Kamphaus, 2003) is an individually administered intelligence test that has been adapted for German-speaking countries (Hagmann-von Arx & Grob, 2014). The German RIAS was standardized from 2011 to 2012 in Germany and Switzerland for people aged 3 to 99 years. The RIAS yields a Composite Intelligence Index (CIX), which comprises two verbal and two nonverbal subtests. The verbal and nonverbal subtests were developed in close accordance with Cattell’s theory of crystallized and fluid intelligence. The RIAS takes about 20 to 25 min to administer. Reliability of the CIX is high with α =
.95.
The SON-R 6-40 (Tellegen, Laros, & Petermann, 2012) is an individually
administered nonverbal intelligence test for people aged 6 to 40 years. Standardization was carried out from 2009 to 2011 in Germany and the Netherlands. The SON-R 6-40 provides an intelligence score that is calculated from the sum of four subtests and reflects Cattell’s fluid intelligence. The test administration takes about 60 min. Reliability of SON-R 6-40
intelligence is high with α = .95.
The IDS (Grob, Meyer, & Hagmann-von Arx, 2013; Meyer, Hagmann-von Arx, Lemola, & Grob, 2010) is an individually administered test for children aged 5 to 10 years that yields a measure of intelligence and additionally provides a profile for six
Switzerland. The administration time for the seven intelligence subtests is about 45 min.
Reliability of IDS intelligence is high with α = .92.
The WISC-IV (Wechsler, 2003) is an individually administered test to assess intellectual abilities in children and adolescents aged 6 to 16 years. The German version (Petermann & Petermann, 2011) was standardized from 2005 to 2006 in Austria, Germany, and Switzerland. The WISC-IV comprises 10 core subtests that are combined to form four index scores (verbal comprehension, perceptual reasoning, working memory, processing speed) and the Full Scale IQ (FSIQ). Additionally, there are five supplemental subtests, which were not administered in the current study. The administration time for the core subtests takes approximately 60 to 80 min. Reliability of the FSIQ is high with .97.
Cattell’s (1960) CFT is a measure of nonverbal, fluid intelligence. The German adaptation of CFT Scale 2 (CFT 20-R; Weiss, 2006) was standardized in 2003 on people aged 8.5 to 19 years in Germany. The CFT 20-R consists of two parallel parts with four subtests each. For the current study the whole test was administered, which takes about 50
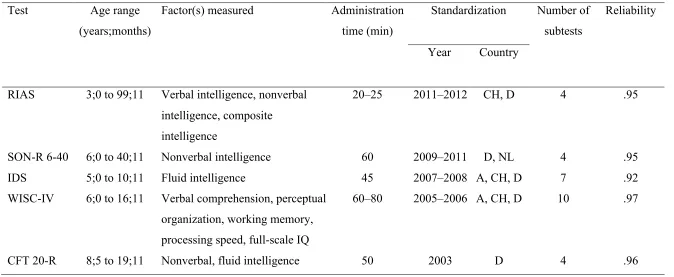
min. Reliability of the CFT 20-R intelligence score is high with α = .96. Table 1 presents a
summary of the characteristics of the German intelligence tests used in the current study.
Insert Table 1 about here
Procedure
(M = 16 days, SD = 14 days). A few children could attend only two testing sessions, leading to slightly different sample sizes for each intelligence test (nRIAS = 204, nSON-R 6-40 = 202, nIDS = 206, nWISC-IV = 206, nCFT 20-R = 142). After the study was completed, parents received a written report on their child’s test results. If parents had questions or concerns regarding the test results, they were invited to consult with an experienced child psychologist without charge.
Data Analyses
Statistical analyses were based on composite intelligence test scores standardized with M = 100 and SD = 15. To test the assumptions of normality we used the Shapiro–Wilk test. The scores of the RIAS, SON-R 6-40, IDS, and WISC-IV were normally distributed (W = 0.985 to 0.990; p > .05), whereas the distribution of the CFT 20-R scores was statistically different from normal (W = 0.976, p = .015). To enable direct comparisons of the CFT 20-R scores with those obtained in the other intelligence tests we did not normalize data but used nonparametric statistical methods. On the sample level, sample t tests and single-sample Wilcoxon signed-rank tests were used to analyze whether the single-sample means were different from the population mean (M = 100). Further, Pearson product-moment
correlations and Spearman rank-order correlations were computed for each pair of intelligence test scores. Additionally, the correlations were corrected for range restriction due to restricted standard deviations in the present sample compared to the standardization samples (SD = 15) based on the formula proposed by Alexander, Carson, Alliger, and Carr (1987, p. 312). Furthermore, disattenuated correlations were calculated to control for
scores. Additionally, effect sizes (Cohen’s d) were calculated as the mean difference in intelligence test scores divided by the standard deviation of the difference scores.
On the individual level, comparability of the intelligence test scores was assessed using the 90% confidence intervals plotted around the obtained intelligence test scores. The confidence interval for each test was determined using the reliability coefficients presented in Table 1. Then to compare the scores on two tests, we computed the sum of half of each test’s 90% confidence interval. Test scores were considered comparable if the difference between intelligence test scores for an individual was less than that sum, as proposed by Floyd et al. (2008). Additionally, we categorized the intelligence test scores in qualitative nominal intelligence levels using the following verbal categories: <70 = lower extreme, 70– 84 = below average, 85–115 = average, 116–130 = above average, >130 = upper extreme (Grob et al., 2013). We assessed the percentage of participants who scored on the same qualitative nominal intelligence level in two tests. Further, we computed the 90% confidence interval of each intelligence test score and assessed the percentage of participants with overlapping 90% confidence intervals. In addition, we calculated the percentage of
participants who scored on the same qualitative nominal intelligence level when considering both levels if the 90% confidence interval spanned two levels (e.g., above average to
average).
variance attributed to the interaction between people and test batteries, which is defined as unexplained error. Furthermore, to assess the extent to which a single intelligence test score can be generalized to other intelligence test scores, we conducted a decision study. For this, we calculated G coefficients, which can be interpreted in a similar way to coefficient alphas (Brennan, 1983). On the basis of the G coefficients we decided how many intelligence tests were required to have a reliable estimate (G > .90) of general intelligence.
Finally, using linear regressions, we explored whether differences in intelligence test scores depend on the time interval between two tests, the order of test administration, and qualitative nominal intelligence levels. The time interval between two tests was included as a continuous predictor variable in the regression model. The order of test administration was treated as a three-level categorical variable (i.e., test conducted first, test conducted in the middle of the study, test conducted last) with two dummy variables included in the regression model. Children’s overall mean intelligence test score was calculated from all intelligence test scores available and categorized using the above-mentioned qualitative nominal intelligence levels. Because of small sample sizes in both extreme levels (lower extreme = 0, upper extreme = 1), these two categories were excluded from further analyses. Thus, the qualitative nominal intelligence level was treated as a three-category variable (i.e., below average, average, above average) with two dummy variables included in the
regression model. Statistical analyses were carried out using SPSS Statistics 22 for Apple Mac. Regarding generalizability theory, the G1 program for SPSS was used to estimate the variance components and to calculate the G coefficients (Mushquash & O’Connor, 2006).
Results
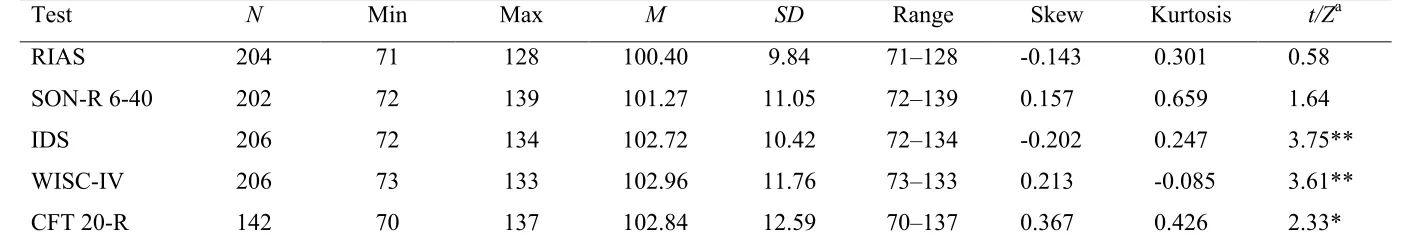
< .001), WISC-IV (M = 102.96, t = 3.61, p < .001), and CFT 20-R (M = 102.84, t = 2.69, p < .008). Compared to the standard deviation in the standardization samples (SD = 15), the standard deviations were restricted for all intelligence test scores with SD = 9.84 to 12.59.
Insert Table 2 about here
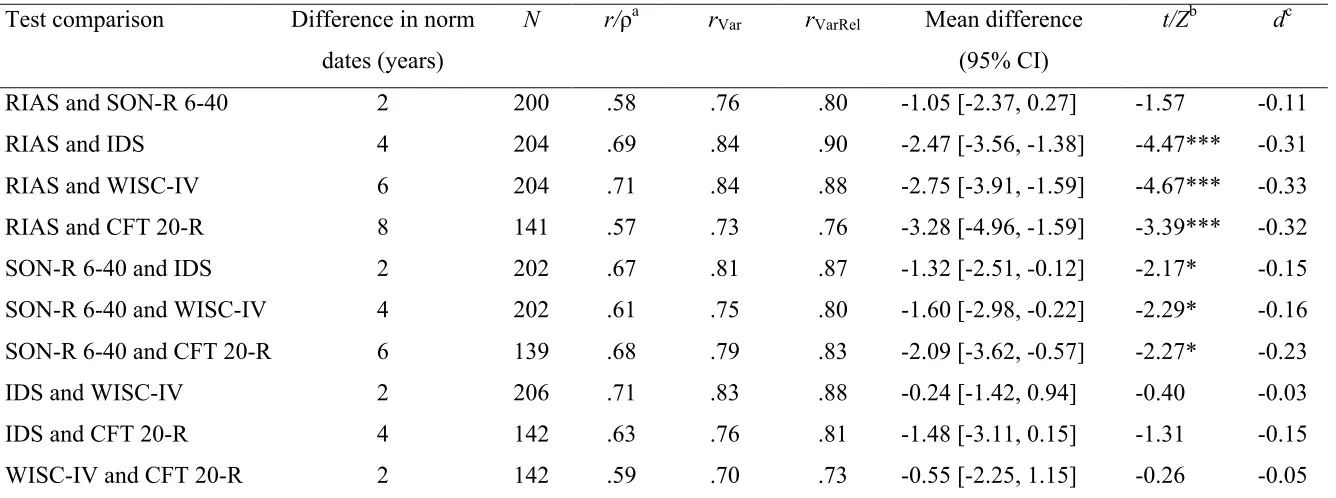
Pearson product-moment correlation coefficients and Spearman rank-order
correlations corrected for range restriction showed strong correlations between composite intelligence test scores ranging from .70 to .84 (all ps < .001). Correlation coefficients increased to .73 to .90 (all ps < .001) when we additionally controlled for unreliability of the intelligence test scores (see Table 3).
Insert Table 3 about here
Further, paired-sample t tests and Wilcoxon tests showed that children achieved slightly lower scores on the RIAS and SON-R 6-40 compared to the IDS (t = -4.47, p < .001; d = -0.31; t = -2.17, p < .05; d = -0.15), WISC-IV (t = -4.67, p < .001; d = -0.33; t = -2.29, p < .05; d = 0.16), and CFT 20R (Z = 3.39, p < .001; d = 0.32; Z = 2.27, p < .05; d = -0.23), whereas mean composite intelligence test scores on the IDS, WISC-IV, and CFT 20-R were not significantly different from each other.
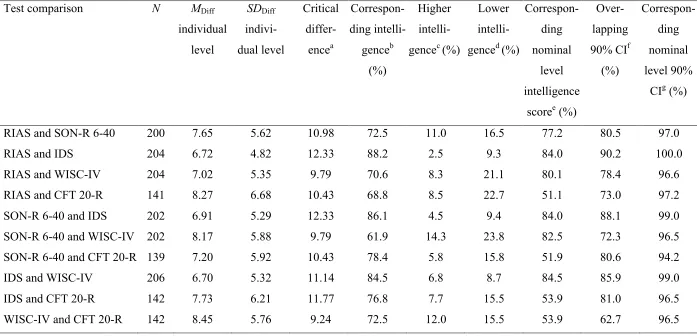
(SON-R 6-40 and WISC-IV) of the children achieved composite intelligence test scores that differed by more than the sum of half of each test’s 90% confidence interval. Of these children, 3% to 14% scored higher and 9% to 24% scored lower on the more recently standardized intelligence test. The comparability of intelligence test scores with respect to qualitative nominal intelligence levels was slightly better with 16% to 23% of the children achieving intelligence test scores on differing levels. Exceptions were test comparisons including the CFT 20-R, which showed lower comparability with 46% to 49% of the
children achieving intelligence test scores on differing levels. The percentage of participants without overlapping 90% confidence intervals ranged from 10% (RIAS and IDS) to 37% (WISC-IV and CFT 20-R). For each test comparison the percentage of children who achieved scores on differing qualitative nominal intelligence levels decreased to fewer than 10% when considering both nominal levels if the 90% confidence interval spanned two levels.
Insert Table 4 about here
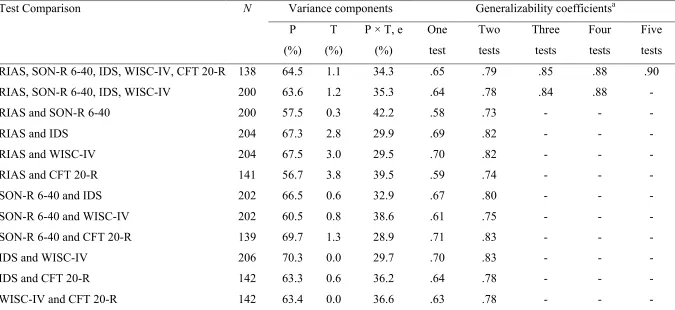
To analyze whether these differences in intelligence test scores depend on which test is used, we conducted generalizability theory analyses. Results, shown in Table 5, revealed that the test procedures accounted for no more than 4% of the variance in the intelligence test scores (T = 0.0 to 3.8%) and that most of the variance was due to unspecific error (P × T = 28.9% to 42.2%).
Further, we assessed the extent to which a single intelligence test score can be generalized to other intelligence test scores. The decision study revealed that the G
coefficients were between .58 and .70 when we used only one test, between .73 and .83 with two tests, and between .84 and .88 with three or four tests. The G coefficient reached the .90 criterion only when all five intelligence tests were used.
Finally, we performed linear regression analyses to explore whether differences in intelligence test scores depend on specific test conditions. As seen in Table 6, there were no significant associations between intelligence test score differences and test session intervals (β = -.04 to .12, p > .05) or order of test administration (β = -.12 to .15, p > .05). However, intelligence test score differences between the RIAS and SON-R 6-40, WISC-IV, as well as CFT 20-R were significantly associated with the qualitative nominal intelligence level such that children with a mean intelligence score in the above-average range showed higher intelligence test score differences compared to children with a lower mean intelligence score (β = .17 to .24, p < .05). Furthermore, children with a mean intelligence score in the below-average range showed higher intelligence test score differences in the SON-R 6-40 and CFT 20-R compared to children with a higher mean intelligence score (β = .19, p < .05). There were no significant associations between qualitative nominal intelligence levels and other intelligence test score differences.
Insert Table 6 about here
Discussion
will correlate strongly with each other. This is in line with previous research (e.g., Allen et al., 2014; Baum et al., 2014; Floyd et al., 2008; Hagmann-von Arx et al., 2012, 2013) and provides evidence for convergent test validity, that is, the notion that all intelligence tests seem to measure a similar construct (Neukrug & Fawcett, 2015), which is interpreted as general intelligence.
Second, we hypothesized that mean scores would not differ significantly from each other. Our results, however, revealed that children obtained lower test scores on the RIAS and SON-R 6-40 compared to the other three intelligence tests (i.e., IDS, WISC-IV, CFT 20-R). The RIAS and SON-R 6-40 are the two most recently standardized test procedures. Therefore, the significant mean differences can be interpreted in line with the Flynn effect (Flynn, 1987, 2009), which states that individuals obtain higher test scores on older intelligence tests compared to more recently standardized tests. However, the effect sizes were small, with mean differences ranging from 1 to 5 IQ points, which is in the range of the sum of half of each test’s 90% confidence interval.
On an individual level we examined whether children obtained comparable
intelligence test scores on the different intelligence tests. In line with Floyd et al.’s (2008) findings, our results showed that—depending on the two specific intelligence tests
compared—between 62% and 88% of the children obtained comparable intelligence test scores. Comparable intelligence test scores were defined as test scores falling in the sum of half of each test’s 90% confidence interval plotted around the obtained test scores, in order to take the unreliability of an intelligence test into account.
true intelligence test score is expected to fall (Neukrug & Fawcett, 2015). Regarding
diagnostic classifications that include a threshold for intelligence test scores (e.g., intellectual disability, which requires an IQ < 70), the diagnostic criterion can be considered met if any part of the confidence interval reaches the defined cut score (Sattler, 2001). When two or more intelligence tests are administered, we suggest considering the overlapping part of the 90% or 95% confidence intervals of each intelligence test score as the range in which the estimated true intelligence test score is most likely to fall. These intervals are typically included in the norm tables provided in the test manuals and do not require additional calculations, unlike the intervals that were used in this study (i.e., the sum of half of each test’s 90% confidence interval plotted around the obtained test scores). In addition, our results support the use of qualitative nominal intelligence levels such as “low average” or “low average to average” (if a confidence interval spans more than one level) to account for the unreliability in intelligence testing. Qualitative nominal intelligence levels may facilitate the understanding of intelligence test results in laity and thus may be particularly useful when explaining intelligence test scores to authorities, educators, and parents.
Depending on the particular tests that were compared, 12% to 38% of the children achieved an intelligence test score outside of the sum of half of each test’s 90% confidence interval. This percentage seems surprisingly high as the composite intelligence test score reflects an aggregation score, which is seen as a more reliable measure than a single subtest score (Rushton et al., 1983). However, the results are in line with those of Floyd and colleagues (2008), who showed that around 34% of children achieve different test scores across intelligence tests used in English-speaking countries.
used, which is also in accordance with the study conducted by Floyd and colleagues (2008). Thus, although the intelligence tests analyzed in the present study differ in their underlying theoretical assumptions and in their administration format, examiners can assume that their decision to administer a specific intelligence test does not lead to systematically higher or lower test scores. Instead, differences in intelligence test scores seem to be largely due to unspecific effects, including unexplained error and interactions between an examinee and the test situation (cf. Floyd et al., 2008). Unexplained error can lead to variability in intelligence test scores because examinees may miss test items that are within their range of ability due to failure to retrieve answers they actually know, or they may correctly solve items that are above their ability level with guessing strategies. Interactions can lead to variability in intelligence test scores because of interaction effects between examinees and temporal aspects of the testing session such as order of test administration (Hausknecht, Halpert, Di Paolo, & Moriarty Gerrard, 2007). In our study, however, intelligence test score differences were not associated with the time interval between test sessions or the order of test
administration. To further examine possible interaction effects between examinees and temporal aspects of the testing session, future studies might additionally assess motivation during the testing situation (Duckworth, Quinn, Lynam, Loeber, & Stouthamer-Loeber, 2011), the time of day (Gupta, 1991), as well as “morningness” and “eveningness” (Goldstein, Hahn, Hasher, Wiprzycka, & Zelazo, 2007).
Further, interaction effects between the examinee’s ability level and intelligence test score characteristics may be present, such as floor effects for children with intellectual disabilities or ceiling effects for gifted children. In our study we analyzed the comparability of intelligence test scores in three qualitative nominal intelligence levels (i.e., below average, average, above average). Results suggest that RIAS intelligence scores show higher
below-average or below-average intelligence level compared to children with an above-below-average
intelligence level. In contrast, SON-R 6-40 and CFT 20-R intelligence scores revealed lower comparability in children with a below-average intelligence level compared to children with higher intelligence levels.
Finally, interaction effects between characteristics of the examinees and requirements of a particular test may influence test results. For example, in children with a migration background language barriers might lead to lower performance on intelligence tests that require spoken language, whereas these children might show their full potential in intelligence tests that can be administered without the use of spoken language (e.g.,
Hagmann-von Arx et al., 2013). In psychological practice, such effects should be taken into account when administering intelligence tests to ensure that the general intelligence of an examinee is well represented by the inferences drawn from the test results.
Finally, we assessed the extent to which a single intelligence test score can be generalized to other intelligence test scores. Our results revealed that five intelligence test scores are necessary to reach the standard for a reliability coefficient of .90 (Evers, 2001). Although researchers recommend administering multiple tests when making high-stakes decisions (e.g., Hagmann-von Arx et al., 2008; Meyer et al., 2001), in psychological practice the administration of five intelligence tests is not feasible. Therefore, we agree with Floyd et al. (2008) that the criterion of .90 might be too high for dependability coefficients and that a standard of .80 might be more appropriate. Using this criterion, 5 of 10 combinations of two tests meet or exceed this standard: RIAS and IDS, RIAS and WISC-IV, SON-R 6-40 and IDS, SON-R 6-40 and CFT 20-R, and IDS and WISC-IV. Therefore, we suggest
above-average level, whereas the SON-R 6-40 and CFT 20-R should not be combined when assessing children with an expected intelligence score on the below-average level. The SON-R 6-40 and CFT 20-SON-R can be recommended for intelligence assessment, for example, in children with a speech disorder or children with a migration background because these tests can be completed without the use of spoken language (Hagmann-von Arx et al., 2008, 2013). The RIAS and WISC-IV, in turn, not only provide a composite intelligence test score but additionally allow the assessment of specific intelligence factors (e.g., verbal and nonverbal intelligence), making it possible to examine children’s intellectual strengths and weaknesses. We would like to note, though, that an intelligence profile analyses is considered less reliable and valid than the assessment of composite intelligence test scores (Livingstone, Jennings, Reynolds, & Gray, 2003; Sattler, 2001). Furthermore, demands for efficient assessment may support the application of brief intelligence tests (Reynolds & Kamphaus, 2003) such as the RIAS, which takes about 25 min to administer, although tests requiring a longer testing time, such as the WISC-IV, which takes about 60–80 min to administer, typically include more subtests and are thus considered more reliable (Kranzler & Floyd, 2013). In our study, however, the longest tests did not necessarily show the best results in all analyses. For example, although tests with a shorter administration time, such as the RIAS and IDS, showed larger mean differences compared to tests with a longer administration time, such as the SON-R 6-40 and WISC-IV, the two shorter tests showed higher correlations with each other than the two longer tests. Thus, on the basis of our study results, we can recommend not only longer intelligence tests but also shorter tests such as the RIAS and IDS for efficient and valid intelligence assessment.
other. However, as the children were all enrolled in regular primary school, study results cannot be generalized to children with disabilities and special needs. In psychological practice, it is these children in particular who are most often referred to psychological assessment and counseling. Therefore, future studies should examine the comparability of composite intelligence test scores in children with disabilities and special needs. These studies might include children with learning disabilities, such as dyslexia, children with psychiatric disorders, such as attention-deficit/hyperactivity disorder, children with different intelligence levels, such as children with intellectual disabilities or gifted children, and children with brain injury, such as stroke. Future studies might also investigate samples of different age ranges. In preschool children, for example, a lower attention span or higher initial shyness may lead to higher variability in intelligence test scores compared to school-aged children. For adult samples, in turn, difficulties in obtaining norming samples that represent the full range of individual differences in intelligence (cf. Floyd et al., 2008) may lead to less representative standardization samples and thus to less comparable intelligence test scores.
References
Alexander, R. A., Carson, K. P., Alliger, G. M., & Carr, L. (1987). Correcting doubly truncated correlations: An improved approximation for correcting the bivariate normal correlation when truncation has occurred on both variables. Educational and
Psychological Measurement, 47, 309-315. doi:10.1177/0013164487472002
Allen, D. N., Stolberg, P. C., Thaler, N. S., Sutton, G., & Mayfield, J. (2014). Validity of the RIAS for assessing children with traumatic brain injury: Sensitivity to TBI and
comparability to the WISC-III and WISC-IV. Applied Neuropsychology: Child, 3, 83-93. doi:10.1080/21622965.2012.700531
Batty, G. D., Deary, I. J., & Gottfredson, L. S. (2007). Premorbid (early life) IQ and later mortality risk: Systematic review. Annals of Epidemiology, 17, 278-288.
doi:10.1016/j.annepidem.2006.07.010
Baum, K. T., Shear, P., K., Howe, S. R., & Bishop, S. L. (2014). A comparison of WISC-IV and SB-5 intelligence scores in adolescents with autism spectrum disorder. Autism, 14, 1-10. doi:10.1177/1362361314554920
Brennan, R. K. (1983). Elements of generalizability theory. Iowa City, IA: American College Testing Program.
Briesch, A. M., Swaminathan, H., Welsh, M., & Chafouleas, S. M. (2014). Generalizability theory: A practical guide to study design, implementation, and interpretation. Journal of School Psychology, 52, 13-35. doi:10.1016/j.jsp.2013.11.008
Cattell, R. B. (1960). Culture Fair Intelligence Test (CFT). Champaign, IL: Institute for Personality and Ability Testing.
Deary, I. J., Strand, S., Smith, P., & Fernandes, C. (2007). Intelligence and educational achievement. Intelligence, 35, 13-21. doi:10.1016/j.intell.2006.02.001
Duckworth, A. L., Quinn, P. D., Lynam, D. R., Loeber, R., & Stouthamer-Loeber, M. (2011). Role of test motivation in intelligence testing. Proceedings of the National Academy of Sciences of the United States of America, 108, 7716-7720.
doi:10.1073/pnas.1018601108
Elliott, C. D. (1990). Differential Ability Scales. San Antonio, TX: Psychological Corporation.
Evers, A. (2001). Improving test quality in the Netherlands: Results of 18 years of test ratings. International Journal of Testing, 1, 137-153. doi:10.1207/S15327574IJT0102_3 Flanagan, D. P., & Harrison, P. (Eds). (2012). Contemporary intellectual assessment:
Theories, tests, and issues. New York, NY: Guilford Press.
Floyd, R. G., Clark, M. H., & Shadish, W. R. (2008). The exchangeability of IQs: Implications for professional psychology. Professional Psychology: Research and Practice, 39, 414-423. doi:10.1037/0735-7028.39.4.414
Flynn, J. R. (1987). Massive gains in 14 nations: What IQ tests really measure. Psychological Bulletin, 101, 171-191. doi:10.1037/0033-2909.101.2.171
Flynn, J. R. (2009). Requiem for nutrition as the cause of IQ gains: Raven’s gains in Britain 1938–2008. Economics and Human Biology,7, 18-27. doi:10.1016/j.ehb.2009.01.009 Goldstein, D., Hahn, C. S., Hasher, L., Wiprzycka, U. J., & Zelazo, P. D. (2007). Time of
day, intellectual performance, and behavioral problems in morning versus evening type adolescents: Is there a synchrony effect? Personality and Individual Differences, 42, 431-440. doi:10.1016/j.paid.2006.07.008
Springer. doi:10.1007/978-1-4939-1562-0
Gottfredson, L. S., & Deary, I. J. (2004). Intelligence predicts health and longevity, but why? Current Directions in Psychological Science, 13, 1-4.
doi:10.1111/j.0963-7214.2004.01301001.x
Grob, A., Meyer, C. S., & Hagmann-von Arx, P. (2013). Intelligence and Development Scales (IDS) (2nd ed.). Bern, Switzerland: Hans Huber.
Gupta, S. (1991). Effects of time of day and personality on intelligence test scores. Personality and Individual Differences, 12, 1227-1231.
doi:10.1016/0191-8869(91)90089-T
Hagmann-von Arx, P., & Grob, A. (2014). Reynolds Intellectual Assessment Scales (RIAS)— German adaptation. Bern, Switzerland: Hans Huber.
Hagmann-von Arx, P., Grob, A., Petermann, F., & Daseking, M. (2012). Konkurrente Validität des HAWIK-IV und der Intelligence and Development Scales (IDS)
[Concurrent validity of the HAWIK-IV and the Intelligence and Development Scales
(IDS)]. Zeitschrift für Kinder- und Jugendpsychiatrie und Psychotherapie, 40, 41-50.
doi:10.1024/1422-4917/a000148
Hagmann-von Arx, P., Meyer, C. S., & Grob, A. (2008). Intelligenz- und
Entwicklungsdiagnostik im deutschen Sprachraum [Intelligence and developmental
scales in German-speaking countries]. Kindheit und Entwicklung, 17, 232-242.
doi:10.1026/0942-5403.17.4.232
Hagmann-von Arx, P., Petermann, F., & Grob, A. (2013). Konvergente und diskriminante Validität der WISC-IV und der Intelligence and Development Scales (IDS) bei Kindern mit Migrationshintergrund [Convergent and discriminant validity of the
WISC-IV and the Intelligence and Development Scales (IDS) in children with a
Hausknecht, J. P., Halpert, J. A., Di Paolo, N. T., & Moriarty Gerrard, M. O. (2007). Retesting in selection: A meta-analysis of coaching and practice effects for tests of cognitive ability. Journal of Applied Psychology, 92, 373-385. doi:10.1037/0021-9010.92.2.373
Horn, J. L., & Cattell, R. B. (1966). Refinement and test of theory of fluid and crystallized general intelligences. Journal of Educational Psychology, 57, 253-270.
doi:10.1037/h0023816
Jensen, A. R. (1998). The g factor: The science of mental ability. Westport, CT: Praeger. Kaufman, A. S., & Kaufman, N. L. (2004). Kaufman Assessment Battery for Children,
Second Edition: Manual. Circle Pines, MN: American Guidance Service.
Kranzler, J. H., & Floyd, R. G. (2013). Assessing intelligence in children and adolescents. A practical guide. New York, NY: Guilford.
Livingstone, R. B., Jennings, E., Reynolds, C. R., & Gray, R. M. (2003). Multivariate analyses of the profile stability of intelligence tests: High for IQs, low to very low for subtest analyses. Archives of Clinical Neuropsychology, 18, 487-507.
doi:10.1016/S0887-6177(02)00147-6
Lubinski, D. (2004). Introduction to the special section on cognitive abilities: 100 years after Spearman’s (1904) “‘General Intelligence,’ Objectively Determined and Measured.” Journal of Personality and Social Psychology, 86, 96-111.
doi:10.1037/0022-3514.86.1.96
McGrew, K. S. (2005). The Cattell-Horn-Carroll theory of cognitive abilities: Past, present, and future. In D. P. Flanagan, J. L. Genshaft, & P. L. Harrison (Eds.), Contemporary intellectual assessment: Theories, tests, and issues (pp. 136-182). New York, NY:
Meyer, C. S., Hagmann-von Arx, P., Lemola, S., & Grob, A. (2010). Correspondence
between the general ability to discriminate sensory stimuli and general intelligence.
Journal of Individual Differences, 31, 46-56. doi:10.1027/1614-0001/a000006
Meyer, G. J., Finn, S. E., Eyde, L. D., Kay, G. G., Moreland, K. L., Dies, R. R.,... Reed, G. M. (2001). Psychological testing and psychological assessment: A review of evidence and issues. American Psychologist, 56, 128-165. doi:10.1037/0003-066X.56.2.128 Murphy, L. L., Spies, R. A., & Plake, B. S. (2006). Tests in print VII. Lincoln, NB:
University of Nebraska, Buros Institute of Mental Measurement.
Mushquash, C., & O’Connor, B. P. (2006). SPSS and SAS programs for generalizability theory analyses. Behavior Research Methods, 38, 542-547. doi:10.3758/BF03192810 Neukrug, E. S., & Fawcett, R. C. (2015). The essentials of testing and assessment: A
practical guide for counselors, social workers, and psychologists (3rd ed.). Stamford, CT: Cengage Learning.
Petermann, F., & Petermann, U. (2011). Wechsler Intelligence Scale for Children (WISC-IV). Frankfurt, Germany: Pearson Assessment.
Reynolds, C. R., & Kamphaus, R. W. (2003). Reynolds Intellectual Assessment Scales: Professional Manual. Lutz, FL: PAR.
Rushton, J. P., Brainerd, C. J., & Pressley, M. (1983). Behavioral development and construct validity: The principle of aggregation. Psychological Bulletin, 94, 18-38.
doi:10.1037/0033-2909.94.1.18
Sattler, J. M. (2001). Assessment of children. Cognitive applications. La Mesa, CA: Sattler. Spearman, C. (1927). The abilities of man: Their nature and measurement. New York, NY:
Macmillan.
Strenze, T. (2007). Intelligence and socioeconomic success: A meta-analytic review of
Tellegen, P. J., Laros, J. A., & Petermann, F. (2012). SON-R 6-40 Snijders-Oomen Nonverbaler Intelligenztest [SON-R 6-40 Snijders-Oomen Nonverbal Intelligence Test]. Göttingen, Germany: Hogrefe.
Wechsler, D. (1991). Wechsler Intelligence Scale for Children—Third Edition. San Antonio, TX: Psychological Corporation.
Wechsler, D. (2003). Wechsler Intelligence Scale for Children—Fourth Edition. San Antonio, TX: Psychological Corporation.
Table 1
Test Characteristics of Five Current Intelligence Tests Used in German-Speaking Countries
Test Age range
(years;months)
Factor(s) measured Administration time (min)
Standardization Number of subtests
Reliability
Year Country
RIAS 3;0 to 99;11 Verbal intelligence, nonverbal intelligence, composite
intelligence
20–25 2011–2012 CH, D 4 .95
SON-R 6-40 6;0 to 40;11 Nonverbal intelligence 60 2009–2011 D, NL 4 .95
IDS 5;0 to 10;11 Fluid intelligence 45 2007–2008 A, CH, D 7 .92
WISC-IV 6;0 to 16;11 Verbal comprehension, perceptual organization, working memory, processing speed, full-scale IQ
60–80 2005–2006 A, CH, D 10 .97
CFT 20-R 8;5 to 19;11 Nonverbal, fluid intelligence 50 2003 D 4 .96
Note. Information was obtained from the German technical manuals of each test: RIAS (Hagmann-von Arx & Grob, 2014); SON-R 6-40
(Tellegen, Laros, & Petermann, 2012); IDS (Grob et al., 2013); WISC-IV (Petermann & Petermann, 2011); CFT 20-R (Weiss, 2006). RIAS =
Development Scales; WISC-IV = Wechsler Intelligence Scales for Children—Fourth Edition; CFT 20-R = Culture Fair Intelligence Test 20—
Table 2
Descriptive Statistics and One-Sample t Tests for Five Intelligence Tests Currently Used in German-Speaking Countries
Test N Min Max M SD Range Skew Kurtosis t/Za
RIAS 204 71 128 100.40 9.84 71–128 -0.143 0.301 0.58
SON-R 6-40 202 72 139 101.27 11.05 72–139 0.157 0.659 1.64
IDS 206 72 134 102.72 10.42 72–134 -0.202 0.247 3.75**
WISC-IV 206 73 133 102.96 11.76 73–133 0.213 -0.085 3.61**
CFT 20-R 142 70 137 102.84 12.59 70–137 0.367 0.426 2.33*
Note. RIAS = Reynolds Intellectual Assessment Scales; SON-R 6-40 = Snijders Oomen Nonverbal Intelligence Test 6-40; IDS = Intelligence and Development Scales; WISC-IV = Wechsler Intelligence Scales for Children—Fourth Edition; CFT 20-R = Culture Fair Intelligence Test 20—Revised.
a Comparisons including the CFT 20-R were analyzed using the single-sample Wilcoxon signed-rank test. Comparisons not including the CFT
20-R were analyzed using the single-sample t test.
Table 3
Statistics for Intelligence Test Score Comparisons on the Sample Level Test comparison Difference in norm
dates (years)
N r/ρa rVar rVarRel Mean difference (95% CI)
t/Zb dc
RIAS and SON-R 6-40 2 200 .58 .76 .80 -1.05 [-2.37, 0.27] -1.57 -0.11
RIAS and IDS 4 204 .69 .84 .90 -2.47 [-3.56, -1.38] -4.47*** -0.31
RIAS and WISC-IV 6 204 .71 .84 .88 -2.75 [-3.91, -1.59] -4.67*** -0.33
RIAS and CFT 20-R 8 141 .57 .73 .76 -3.28 [-4.96, -1.59] -3.39*** -0.32
SON-R 6-40 and IDS 2 202 .67 .81 .87 -1.32 [-2.51, -0.12] -2.17* -0.15
SON-R 6-40 and WISC-IV 4 202 .61 .75 .80 -1.60 [-2.98, -0.22] -2.29* -0.16
SON-R 6-40 and CFT 20-R 6 139 .68 .79 .83 -2.09 [-3.62, -0.57] -2.27* -0.23
IDS and WISC-IV 2 206 .71 .83 .88 -0.24 [-1.42, 0.94] -0.40 -0.03
IDS and CFT 20-R 4 142 .63 .76 .81 -1.48 [-3.11, 0.15] -1.31 -0.15
WISC-IV and CFT 20-R 2 142 .59 .70 .73 -0.55 [-2.25, 1.15] -0.26 -0.05
Note. RIAS = Reynolds Intellectual Assessment Scales; SON-R 6-40 = Snijders Oomen Nonverbal Intelligence Test 6-40; IDS = Intelligence
and Development Scales; WISC-IV = Wechsler Intelligence Scales for Children—Fourth Edition; CFT 20-R = Culture Fair Intelligence Test
20—Revised. rVar = Correlations corrected for range restriction; rVarRel = Correlations corrected for range restriction and attenuation; CI =
confidence interval. All correlations were significant at p < .001.
a Comparisons including the CFT 20-R were analyzed using the nonparametric Spearman rank-order correlation (ρ). Comparisons not including
b Comparisons including the CFT 20-R were analyzed using the Wilcoxon test. Comparisons not including the CFT 20-R were analyzed using
the dependent t-test.
c Negative signs denote higher means obtained in the first-listed and more recently standardized intelligence test of each pair of intelligence
tests.
Table 4
Statistics for Intelligence Test Score Comparisons on the Individual Level
Test comparison N MDiff
individual level SDDiff indivi-dual level Critical differ-encea Correspon-ding intelli-genceb (%) Higher intelli-gencec (%)
Lower intelli-genced (%)
Correspon-ding nominal
level intelligence
scoree (%)
Over-lapping 90% CIf
(%)
Correspon-ding nominal level 90%
CIg (%)
RIAS and SON-R 6-40 200 7.65 5.62 10.98 72.5 11.0 16.5 77.2 80.5 97.0
RIAS and IDS 204 6.72 4.82 12.33 88.2 2.5 9.3 84.0 90.2 100.0
RIAS and WISC-IV 204 7.02 5.35 9.79 70.6 8.3 21.1 80.1 78.4 96.6
RIAS and CFT 20-R 141 8.27 6.68 10.43 68.8 8.5 22.7 51.1 73.0 97.2
SON-R 6-40 and IDS 202 6.91 5.29 12.33 86.1 4.5 9.4 84.0 88.1 99.0
SON-R 6-40 and WISC-IV 202 8.17 5.88 9.79 61.9 14.3 23.8 82.5 72.3 96.5
SON-R 6-40 and CFT 20-R 139 7.20 5.92 10.43 78.4 5.8 15.8 51.9 80.6 94.2
IDS and WISC-IV 206 6.70 5.32 11.14 84.5 6.8 8.7 84.5 85.9 99.0
IDS and CFT 20-R 142 7.73 6.21 11.77 76.8 7.7 15.5 53.9 81.0 96.5
WISC-IV and CFT 20-R 142 8.45 5.76 9.24 72.5 12.0 15.5 53.9 62.7 96.5
Note. RIAS = Reynolds Intellectual Assessment Scales; SON-R 6-40 = Snijders Oomen Nonverbal Intelligence Test 6-40; IDS = Intelligence
20—Revised. MDiff individual level = Mean of the absolute value of the differences between intelligence test scores on the individual level. CI =
Confidence interval.
a The sum of half of each test’s 90% confidence interval in intelligence test scores.
b The percentage of sample participants who reached a difference between each pair of intelligence test scores of less than or equal to the critical
difference.
c The percentage of sample participants who scored higher on the first-listed and more recently standardized intelligence test of each pair of
intelligence tests.
d The percentage of sample participants who scored lower on the first-listed and more recently standardized intelligence test of each pair of
intelligence tests.
e The percentage of sample participants who scored on the same qualitative nominal intelligence level in both tests (<70: lower extreme; 70–84:
below average; 85–115: average; 116–130: above average; >130: upper extreme).
f The percentage of sample participants with overlapping 90% confidence intervals.
g The percentage of sample participants who scored on the same qualitative nominal intelligence level in both tests when considering both
Table 5
Estimates of Variance Components and Generalizability Theory Analyses
Test Comparison N Variance components Generalizability coefficientsa
P (%)
T (%)
P × T, e (%) One test Two tests Three tests Four tests Five tests
RIAS, SON-R 6-40, IDS, WISC-IV, CFT 20-R 138 64.5 1.1 34.3 .65 .79 .85 .88 .90
RIAS, SON-R 6-40, IDS, WISC-IV 200 63.6 1.2 35.3 .64 .78 .84 .88 -
RIAS and SON-R 6-40 200 57.5 0.3 42.2 .58 .73 - - -
RIAS and IDS 204 67.3 2.8 29.9 .69 .82 - - -
RIAS and WISC-IV 204 67.5 3.0 29.5 .70 .82 - - -
RIAS and CFT 20-R 141 56.7 3.8 39.5 .59 .74 - - -
SON-R 6-40 and IDS 202 66.5 0.6 32.9 .67 .80 - - -
SON-R 6-40 and WISC-IV 202 60.5 0.8 38.6 .61 .75 - - -
SON-R 6-40 and CFT 20-R 139 69.7 1.3 28.9 .71 .83 - - -
IDS and WISC-IV 206 70.3 0.0 29.7 .70 .83 - - -
IDS and CFT 20-R 142 63.3 0.6 36.2 .64 .78 - - -
WISC-IV and CFT 20-R 142 63.4 0.0 36.6 .63 .78 - - -
Note. RIAS = Reynolds Intellectual Assessment Scales; SON-R 6-40 = Snijders Oomen Nonverbal Intelligence Test 6-40; IDS = Intelligence
20—Revised; P = percentage of variance attributed to the participants; T = percentage of variance attributed to the intelligence test; P × T, e =
percentage of variance attributed to the interaction between participants and the intelligence test, reflecting unexplained error.
Table 6
Linear Regressions With Time Interval Between Tests, Order of Test Administration, and Qualitative Nominal Intelligence Levels Predicting
Intelligence Test Score Differences Between Two Intelligence Tests
Predictor RIAS and
SON-R 6-40 RIAS and IDS RIAS and WISC-IV RIAS and CFT 20-R SON-R 6-40 and IDS
SON-R 6-40 and WISC-IV
SON-R 6-40 and CFT
20-R IDS and WISC-IV IDS and CFT 20-R WISC-IV and CFT 20-R Time interval between
tests -.02 .10 .03 -.02 -.02 .09 .06 .12 -.04 -.03
Order of test administration
First-listed test first .07 .07 -.03 .03 -.06 -.06 -.02 .14 .07 .05
First-listed test last .03 -.01 .15 .08 -.04 .11 .15 .06 .08 .00
Second-listed test first -.02 .00 .00 .04 .08 .12 .08 .07 .04 .00
Second-listed test last .12 -.09 .04 .07 -.01 -.11 .09 -.03 .14 -.12
Qualitative nominal intelligence level
Below average .07 -.05 .03 .08 -.08 .06 .19* -.03 .05 .11
Above average .17* .00 .17* .24** .02 .07 -.04 -.02 .08 .07
Note. Coefficients are standardized regression coefficients. Order of test administration: The listed test conducted in the middle of the study
Assessment Scales; SON-R 6-40 = Snijders Oomen Nonverbal Intelligence Test 6-40; IDS = Intelligence and Development Scales; WISC-IV =
Wechsler Intelligence Scales for Children—Fourth Edition; CFT 20-R = Culture Fair Intelligence Test 20—Revised.