http://wrap.warwick.ac.uk
Original citation:
Tripathy , Y., Marco, James, McGordon, Andrew and Gama-Valdez , M. (2014)
State-of-charge estimation algorithms and their implications on cells in paralle.
In: IEEE
International Electric Vehicle Conference 2014, Florence, Italy, 17–19 Dec 2014.
Published in: Proceedings of the IEEE International Electric Vehicle Conference 2014 (In
Press)
Permanent WRAP url:
http://wrap.warwick.ac.uk/65753
Copyright and reuse:
The Warwick Research Archive Portal (WRAP) makes this work by researchers of the
University of Warwick available open access under the following conditions. Copyright ©
and all moral rights to the version of the paper presented here belong to the individual
author(s) and/or other copyright owners. To the extent reasonable and practicable the
material made available in WRAP has been checked for eligibility before being made
available.
Copies of full items can be used for personal research or study, educational, or not-for
profit purposes without prior permission or charge. Provided that the authors, title and
full bibliographic details are credited, a hyperlink and/or URL is given for the original
metadata page and the content is not changed in any way.
Publisher’s statement:
“© 2015 IEEE. Personal use of this material is permitted. Permission from IEEE must be
obtained for all other uses, in any current or future media, including reprinting
/republishing this material for advertising or promotional purposes, creating new
collective works, for resale or redistribution to servers or lists, or reuse of any
copyrighted component of this work in other works.”
A note on versions:
The version presented here may differ from the published version or, version of record, if
you wish to cite this item you are advised to consult the publisher’s version. Please see
the ‘permanent WRAP url’ above for details on accessing the published version and note
that access may require a subscription.
State-of-Charge Estimation Algorithms and their
Implications on Cells in Parallel
Yashraj Tripathy
1, Andrew McGordon
1, James Marco
1and Miguel Gama-Valdez
21WMG, University of Warwick Coventry, United Kingdom
2Jaguar Land-Rover Coventry, United Kingdom
Abstract—State-of-Charge (SOC) of a battery is one of the most important parameters used by a Battery Management System (BMS). It is subsequently very important for the efficient functioning of an electric/hybrid vehicle. Since, the SOC is a derived quantity, it is important that the algorithm, on which the estimator is based, is robust and accurate. The algorithms developed thus far, for different battery chemistries are dependent mainly on the current and voltage data received from individual cells or the entire battery. It is possible that an accurate SOC-estimation algorithm could be the key to increasing the efficiency of a typical hybrid-electric vehicle and hence the real-world applicability. This accuracy should be relevant to both normal and failure cases associated with any drive cycle. This in turn depends on the current and voltage signals received, the positing of such sensors, etc. Also, as battery is comprised of a combination of series and parallel strings, it is important that the difference between the SOCs for an individual cell and that of the entire battery is negligible. The objective of this paper is to compare three SOC estimation algorithms: the current based Coulomb-Counter approach; the voltage dependent model-based approach; and the mixed algorithm that adapts the complementary behavior of the other two methods. In this, the positioning of current and voltage sensors; and the reliability of data, i.e. cell SOC and pack SOC, have been considered. Models created using MATLAB/Simulink, based on literature, have been used. It is seen that the SOC estimation algorithm that is based on both current and voltage data is the most accurate under difference cases of normal and failure cases including short-circuit, open-circuit, etc.
Keywords—Battery Management System; State-of-Charge; Coulomb-Counter; MATLAB/Simulink; Normal and Failure Cases; ‘real’ SOC
I. INTRODUCTION
Analysis into various domains of battery failure and normal operation cases has been done by designing mathematical models that mimic the actual physical battery. However, it is difficult to implement a simulation model of a battery system that accurately reflects the battery’s dynamic characteristics during charging and discharging because of its nonlinear electrochemical properties [1]. Accordingly, simulations are generally performed using a simplified battery model or a hardware-in-the-loop simulation associated with the actual battery [2].
Considerable studies have been conducted on battery-packs using MATLAB/Simulink where equivalent-cell models have been developed reducing computation-time while keeping the
accuracy of the model sufficient. Mathematical models for analysis of various cell parameters like temperature; SOC, Impedance, etc. have also been developed [3]. The analysis of these parameters is extremely important as accurate predictions can heighten the efficiency of a battery and enhance the performance of a hybrid car.
II. LITERATURE BACKGROUND
Before selecting the battery model, there are two steps that must be carried out carefully for achieving the best performance from the battery model; the first step is applying standard tests for estimating the battery parameters and the second in using an accurate method for battery parameter estimation with minimal errors. In recent years, some approaches were proposed with different methods for parameter estimation. These methods differ according to the processing time for estimating the parameters, their degrees of complexity or the accuracy of the battery model used [4]. It is of paramount importance that the BMS knows what is exactly happening inside the battery, i.e. whether the battery is performing as expected. Towards this, information regarding various failure cases pertaining to the battery need to be made available. Some of the failure cases are short-circuits, thermal runways, power-surges and so on. These faults essentially cause a difference between what is chemically happening inside the individual cells and what is perceived by the controller.
As SOC estimation is important in predicting the status of a battery, it is imperative to analyse different estimation techniques, their comparisons and to study the implications on a battery pack. It is thought that a parallel cell arrangement behaves as a ‘big’ cell, possessing common characteristics of the individual cells, albeit with a compounded cell capacity. This is due to the fact that they maintain identical voltages across the circuit. This results in the pack self-balancing to matching Terminal Voltage and SOC. But, it is not always the case, specially, during lack of a perfectly accurate SOC-estimation algorithm and in cell failure cases.
III. MODELLINGANDSIMULATION
A. Mathematical Model of Battery Used
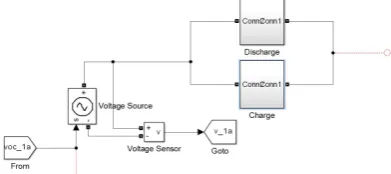
[image:3.595.74.270.240.327.2]Each cell was an equivalent circuit model (Fig. 1) consisting of variable charging/discharging impedances, and a voltage source. While the voltage available was a function of the instantaneous SOC, the impedances were a function of both temperature and SOC. The data used for this model were taken from tests run on a Lithium-ion cell having a capacity of 6.5 Ah. Each impedance consisted of an internal resistance in series with a capacitor and resistor parallel combination. While the resistors were in the order of 10-3 Ohms, the capacitors were in the order of 103 Farads. To ensure division between charging and discharging of a particular cell, diodes were used to maintain the direction of current flow.
FIGURE 1. SIMULINK EQUIVALENT CELL MODEL
Now, a battery consisting of four such cells in parallel, i.e. having a capacity of 26 Ah, was created. Whereas the input to this model (Fig. 2) was Current (in Amperes) based on typical drive cycles, the outputs were Voltage (in Volts), Pack Current (in Amperes) and SOC (in %). The SOCs calculated was subsequently divided in to two values; the one termed as the ‘real’ SOC that was derived from and individual cell and then the Pack SOC, derived from battery parameters (current, voltage, etc.). Then, methods for calculating these SOC values were decided as discussed below.
FIGURE 2. FINAL SIMULINK BATTERY MODEL
B. SOC Estimation Algorithms
Though a universal definition of the SOC doesn’t exist; it is usually expressed as the ratio of the available capacity to the actual attainable capacity [5]. It is more of a concept to aid mathematical calculations and to quantify the energy of a battery. Since, it isn’t physical in nature, it can only be
estimated. There have been many attempts to estimate SOC by synthesizing circuit models based on measured voltage and current at battery terminals. For example, using an extended Kalman filter, employing a circuit model containing resistances, capacitors and diodes, and combined voltage translation via a first-order RC network and Coulomb counting by integrating current over time [6, 7]. The circuit models have to be time variant as battery SOC has a strong history and temperature dependency. As part of the present study, three methods of SOC estimation have been analyzed, namely:
• Coulomb-Counting: This method integrates the
current over a particular time-period to estimate the SOC. It is very fast and entirely dependent on the current of the battery to calculate the SOC. The algorithm is based on this formula [8, 9]:
(1)
[image:3.595.353.549.406.463.2]Where, SOC(0) is the initial value of SOC, Im(t) is the measured battery current and Ahnom is the actual battery capacity. This algorithm (Fig. 3) is the least complex and closest to the conventional definition of SOC. It has some disadvantages as it cannot predict the initial SOC and the algorithm is of no use without that particular value. Also, being entirely dependent on the current sensors, any signal noise will seriously impact the accuracy of the algorithm.
FIGURE 3. COULOMB-COUNTER LOGIC SYSTEM
• Model-based Approach: This is an indirect method
of SOC estimation and usually uses the relationship between OCV and SOC from the discharge curve to estimate the SOC. The model (Fig. 4) also requires the mathematical representation of an identical battery model to compute the OCV. The model is as follows [8, 9]:
(2)
Where G(s) = R0 + R1/(1 + sR1C1) and Vm and Im are
the measured voltage and current of the battery.
[image:3.595.61.266.477.606.2]disadvantages are that it requires a proper battery model for the estimation. Plus, in the case of Lithium batteries, this method can be sometimes inaccurate because the relationship between OCV and SOC is considerably flat across most of the SOC-range potentially being anywhere between 20 and 60 % [5].
FIGURE 4. MODEL-BASED SOC LOGIC SYSTEM
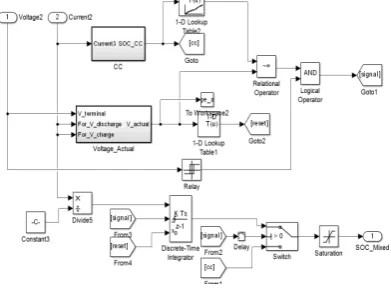
• Mixed-Algorithm: This is a combination of the
above two algorithms. It is based on a closed-loop feed-forward system technique. It is basically a Coulomb-Counter that is corrected by comparing with the battery model available from the Model-based technique. The Coulomb-Counting estimation allows a fast reaction of the estimated SOC, while the control loop allows calibration of the SOC by removing problems associated with the former methods including signal-noises and wrong-initialization. The SOC is recalibrated during every every-charging cycle, where the voltage calculated from the Coulomb-Counter SOC at 10% and 90% is tallied with the actual voltage of the battery from voltage sensors. If, there is any deviation, the SOC jumps from the earlier value to the SOC at that voltage calculated through the model-based approach. This method (Fig. 5) is also referred to as ‘voltage translation’ as the calibration of the SOC takes place based on the information available from the comparison between the different voltages. These voltages are available from the Coulomb-Counter and Model-based approach by running them over a discharge-curve and numerical battery model, respectively.
FIGURE 5. MIXED SOC LOGIC SYSTEM
C. Modelling Methodology
The normal case is considered as the actual battery where there are four cells arranged in parallel driven by a drive cycle [3]. A drive cycle was implemented to simulate the effects of continuous charge and discharge of the battery. It consisted of a flat discharge at 50 Amperes and a monotonically reducing charging process with current ranging from 50 to 10 Amperes with SOC varying between 5 and 95%. This was decided based upon the nominal charging and discharging rates of a lithium-ion cell, typically less than ~2C, where C is the cell capacity in Ah. The initial SOCs had a distribution of 10% around a median of 20%. The cell capacities similarly had a distribution of 10% around a median of 6.5 Ah. The initial value for the pack SOC was set at 15%.
The failure cases consist of:
• Cell is short-circuited in the pack
• Cell is open-circuited in the pack
• Current sensor positive offset-error
• Voltage sensor negative drift-error
The model takes into account the SOCs of each individual cell as well as the SOC of the entire pack. The Coulomb-Counter, the Model-Based and the Mixed SOCs were considered as the three Pack SOCs i.e. SOCs calculated from pack sensor values.
Since, of the three methods the Model-based approach factors in the physical conditions of a cell at every time-step during simulations, it has been chosen as the arbitrary ‘real’ SOC quantity derived from the individual cells. This would help decide the reliability of all the SOC algorithms.
IV. RESULTSANDDISCUSSION
It is understood that in the normal case, the entire pack behaves as a single cell. It is not the same for most of the failure cases. Failing to take in to account any such discrepancy could result in over-charging/ over-discharging and potential early-ageing of a particular cell and in turn that of the entire battery. Thus, it is crucial to find out the correct point in a battery where information should be collected so that the signals obtained are accurate and reliable. A decision has to be made whether measuring pack parameters is sufficient, or should the BMS delve deeper and collect data from individual cells. It is possible that accuracy would be best if data was collected from individual cells, but this may be infeasible due to possibly large number of sensors and complexity of analysis.
A. RESULTS
[image:4.595.80.276.545.689.2]0 1•000 2•000 3•000 4•000 5•000 6•000 7•000 0 10 20 30 40 50 60 70 80 90 100 Time (seconds) S tat e-o f-C h a rge ( % ) Coulomb-Counter SOC Model-Based SOC Mixed SOC Real SOC
0 1•000 2•000 3•000 4•000 5•000 6•000 7•000 8•000
0 10 20 30 40 50 60 70 80 90 100
Time (in seconds)
S tat e-o f-C h a rg e ( in % ) Coulomb-Counter SOC Model-Based SOC Mixed SOC Real SOC
0 1000 2000 3000 4000 5000 6000 7000 8000
-60 -40 -20 0 20 40 60 Time (seconds) C u rr e n t ( A m per es ) Drive Cycle
[image:5.595.39.264.122.297.2]cases are presented in this section and comments have been made on the above two arguments. As mentioned earlier, the three pack SOCs namely, Coulomb-Counter SOC, Model-Based SOC and Mixed SOC have been derived from pack measurements, while the `real’ SOC has been derived from the individual cell.
FIGURE 6. DRIVE CYCLE OF THE BATTERY
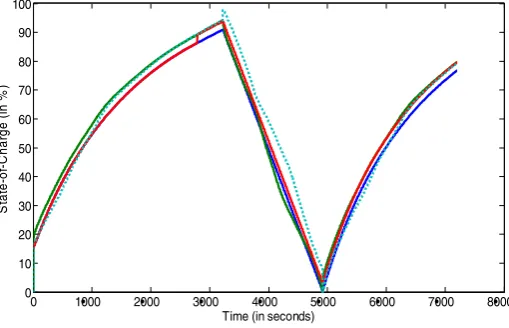
1. Short Circuit Case
One of the cells was short-circuited and the impact on the three SOC algorithms and the pack was observed. From voltage data, it was seen that all the cells discharged into the cell which was short-circuited. From Fig. 7, the Model-based SOC almost instantly fell to zero. But, in the cases of the Mixed and the Coulomb-Counter (CC) SOCs (red and blue lines), the values went to 100% in about 1200 seconds and stayed saturated at that value. This can be attributed to the fact that a high amount of current was flowing across the circuit in a very short time as the remaining cells were discharging into the short-circuited one. Although this observation was contradictory to the situation; the Mixed Algorithm and the CC SOCs were comparable to the real SOC in account with all of them hitting the 100% mark. The individual cell voltages are dictated by the drive cycle. This leads to an ambiguous result that the cells haven’t discharged completely but on the other hand are completely charged. The Model-based approach was providing a better picture of the physical process as all the other cells are expected to drain in to the short-circuited cell.
FIGURE 7. REPRESENTATION OF SOC IN CASE OF SHORT-CIRCUITED CELL IN THE PACK
2. Open Circuit Case
[image:5.595.299.551.150.311.2]Cell ‘1c’ was open-circuited. It was expected that the remaining cells in the pack would have to bear the burden of the extra current flowing through them and in the process to charge/discharge faster. From Fig. 8, it is seen that there is absolutely no impact of the open-circuit failure on the drive-cycle of the battery pack.
FIGURE 8. REPRESENTATION OF SOC IN CASE OF OPEN-CIRCUITED CELL IN THE PACK
In Fig. 6, as the pack is charging, from Fig. 8 , it can be seen that the other three SOCs are diverging from CC SOC. This may be due to the fact that the CC SOC solely depends upon the current values supplied to it. Despite the fact the Model-based and Mixed SOC are Model-based on the pack signal values, they are closer to the real SOC because the pack voltage is synonymous with the actual voltages of the individual cells. It is clear that while the voltage-based SOCs are better in matching-up to the actual process happening inside a cell. The position of measurement of data is incorrect. The real SOC shows that the cells charge and discharge faster. This could result in over-charging or over-discharging of cells and may cause complete pack failure. In Fig. 8, it should be noted that since the charging/discharging impedances at a top or bottom of the SOC v/s Time curves are different there is a spike at ~2400s and ~3600s, when the model alters between the two impedances. Thus, these points should not be considered for observation but should be left out as modelling anomalies.
3. Positive Current Sensor Drift Case
In this case, there is a drift-error in the pack current-sensor. This will translate to the SOC algorithms that depend on the pack signals. The drift error had a slope of +0.001 i.e. an error of 1 Amperes every 1000 seconds. It should be noted that for all the cases, the CC based SOCs were wrongly initiated to 15% instead of the actual initial values of ~20% to better understand the changes without the lines overlapping.
[image:5.595.48.271.518.690.2]0 1•000 2•000 3•000 4•000 5•000 6•000 7•000 8•000 0
10 20 30 40 50 60 70 80 90 100
Time (in seconds)
S
tat
e-of
-C
har
ge
(
in
%
)
0 1•000 2•000 3•000 4•000 5•000 6•000 7•000 8•000
0 10 20 30 40 50 60 70 80 90 100
Time (in seconds)
SO
C
(
in
%
)
Coulomb-Counter SOC Model-Based SOC Mixed SOC Real SOC
[image:6.595.38.557.155.311.2]in the Mixed SOC per unit time is also incorrect, but, as the algorithm is self-correcting (In this case, correcting itself at ~2500s based on voltage data), it keeps on tallying with the actual SOC throughout a drive-cycle. The Model-based SOC best compares with the real SOC, as we have, real/correct voltage data supplied to it. But, there is a slight error along a drive cycle as the final voltage used in that algorithm is dependent on the current data supplied to it.
FIGURE 9. REPRESENTATION OF SOC IN CASE OF POSITIVE CURRENT SENSOR DRIFT IN THE PACK
4. Negative Voltage Sensor Offset Case
In this case, a -0.02 V offset was applied to the voltage sensor. Even in this case, the CC based SOCs were wrongly initialized to 15% instead of the actual ~20%. As with all other cases, it should be noted that the real SOC was based on the voltage data of the individual cell and not of the pack. Due to error in the signals transferred via the voltage sensors, there was a resultant error in the Model-based SOC as it was almost entirely voltage dependent (Fig. 10). Also, the Mixed algorithm corrected its SOC according to the incorrect voltage signal. In this case, it is always going to lead to under-discharging/under-charging. This proves that even the most robust algorithms need to accurate data to keep on providing the best results.
FIGURE 10. REPRESENTATION OF SOC IN CASE OF NEGATIVE VOLTAGE SENSOR DRIFT IN THE PACK
B. DISCUSSION
[image:6.595.31.286.523.687.2]If all cells are arranged in parallel, such a battery can be considered as a single ‘big’ cell, with identical voltage and compounded capacities. But, for this to hold true always, the BMS needs to take into account all the possible failure cases associated with each individual cell and of the whole pack. Since, the SOC is one of the most important parameters that depicts the state of a battery, it should be in-tune with the physical process happened inside the individual cells.
TABLE 1. COMPARATIVE ANALYSIS OF THE SOC ALGORITHMS
Failure Case Best SOC Algorithm(s)
Short-Circuit Mixed/CC Open-Circuit Mixed/Model-Based Current-sensor Drift Model-Based
Voltage-sensor Drift CC
In the short-circuit case, as mentioned earlier, the source voltages of the individual cells are based on the drive cycle. Thus, the real SOC that is expected to be identical to the Model-Based SOC, is more on the lines of the CC and Mixed SOCs. The cell/battery current and voltage are the two physical signals available to any SOC algorithm.
Despite the fact that the latter two cases of sensor-drifts show that the model-based and CC SOCs are better. If both the cases are clubbed together while making an algorithm, the Mixed SOC would be the best suited as it takes the complementary characteristics of the other two algorithm in to account. Thus, for all the four failure cases considered here, it is always the most accurate. Hence, it is the algorithm that should always be the basis of creating complex algorithms that predict the SOC of a battery. But, it must be noted that in terms of complexity, the CC is the easiest to design while the Mixed algorithm is the most complicated.
V. CONCLUSIONS
A. The Mode-Based based SOC approach tallies with the physical processes happening inside a cell but is also prone to errors leading from incorrect voltage signals.
B. The current based approach has multiple challenges including incorrect SOC initialization (absent in case of voltage approaches) and sensor errors.
other two algorithms i.e. it is more flexible and can take into account failure scenarios better.
D. SOC estimation algorithms based on both current and voltage values are ideal. The algorithm should be thus that its failure should accurately correspond to the battery/cell failure.
E. Cells in parallel can be treated as a single ‘big’ cell if certain consideration are made to take its failure cases in to account. That is, the information made available to it, the SOC, is accurate and best reflects the real physical system.
The outcome of this study should provide directions for adapting the initial cell capacity, current, terminal voltages, etc. into a typical SOC estimation algorithm. It is also expected that it will provide a perspective for deciding the voltage and current measurement points (pack v/s cell data).
ACKNOWLEDGMENT
The research presented within this paper is supported by the UK Technology Strategy Board (TSB) through the WMG Centre High Value Manufacturing (HVM) Catapult in collaboration with Jaguar Land Rover and TATA Motors.
REFERENCES
[1] T. K. Dong, A. Kirchev, F. Mattera, J. Kowal, and Y. Bultel, “Dynamic modeling of Li-ion batteries using an equivalent electrical circuit,” J. Electrochem. Soc., 2011.
[2] Dong-Hyun Shin, Jin-Beom Jeong, Tae-Hoon Kim, and Hee-Jun Kim, “Modeling of Lithium Battery Cells for Plug-In Hybrid Vehicles”, Journal of Power Electronics, 2012.
[3] Mohamed Daowd, Noshin Omar, Bavo Verbrugge, Peter Van Den Bossche, Joeri Van Mierlo, “Battery Models Parameter Estimation based on Matlab/Simulink”, The 25th World Battery, Hybrid and Fuel Cell Electric Vehicle Symposium & Exhibition, 2010.
[4] B. Schweighofer, K. M. Raab, and G. Brasseur “Modeling of High Power Automotive Batteries by the Use of an Automated Test System” IEEE Trans. on Instrumentation and Measurement Vol. 52, 2003. [5] F. Codeca, S.M. Savaresi, and V. Manzoni, “The mix estimation
algorithm for battery State-of-Charge estimator – Analysis of the sensitivity to measurement errors”, Joint 48th IEEE Conference on
Decision and Control, 2009.
[6] Shuo Pang, Jay Farrell, Jie Du, and Matthew Barth, “Battery State-of-Charge Estimation”, American Control Conference Arlington, 2001. [7] C. Barbier and H. Meyer, “A Battery State of Charge Indicator for
Electric Vehicles,” Proc. of the Inst. of Mech. Eng., 1994.
[8] J. Chiasson and B. Vairamohan, “Estimating the state of charge of a battery,” IEEE Transactions on Control Systems Technology, 2004. [9] M. Verbrugge and E. Tate, “Adaptive state of charge algorithm for