AN ALGORITHM FOR THE BAY
PLACEMENT OF INTERMODAL
CONTAINERS
L. R. van Beek
ii
AN ALGORITHM FOR THE BAY PLACEMENT OF INTERMODAL CONTAINERS
Bachelor Thesis
Enschede, September 2019 Student
L.R. van Beek (Leon)
Industrial Engineering and Management (s1805665) University of Twente
Lead supervisor Supervisor Cofano B.V.
Dr. Ir. E.A. Lalla (Eduardo) L. de Vries
Assistant Professor Lead Software Engineer
University of Twente Cofano Software Solutions
Second supervisor
iii
EXECUTIVE SUMMARY
INTRODUCTION
Cofano Software Solutions is a software development company that develops applications for the logistics industry. Their focus is the container freight transportation industry. Cofano creates and adapts applications to the wishes of their customers in order to improve performance in various aspects. The offered bachelor assignment is about optimizing the way containers are stacked at a terminal such that the amount of internal relocation moves decrease.
Currently, the containers at the terminal are stacked in a non-optimal manner without any optimization method. As relocation moves cost time and money, one aims to reduce these. This can be done by implementing an automated stacking method that places the containers at the terminal. Therefore, in this research the following core problem is solved: “There is no computed method behind the current policy of container stacking.”. The solving of the core problem is done by designing an algorithm that places the containers at the terminal, and an evaluation of the results to check whether actual improvement is made compared to the current system.
APPROACH
In order to be able to construct the algorithm, a literature review is conducted, a data analysis performed and expertise knowledge from the company and UT supervisors considered.
In the literature review the following was found:
- The problem addressed in this research belongs to the class of Loading and Unloading (LU) problems.
- An event-based approach will be used.
- Examples of models / heuristics previously used, that can give insights into pitfalls and possible solutions.
From the data analysis the following was found:
- It is possible to give containers an estimated leave date per carrier based on the historical data.
- The data provides the necessary information to make the results from the algorithm comparable to the real life situation.
- The data gives the background knowledge needed on the workings of a container terminal, which helps the development the algorithm.
In the current stacking policy, the containers are stacked according to their corresponding carrier. All containers are put together in clumps of the same carrier, without paying any attention to their estimated departure dates (Etd’s). The goal is to develop an algorithm that does consider the Etd’s of containers and stack them according to these. Challenges faced are the determination on how to improve the method of stacking, coping with the restrictions posed by the reach stacker, and ensuring the validity op the proposed stacking method.
THE ALGORITHM
iv
a ground level, and thirdly on top of the container with the highest Etd. With all stacking being performed under stacking restrictions posed by a reach stacker (container transportation vehicle). The algorithm is implemented into Visual Basic for Applications (VBA). In order to examine the validity of the algorithm and to make the results comparable, several other stacking methods have also been implemented into VBA. The three stacking methods that have been implemented into VBA are:
- A random stacking method - The current stacking method - The new stacking method
To give further options for improvement and to show how the new stacking method performs when stacking containers with a yard crane the possible implementation of a yard crane has also been examined. The assessment of the yard crane performance also broadens the possibilities for implementation at larger terminals, as larger terminals already often have a yard crane system. Thus, the following two stacking methods have also been implemented into VBA:
- The implementation of a yard crane using the current stacking method. - The implementation of a yard crane using the new stacking method.
These five different methods are tested with three databases of different sizes. All the inputs for the stacking methods were the same to ensure the validity of the results. From the results can be seen that the new stacking method significantly decreases the relocation percentage compared to the current stacking method (the simulated one, as well as the real life one). As well as on the random stacking method. For the implementation of a yard crane two test instances are used. The stacking with a yard crane using the current stacking method and the stacking of a yard crane using the new stacking method. The implementation of a yard crane using the current stacking method outperforms the current stacking method using a reach stacker, but not the new stacking method with the use of a reach stacker. The yard crane implementation stacking with the new stacking method outperforms all other stacking methods. This was to be expected as a yard crane has fewer stacking restrictions compared to a reach stacker and uses the newly devised stacking method.
Assumptions
In order to be able to develop an algorithm the following assumptions are made: - Containers can only be (re)stacked in one bay.
- The estimated arrival or departure date of the container is also the actual arrival or departure date in the algorithm. Which can be assumed because this is the case for the larger part of the containers.
- All containers have a known Etd.
- Containers that need to be placed in areas designated for dangerous goods are not processed by the algorithm.
- Truck retrieval and return happens on one day.
- Containers of different sizes get stacked in different bays.
- All the containers that arrive on a day are placed before retrieval starts.
The assumptions mentioned above made it possible to develop the algorithm. The main issue in which
v
for the algorithm to work all containers must receive an Etd. This is not yet the case in the real life situation. However, once this is fixed the algorithm can be used in practice. In this research a possible
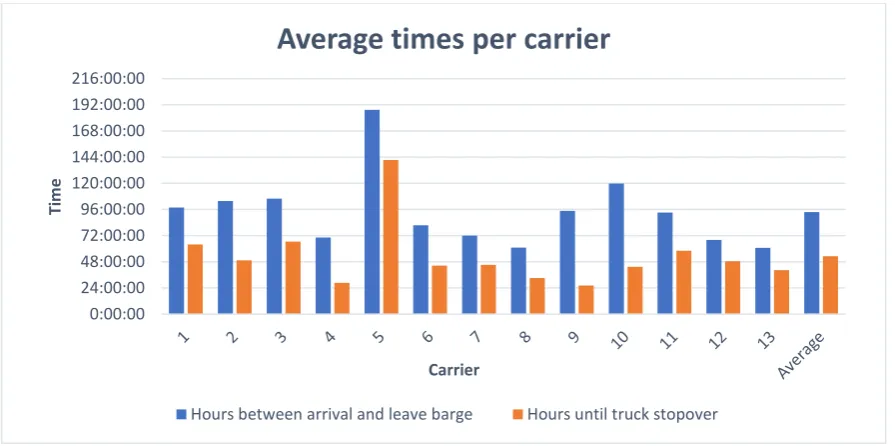
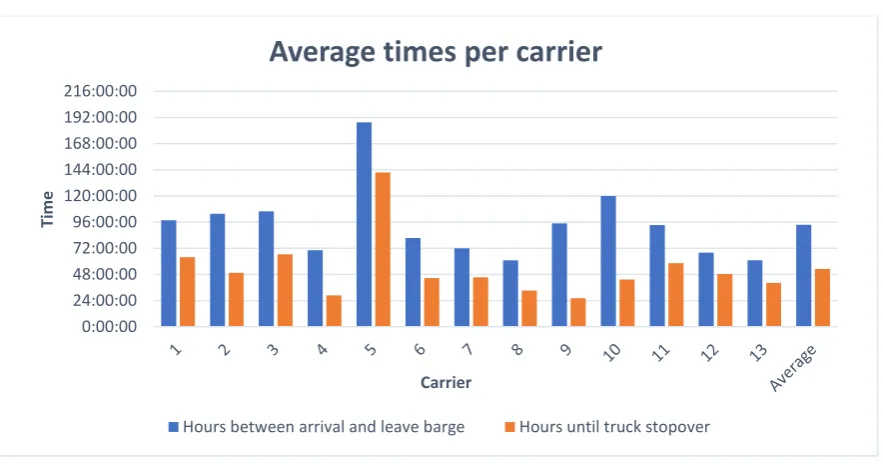
[image:5.595.70.518.172.395.2]way of giving Etd’s to containers is proposed. Containers can receive an Etd based on the average time containers of corresponding carrier stay at the terminal. These average times are calculated by analysing the dataset provided by Cofano and can be found in Figure i. To ensure data confidentiality the names of the carriers have been replaced with numbers.
Figure i: Average times per carrier (anonymised)
CONCLUSIONS AND RECOMMENDATIONS
With the outcomes of the research we have shown that the new stacking method outperforms the current one under the assumptions of the model. The assumptions which made it possible to construct the algorithm are explained and their impact on the performance of the algorithm analysed. Once all containers receive an Etd the algorithm is ready to be used in practice and reduction in relocation moves can be expected as the improvement in the simulated environment is significant.
Before the implementation of the algorithm, Cofano should look whether they can improve the
algorithm exploring the options of assigning Etd’s to all arriving containers. The proposed algorithm improves on the current stacking method reducing the number of relocation moves. The algorithm is however not yet ready to be implemented into an application that places containers because all containers first need to receive an Etd before the algorithm is capable of placing them at the terminal. From the research the following recommendations for Cofano follow:
- Find a way to assign all containers an Etd in order to be able to implement the proposed algorithm.
- Test the proposed algorithm on the data of multiple terminals to ensure that performance is similar when implementing the algorithm into an application.
- Explore options for improvement of the algorithm mentioned in the “recommendations for future research” subsection in Chapter 6.
0:00:00 24:00:00 48:00:00 72:00:00 96:00:00 120:00:00 144:00:00 168:00:00 192:00:00 216:00:00
Ti
me
Carrier
Average times per carrier
vi
PREFACE
This research contains the bachelor’s thesis “An algorithm for the bay placement of intermodal containers”. This thesis was written in order to complete my bachelor Industrial Engineering and Management at the University of Twente. The research has been conducted at Cofano Software Solutions considering the gathered data of a customer of theirs. The research proposes a new stacking method with the goal of improving container handling operations at terminals. This research has been conducted from May the 27th, 2019 till the 4th of October, 2019.
I would like to thank my supervisor Leon de Vries from Cofano and all other employees for their support, feedback, and willingness to answer my questions. Furthermore, I would like to thank my supervisors E.A. Lalla and M.R.K. Mes from the University of Twente. They were available for timely meetings and their insight, experience and feedback helped greatly in conducting this research. Leon van Beek
Enschede, 27 September
vii
TABLE OF CONTENTS
EXECUTIVE SUMMARY ... III
PREFACE ... VI
LIST OF DEFINITIONS ... VIII
1. INTRODUCTION ... 1
1.1 Current situation ... 1
1.2 Problem Description ... 2
1.3 Problem approach and available material ... 3
1.4 Research questions ... 4
1.5 Context terminal ... 5
1.6 Deliverables ... 8
2. LITERATURE REVIEW ... 9
2.1 Related works ... 9
2.2 Classification of literature to research ... 13
2.3 Conclusion... 14
3. SOLUTION APPROACH ... 15
3.1 Data gathering ... 15
3.2 Data analysis ... 16
3.3 Solution design ... 21
3.4 Conclusion... 23
4. NEW STACKING METHOD ... 25
4.1 Algorithm ... 25
4.2 Implementation ... 30
4.3 Conclusion... 37
5. EVALUATION OF RESULTS ... 38
5.1 Experiment results ... 38
5.2 quality of the generated solution ... 43
5.3 conclusion ... 43
6. CONCLUSIONS, RECOMMENDATIONS AND LIMITATIONS ... 45
6.1 Conclusions ... 45
6.2 Recommendations ... 46
6.3 Limitations ... 47
REFERENCES ... 49
APPENDIX A: ENTIRE PSEUDOCODE NEW STACKING METHOD ... 50
APPENDIX B: VISUAL REPRESENTATION YARD BAY ... 53
viii
LIST OF DEFINITIONS
Intermodal
Shipping Container
Large standardized shipping container designed and built for intermodal freight transport. Used to transports good by means of barge, train and truck. Barge Containership used for transporting intermodal containers over inland
waterways.
Bay A ground “matrix” where containers can be placed.
Heuristic A heuristic is a method for finding a solution to a problem that employs a practical method that does not providing the optimal solution, but a reasonably good solution. Heuristics are generally used as they require limited computation times.
Relocation Move A relocation move occurs in a terminal when a container needs to be moved internally in order to get to the underlying container which needs to be moved to their designated means of transportation.
Remarshalling Relocating containers without the need to pick up a container underneath it, to prevent the future relocation of containers.
Blocks Relocation Problem (BRP)
The problem of which blocks to move in order to minimize the total number of moves needed to retrieve containers from a terminal.
Reach Stacker A reach stacker is a transportation devise that hoists containers. It is used for loading and unloading containers in small or medium-sized terminals. Stacking Problem
(SP)
1
1. INTRODUCTION
In this part, the problems that arise in container stacking will be introduced. Firstly, the current situation will be explained in Section 1.1. After that the core problem will be determined in Section 1.2. With this core problem, certain research questions arise that need to be answered in order to solve the core problem. These will be discussed in Section 1.3.
1.1 CURRENT SITUATION
The bachelor assignment is at Cofano, a software development company. They develop logistical applications with some of their customers being Schiphol and the port of Rotterdam. The establishment located in Enschede focusses on the development of logistical applications that their customers can use to, for example, track their intermodal shipping containers. The assignment itself is about finding a method of container stacking that outperforms other current stacking methods at terminals. The aim of Cofano is to have a new stacking method reducing relocation moves that can be implemented at multiple terminals, but in this research the historical data of a single terminal is used. The containers at the terminal are stored for some time until further transportation. The transportation is currently being conducted by ship and truck, and in the future possibly by train. The offered assignment is about optimizing the way these containers are stacked such that the amount of internal relocation moves, and possibly transportation distances are decreased. This research will be set up by composing a solution approach that determines where to place the intermodal containers for storage in a terminal. The terminal that is used for validation is a relatively small inland terminal with a capacity of about 2000 containers. The name cannot be mentioned because of data confidentiality constraints. This terminal has been selected as the dataset that Cofano has gathered is most complete at this specific terminal. The terminal is however not owned by Cofano, as they are a software development company. So, the research will be conducted at Cofano, considering the terminal of a single customer of theirs. Cofano wants to develop a software application that determines where to place the containers at the terminal, and then lease or sell the software to them. The goal is to have a solution that can also be easily adapted and implemented at other terminals. The problem that arises at the terminal is that there is no computed method of container stacking with the current stacking policy causing unnecessary relocation moves that are costly and could be avoided. In the current policy, the empty containers when placed at the terminal are put together in clumps considering the carrier of the containers. When the containers are full, they are placed according to their designated export modality (e.g. all containers that need to leave by truck are stacked together). This however, results in more relocation moves than necessary, as there is no consideration for the estimated departure date. It is not taken into account when the containers need to leave again, and in this aspect, improvements can be made. Furthermore, empty containers are stacked onto each other and are interchangeable when being handled by the same carrier and are of the same type.
2
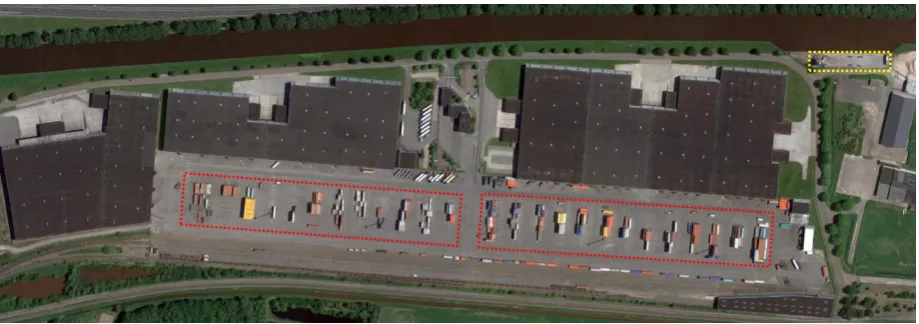
Figure 1: Terminal Layout Source: adapted from Google Maps1.
Figure 1 shows the layout of the terminal. The yellow area depicts the loading / unloading dock for barges, and red areas represent bays where containers can be stacked for storage. When containers arrive by truck or barge, they are stored at the terminal until further transportation. From the Google maps image, the yard layout can be derived. In the yard five containers can be stacked next to each other per bay, and the length per bay is either six 20 FT containers, four 30 Feet or three 40 FT containers. The containers can be stacked 6 high, resulting in the following respective dimensions (L x W x H). (6 x 5 x 6), (4 x 5 x 6) and (3 x 5 x 6). In total, there are 25 bays in which containers can be stored. All containers are transported by means of reach stackers.
1.2 PROBLEM DESCRIPTION
[image:10.595.77.525.469.576.2]In Figure 2 the problem cluster with the flow of problems at the terminal is displayed. This diagram helps visualise the causes of the problems at the terminal and is useful in helping determine the core problem.
Figure 2: Problem cluster displaying the flow of problems at the terminal.
From Figure 2 it can be seen that at the terminal the containers are placed together such that the employees operating the machines will find them easy to identify. As the containers are placed in this manner, there is no consideration for the internal transportation distance and the amount of relocation moves that are necessary. That these two factors are not taken into account results in an inefficient stacking method, and more man-hours and machine usage than necessary, resulting in higher costs. Once the terminal takes these factors in consideration cost reduction can be achieved.
3
Thus, Cofano wants to solve this problem for terminal, as they themselves do not pay attention to this inefficiency. Once the core problem is solved, the action problem itself will also disappear.
Core problem
Considering the problem cluster shown in Figure 2, the core problem is determined. The cause for the problems at the terminal is that they have not yet thought of a stacking method that incorporates important factors that influence the efficiency of it. Thus, the core problem is defined as follows:
“There is no computed method behind the current policy of container stacking.”
Following the problem cluster there are two factors that influence this inefficient stacking method and can thus contribute to solving the action problem. These two factors are:
“the amount of unnecessary relocation moves at the terminal.”and
“The big internal transportation distance at the terminal.”
As there are currently a lot of relocation moves at the terminal these can be reduced. The actual amount of relocation moves that are currently being performed is known in the available data. The percentage of the amount of relocation moves being performed is 21,16%. With the help of (López-Plata, Expósito-Izquierdo, Lalla-Ruiz, & Melián-Batista, 2016) an estimation for the expected reduction in relocation moves can be made. In the paper a variety of stacking methods are tested and compared to a random stacking method. The reduction in relocation moves for the terminal will be estimated by taking the average reduction in relocation moves over the four tests performed in the before mentioned paper. With the average reduction in relocation moves being 34,24%. This resulting in the goal of bringing down the number of relocation moves at the terminal to 13,91%. This reduction in relocation moves will save the terminal time, and thus costs.
In this research the amount of relocation moves will be addressed as this is one of the more pressing problems compared to the transportation distance. The relocation problem is more adaptable to the situation at other terminals compared to transportation distances, and thus of more importance to Cofano as they want to try and implement a new stacking method application at more terminals than just the one considered in this research. The stacking problem, which often addresses the number of relocation moves at a terminal, is also widely addressed in the literature and has scientific relevance and accessible research already conducted in the field.
1.3 PROBLEM APPROACH AND AVAILABLE MATERIAL
The problem the terminal faces is that containers are currently being stacked without a computed method that can improve the stacking efficiency at the terminal. This results in more relocation moves than necessary and transportation distance problems at the terminal. In order to solve the core problem, the following stages need to be considered:
1. Devise a new stacking method for the containers.
2. Implement the solution approach that incorporates the new stacking method together with other policies to show the performance.
4
Once these stages are solved, the research will be concluded, and it will be known whether a stacking method has been devised that outperforms the current policy.
The materials that are used for the bachelor assignment is what can be found in the literature concerning the subject, and the data set that has been gathered by Cofano. The data set is a large database considering various aspects of the container terminal, and all the containers moves being performed. The data covers all container information over a time span of 1 year. Data that could be used is the arrival and leave date of the containers, the import and export modalities, and the amount of relocation moves being performed. This data can be used to help create a new stacking method, and to make this new method comparable to the current policy. The knowledge from the literature can be combined with the dataset that is available to strengthen the solution that will be devised. A more elaborate overview of the available data and the data analysis itself can be found in Section 3.2. Information can also be obtained by conversing with the company supervisor, the other employees of Cofano, and from expertise knowledge from the UT-supervisor. Furthermore, information can be obtained from previous bachelor assignments, which will provide a guideline for the research setup and to give an indication about the requirements and time limit.
The research will consist of the constructing of a solution approach that determines a method for container stacking. This method is tested whether it achieves the intended results and whether these results are applicable to the real life situation.
Together with the dataset, the literature, knowledge from the company and the restrictions of the terminal it is possible to create a stacking method that determines where to place the containers in an efficient manner. It might not be possible to incorporate all the restrictions of the terminal into the new stacking method. So, one must weigh the importance of the constraints and possibly choose to generalize in some cases. It is still the goal to make the proposed solution implementable in the real life situation, so one should be careful with what generalizations are made.
In the third stage, a numerical experiment will be conducted to ensure the validity of the model and to show whether improvements is made with considering the number of relocation moves. With this experiment Cofano can show their customers that they developed a new stacking method that, if successful, outperforms other current stacking methods. The next step for Cofano is building a software application to lease or sell to companies in which they can enter their container shipments and an application determines where to place these containers at the terminal.
Thus, the scope of the research is to develop a solution approach at the terminal that places the containers. The research is built upon reducing the number of relocation moves needed. After the solution approach has been devised, it is used to conduct experiments to show the performance compared to the current stacking policy. These results are then evaluated, and conclusions and recommendations will be given. The use for Cofano will be a solution that determines where to place containers at terminals of customers of theirs, reducing relocation moves, and thus saving costs.
1.4 RESEARCH QUESTIONS
5
Chapter 2: What are possible solutions to the container stacking problem which can be found in the literature?
2.1 What is known in the literature about container stacking, and what concepts can be taken from it?
2.2 How can these concepts be classified to this research?
These questions can be answered by conducting a search of the literature and by assessing theses in the same field of research.
Chapter 3: How can the solution approach be shaped, incorporating the available data? 3.1/2 What can be found in the available data?
3.3.1 Which assumptions need to be considered? 3.3.2 How can one ensure the validity of the system?
These questions can be answered by conducting interviews at Cofano, by conducting numerical analysis on the data set, and with knowledge from the literature.
Chapter 4: How should the stacking algorithm work? 4.1 How will the new stacking method be shaped? 4.2 Is the implemented method of stacking valid?
In this chapter a new container stacking method is designed and implemented, build on the knowledge of the previous two chapters.
Chapter 5: What performance can be expected when implementing the different methods? 5.1 What is the performance of the different stacking methods and are the results valid? 5.2 What is the quality of the generated solution?
In Chapter 5 the results of the runs on the implemented algorithm are discussed. Chapter 6: Conclusions and Recommendations
6.1 What conclusions can be drawn from the results of the research?
6.2 What are the recommendations to the company, and for possible further research? 6.3 What are the limitations of the research?
In the final chapter the findings from the previous chapters will be discussed. The conclusions will be assessed on the use of the research to Cofano, and to the research field overall.
1.5 CONTEXT TERMINAL
In this section the situation at the terminal will be discussed. Covering the scope and the requirements of the research which influence the solution design. The data analysis is not included in this section but given in Section 3.2.
Container transportation vehicles
6
Figure 3: Reach stacker2
[image:14.595.72.377.408.637.2]In Figure 3 a reach stacker is displayed. A reach stacked is a vehicle which drives between the yard and vessel / truck / train to load and unload containers. A reach stacker is mostly used at smaller terminals as they have stacking restrictions limiting them from reaching all containers. Reach stackers can always reach the first row of containers stacked. And can only reach the second row of containers should this row be stacked one container higher than the first row. These restrictions limit the usability of reach stackers at larger terminals, as the number of containers processed there is significantly higher.
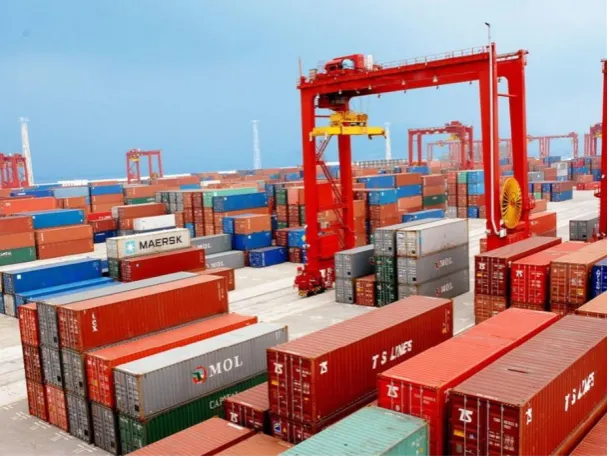
Figure 4: Yard crane3
Figure 4 shows a yard crane. A yard crane is a vehicle which van move horizontally and vertically over the containers. This enables a yard crane to always reach the top container of all containers stacked in a bay (area in length and width where containers get stacked). Thus, the implementation of a yard
2https://www.conger.com/product/toyota-reach-stacker-container-handler/
7
crane compared to a reach stacker removes a lot of the stacking restrictions a reach stacker poses, generally increasing stacking efficiency at terminals.
Throughput
The terminal that is considered is a relatively small inland terminal. Over the timespan of 365 days a total of 18362 containers pass through the terminal. This counts down to about 50 containers a day that are processed by the terminal.
Scope
In order to devise a new method of container stacking the constraints of the terminal need to be considered. These constraints need to be implemented into the solution, as the constraints form boundaries for the solution design. After discussing with Cofano, the following constraints for the terminal are determined:
- The empty containers need to circulate to a certain degree (that the bottom one does not always remain there).
- The layout of the bay is (6 x 5 x 6) for 20 FT containers (Larger containers decrease the number of containers that can be stacked in the length of the bay). At the terminal there are 25 bays where containers can be stored.
- A reach stacker can place and retrieve containers from the first row where containers are placed. It can also place and retrieve containers over a row if the second rows’ stack is one
higher than in the row in front.
- Containers can be picked up from the middle (3rd row) only if they are empty until 4 high. Containers stacked in 2nd and 1st row need to be 1 and 2 containers lower respectively. If higher than 4, 1st row needs to be empty to move containers.
- The capacity of the terminal is around 2000 containers (also following from the bay size). The scope of the terminal needs to be taken into account when designing the solution, as they restrict the ways in which the containers can get stacked at the terminal.
Requirements of the solution
To be able to create a better stacking method, a solution approach needs to be implemented. This solution approach has certain requirements that need to be fulfilled in order for it to be valid.
1. The model needs to run and output results, on which numerical experiments can be conducted in order to show the performance of the solution and to compare it to the current stacking policy. These outputs need to be checked whether they are valid and comparable to a real life situation.
2. Where possible, the solution design should be adaptable to the situation at other terminals, making it more relevant in the area of research, and more relevant for Cofano.
8
Key Performance Indicators
Key Performance Indicators (KPIs) are variables that measure the performance of research or a company. In order to measure the results of this research and to make the different policies of the research comparable they will be assessed on the following KPIs:
1. The percentage of relocation moves at the terminal (the percentage of all moves that are being performed being relocation moves).
2. The occupancy rate of the terminal (percentage of the terminal filled).
1.6 DELIVERABLES
Following the core problem and other parts of the previous chapter, the following deliverables are determined:
- A method for container stacking at the inland terminal. - An algorithm that incorporates this stacking method.
9
2. LITERATURE REVIEW
In this section, the literature that might be applicable to this research will be discussed. Papers that will be considered are papers that concern container stacking at terminals and look at how they apply to the problem at hand. As search engine Google Scholar4, and Web of Science5 will be used. The useful
information will be taken from the papers and written down below. This information is used to answer the research question: “What is known in the literature about container stacking, and what concepts can be taken from it?” This question is answered in Section 2.1, after that the knowledge from the literature is related to this research in Section 2.2. This reviewed literature is mainly intended to find stacking approaches that might be applicable to this research and secondly to give a theoretical framework to the stacking problem. Also, some concepts concerning container stacking will be introduced. The final conclusions from this chapter will be summarized in Section 2.3.
2.1 RELATED WORKS
(Expósito-Izquierdo, Lalla-Ruiz, Armas, Melián-Batista, & Moreno-Vega, 2015) mention that the minimization of the number of relocations lead to an increase in storage productivity for a terminal. This is applicable to the research, as the goal is to decrease the amount of relocation moves, and as mentioned decreasing the amount of relocation moves helps improve the storage productivity. The paper further proposes a way of stacking the containers taking into account their leave date, which is known for all containers in this case (Expósito-Izquierdo, Lalla-Ruiz, Armas, Melián-Batista, & Moreno-Vega, 2015). It might be possible to look at this method, and then adapt it to the specific situation at the terminal.
“The computational complexity of the Stacking Problem (SP) leads exact approaches to be rarely effective when tackling large cases. In this regard, heuristic algorithms have become highly competitive approaches for addressing relocation problems, providing high-quality solutions in real-world scenarios by means of short computational times.” (Expósito-Izquierdo, Lalla-Ruiz, Armas, Melián-Batista, & Moreno-Vega, 2015). According to the citation above it is unwise to try and find an optimal solution for certain dimensions of the problem, rather one would try to make a heuristic that approaches an optimal solution to decrease computational times.
According to (Zanakis & Evans, 1981), heuristics are desirable and advantageous in the following instances:
- When dealing with inexact or limited data
- When a simplified model is used (then there is already an inaccurate representation of the real problem).
- When a reliable exact method is not available. - Long computation times for the exact solution. - To improve the performance of an optimizer.
- Repeated need to solve the same problem frequently on real-time basis.
4https://scholar.google.nl/
10
The authors mention more options, but these are left out as they are not relevant to this research. The paper furthermore considers the features of a good heuristic, and how to use it. So, if the option of a heuristic is chosen then (Zanakis & Evans, 1981) can provide a guideline for setting up a valid heuristic. There are two heuristic approaches to solving a stacking problem according to (Expósito-Izquierdo, Lalla-Ruiz, Armas, Melián-Batista, & Moreno-Vega, 2015):
- Firstly, Event-based approaches where the block movements only occur when blocks enter or leave the system, thus rendering the stacking crane idle in the time periods in between. - Secondly there are Non-event-based approaches that aims at the shortest idle time for a crane.
The non-event-based approach has two advantages: the probability of further relocations is decreased, and the number of stacks with only well-located blocks is increased.
As reducing the amount of relocation moves at the terminal is the main goal of this research it is useful to look at options to implement a non-event-based approach.
(Dekker, Voogd, & Asperen, 2006) mention three main objectives of a stacking strategy: - The efficient use of storage space.
- The efficient and timely transportation from quay stack and further destination (and vice versa).
- The avoidance of unproductive moves.
This with the main inputs of stacking strategies being the information available at the terminal concerning the containers. A stacking method reducing relocation moves improves a terminal on all three aspects mentioned above. So, when the research proves successful the three main objective of stacking strategies will be improved.
(Gambardella et al., 1996) mention that the main policies to be planned in a ship terminal are: how to stack containers in the terminal in an optimal manner, and how to load / unload the containers in an optimal manner. Taking this into account, the authors state that the result of the loading and unloading is strictly related to the optimal container stacking in the yard.
“A good planning system must be able to evaluate the costs of a terminal operation sequence both in term of effective costs and in term of final state of the terminal because the quality of the final terminal state could increase or decrease the costs of the following operations.” (Gambardella et al., 1996). The authors mention that one should take into account both the cost of the current operation / handling that is being done, and the cost that will result from that handling. One should take into account the future cost of your current actions and look whether they outweigh each other.
(Gambardella et al., 1996) mention that the decision on where to place containers depends on many variables, with some of the more important ones being:
- The current occupation of containers in parking areas. - The destination of containers.
- The next carrier and the best position to load the containers. - The containers size.
11
This shows that there are many variables that influence the optimal way of container stacking. It is necessary to find the most important ones and make certain generalizations for the others, as not all variables can be incorporated into the algorithm.
(Rei & Pedroso, 2011) mention that placement decisions need to be made when the following moves occur:
- Release move: When an incoming item arrives at the warehouse.
- Relocation move: when an item that is not at the top of the stack needs to be delivered and containers on top need to be removed first.
- Remarshalling: an unforced relocation (no container needs to enter or leave the bay), where you replace a block to prevent more future relocations.
In (Rendl & Prandtstetter, 2013) the pre-marshalling problem is addressed. What is innovative in this research is that the study considers the leave date of containers not as a set date, but rather a date range. This is an advantage over several other studies as in the real life situation the leave date of containers is also often not yet known. Since a lot of the containers at the terminal also have no set leave date it is also relevant for this research. Unfortunately, the devised method in the paper not yet outperforms the current method (Rendl & Prandtstetter, 2013).
A detailed description of generating scenarios for simulation and optimization of container terminal logistics is discussed in (Hartmann, 2004). If problems are encountered during the research it is possible to look at this paper for reference, and for ideas to continue. Further ideas can be gathered from the paper (Kefi, 2007) where a basic random stacking algorithm is set up, and then further improvement steps to the model are implemented. The random stacking algorithm is an uninformed search algorithm, and the improved method an informed stacking algorithm. The improvements are based on the leave date of the containers and the number of relocation moves being performed. As mentioned by (Gharehgozli, Roy, & de Koster, 2016) pre-marshalling can reduce the numbers of relocations necessary at a terminal. One should pre-marshal a container when the container underneath it has a higher priority than the container on top. (Gharehgozli, Roy, & de Koster, 2016) also mention that the number of relocations at a terminal can be achieved by making a better initial stacking method. An option to reduce the number of relocations is a greedy heuristic algorithm. This algorithm places containers at an empty spot, or on a container with a lower retrieval priority. And if one of these piles is not available, then the container is stacked on a pile of containers with nearly the same retrieval time. The minimization of the relocations of a container stack while containers are getting retrieved is called a block relocation problem (BRP), which is proved to be NP-hard (Gharehgozli, Roy, & de Koster, 2016).
Loading problems deal with the storage of incoming items. Each item that arrives to the storage area must be assigned to a feasible location (Lehnfeld & Knust, 2014). Since departure times are usually unknown, the objective is to minimize the number of expected relocations (Lehnfeld & Knust, 2014).
12
[image:20.595.70.533.208.709.2]The Loading and Unloading problem is a combination of both. A combined problem both consider the loading and unloading at a storage area simultaneously. Arriving items are stored at the same time as items are retrieved from the storage area (Lehnfeld & Knust, 2014). At a terminal, containers need to be loaded and unloaded at the same time because it can occur that multiple transportation modalities arrive at the same time. Thus, a system that considers the loading and unloading problem of containers is beneficial to the solution design as it more comparable to the real life situation than just an unloading or loading problem.
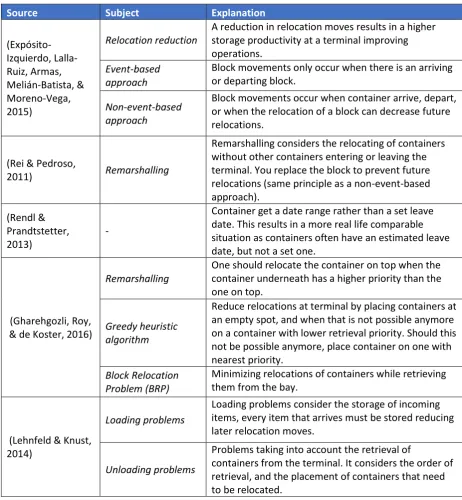
Table 1 summarizes the findings from the literature:
Source Subject Explanation
(Expósito-Izquierdo, Lalla-Ruiz, Armas, Melián-Batista, & Moreno-Vega, 2015) Relocation reduction
A reduction in relocation moves results in a higher storage productivity at a terminal improving operations.
Event-based approach
Block movements only occur when there is an arriving or departing block.
Non-event-based approach
Block movements occur when container arrive, depart, or when the relocation of a block can decrease future relocations.
(Rei & Pedroso,
2011) Remarshalling
Remarshalling considers the relocating of containers without other containers entering or leaving the terminal. You replace the block to prevent future relocations (same principle as a non-event-based approach).
(Rendl & Prandtstetter, 2013)
-
Container get a date range rather than a set leave date. This results in a more real life comparable situation as containers often have an estimated leave date, but not a set one.
(Gharehgozli, Roy, & de Koster, 2016)
Remarshalling
One should relocate the container on top when the container underneath has a higher priority than the one on top.
Greedy heuristic algorithm
Reduce relocations at terminal by placing containers at an empty spot, and when that is not possible anymore on a container with lower retrieval priority. Should this not be possible anymore, place container on one with nearest priority.
Block Relocation Problem (BRP)
Minimizing relocations of containers while retrieving them from the bay.
(Lehnfeld & Knust, 2014)
Loading problems
Loading problems consider the storage of incoming items, every item that arrives must be stored reducing later relocation moves.
Unloading problems
Problems taking into account the retrieval of
13
Combined problems: Loading and
Unloading problem (LU)
In Combined problems the Loading and Unloading
problem are both observed simultaneously. The arriving and departing containers are loaded and unloaded at the same time. When using this method, a higher reduction of relocation moves can be achieved compared to using just a Loading or Unloading
strategy Table 1: Summarizing table literature
2.2 CLASSIFICATION OF LITERATURE TO RESEARCH
The literature gave some background to the problems that arise at terminals, and on how difficult it is to find solutions to these problems. With the help of the literature, certain pitfalls can be avoided, and it gives a structure on how to approach the problem that will be addressed in this research.
The goal of the literature search was to find literature that can be used and adapted to the situation at the terminal. From the literature search, it is found that there are many different approaches to solving the different stacking problems that arise at terminals. Most of the cases discussed in the literature consider a single aspect of the stacking problem, as it often is too complicated to solve multiple problems at once. Thus, a choice needs to be made what problem to address in this research. Since Cofano has available data about the arrivals, handling, and leaving of containers it is useful to look at a Loading and Unloading (LU) method. When considering the loading problem, one tries to place the containers that are loaded in a bay in such a manner that reduces the future relocation moves when retrieving them. When the containers are correctly being placed this will result in a decrease in relocation moves, and thus optimizing processes at the terminal. When considering the unloading
problem, one retrieves the containers from storage, and when the relocation of containers is necessary, the containers get relocated minimizing the expected future relocations. Now, when containers simultaneously get loaded and unloaded, the Loading and Unloading (LU) problem is addressed.
What is known in the literature about such loading and unloading problems is limited. A wide variety of papers take into account the loading or unloading of vessels. But few consider the combination of both problems. The most widely applied method is assigning a priority (usually leave date or expected leave date) to a container, and stack / relocate them according to this leave date. This method of stacking ensures that containers that are estimated to leave at an earlier date are placed on top of containers that are estimated to leave later. With the available data it is possible to assign an expected leave date to the containers, making this approach feasible for this research. Since LU problems have not been widely addressed in the literature this research contributes to the database of literature concerning container handling operations.
14
feasible solution. And as the final goal of Cofano is to have an application running in real-time computational times might get too high to handle when applying an optimal solution approach. In this research it will be better to use a non-event-based approach. When using a non-event-based approach, the number of relocations is further reduced because of the container replacements in between outgoing and incoming blocks, when transportation modalities would be idle. As it is possible to give an estimated leave date one can remarshal the containers according to this date. However, since the research already takes into account the setting up and assessing the performance of an entire new stacking method, an event-based approach will be used, as the implementation of a non-event based approach is not feasible within the scope and time of this research.
There are many variables that influence the design of the solution approach, and the solution approach itself. One needs to consider these variables and see what generalizations need to be made for the process that is chosen to be optimized. Thus, the generalizations that need to be made for the loading and unloading process must be chosen such that they do not majorly influence the outcomes of the research. As the validity of it needs to be ensured.
As the terminal processes are hard to optimize in a generalised manner, the research might need to scope down more to the situation at the terminal. Making the problem easier to solve, but harder to adapt to other instances, and less relevant in the field of research.
2.3 CONCLUSION
Concluding the literature review, the goal was to learn what was known in the literature about the container stacking problem, and what could be taken from it and applied to this research. The literature review introduced a lot of concepts that gave background knowledge to the stacking problem. Furthermore, the literature review contained an analysis of these concepts and how they are applicable to this research.
The following things were concluded in the literature review:
- The problem considered in this research belongs to the class of Loading and Unloading (LU) problems.
- An event-based approach will be used.
- Examples of models / heuristics previously used, that can give insights into pitfalls and possible solutions.
15
3. SOLUTION APPROACH
In this chapter the following research question will be answered: “How can the solution approach be shaped, incorporating the available data?”. In order to answer this question firstly the method of data gathering is explained. In the Section 3.2, the gathered data is analysed and conclusions relevant for the solution design taken. In Section 3.3, the results of the data analysis are incorporated with previous sections of this report to shape the solution design.
3.1 DATA GATHERING
In this section the data analysis will be discussed. The data provided by Cofano was a database which needed to be loaded into pgAdmin46 in order to be able to find the applicable data. PgAdmin4 is an
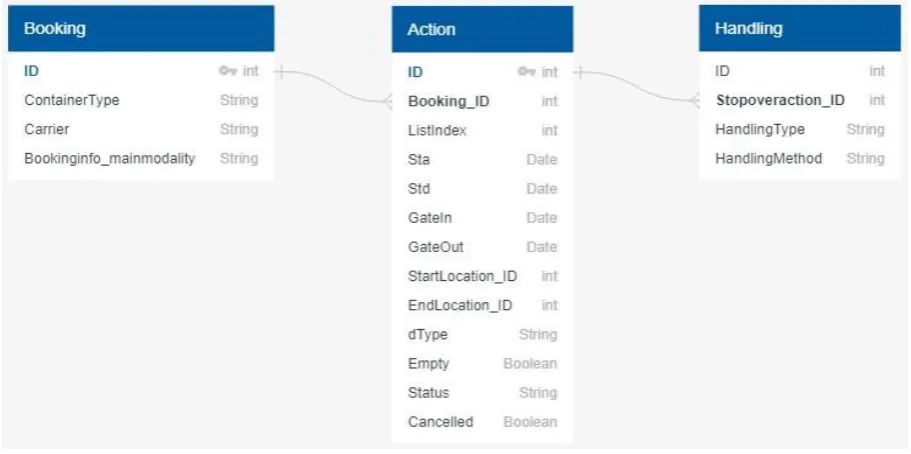
open source administration and development platform. Firstly, the relevant parts of the database needed to be connected to each other. The relevant parts of the database being the bookings of the containers, the associated actions with these bookings and the handlings performed on these actions. These databases were linked using PostgreSQL7, which is a database management system incorporated
into PgAdmin4. Once these three parts of the database were connected, relevant information was selected and then exported to Excel. In Figure 5, the database schema of the relevant parts of the database and their connection are displayed.
[image:23.595.70.526.360.587.2]Figure 5: Database Schema used to obtain data in pgAdmin 4.
By using different queries, the relevant parts of the database are gathered and exported to Excel where the data is analysed.
Data validity
There are a few issues with the data that is obtained from the database. There is some incorrectness and incompletion. The data has been gathered by employees logging their own actions, which is the cause for the incorrectness in the data because of human error. This incomplete and incorrect data
6https://www.pgadmin.org/
16
needs to be filtered from the other data. Mainly, the data considering the time it takes for a move to be completed is incorrect, as the terminal workers themselves need to log this and do not consistently do it properly. The most common time it took for a relocation move (moving a container on top of a container that needs to be retrieved and relocate it) was 1 second, which is not possible. Because of this, the data taking into account the time it takes for a move to be performed is considered incorrect and will not be used in this research.
The incomplete data differs per different data type (e.g. not for all containers an estimated arrival and leave date is known). So rather than making one dataset of complete data, the dataset will be altered on different criteria (e.g. when doing tests on the arrival and leave data of containers include all data that is complete on this criteria). This results in various smaller sets of data, rather than one large set. So, the data is pre-processed, with the aim to remove the following inaccuracies from the different data sets that will be used: Lack of available information, unfeasible transportation times, and small numbers of special cases irrelevant to the complete dataset.
3.2 DATA ANALYSIS
In this part the gathered data from Section 3.1 will be analysed. The different datasets used in this research incorporate: the movement of the containers throughout the terminal, the different container types and sizes, the estimated arrival and leave date of containers, and the relocation moves that are being performed at the terminal.
Traffic data
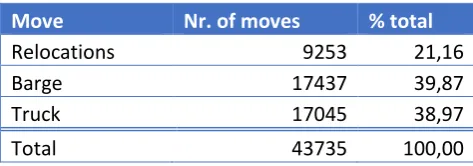
In the traffic data the general movement of containers at the terminal is analysed. This includes the number of different containers, moves, and the different container types that pass the terminal. The number of container moves at the terminal are displayed in Table 2.
Move Nr. of moves % total
Relocations 9253 21,16
Barge 17437 39,87
Truck 17045 38,97
[image:24.595.71.308.467.550.2]Total 43735 100,00
Table 2: Container movement at terminal over 364 days.
17
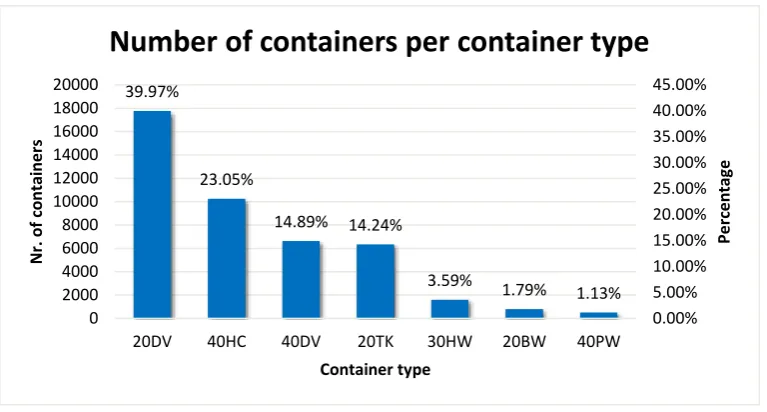
Figure 6: Number of containers per container type over 364 days.
In Figure 6, it can be seen that mostly 20 and 40 Ft containers are processed at the terminal with a relatively small number of 30 Ft containers. The different container types are relevant as they have repercussions for the number of containers that can get stacked in a bay. In Table 3 the individual properties of these container types are displayed.
Type Size (Ft) Specificity
20DV 20 Standard type
40HC 40 30 cm higher than DV
40DV 40 Standard type
20TK 20 Tank Container
30HW 30 30 cm higher and 10 cm broader than DV
20BW 20 N/A
[image:25.595.71.378.366.492.2]40PW 40 10 cm broader than DV
Table 3: The different container types with their sizes and specificities.
In Table 3 the different containers types with their specificities can be found. When looking at Table 3 and Figure 6 combined, it can be seen that most containers that are processed by the terminal are containers of the standard type. The different specificities of the container types bring no additional stacking constraints, as they can all be stacked onto each other. The only constraint that comes from the different type of container is the size. A 40 Ft container can get stacked on top of two 20 Ft containers, but not the other way around.
Estimated arrival and leave date of containers
The most important aspect of the data that is available is the estimated arrival and leave date of containers, and the comparison between these dates and the actual arrival and leave dates. With this data, priorities can be assigned to the containers, and the containers can then be stacked according to this priority. As not all the containers have an estimated arrival and leave date, just the containers that have complete information on these dates will be considered. This results in a dataset of 3023 containers over a time horizon of 364 days. Of these containers it is also known whether they were transported with a truck in between the arrival by barge and leave by barge, and by which carrier they were transported. 39.97% 23.05% 14.89% 14.24% 3.59% 1.79% 1.13% 0.00% 5.00% 10.00% 15.00% 20.00% 25.00% 30.00% 35.00% 40.00% 45.00% 0 2000 4000 6000 8000 10000 12000 14000 16000 18000 20000
20DV 40HC 40DV 20TK 30HW 20BW 40PW
Pe rc e n tag e N r. o f c o n tai n e rs Container type
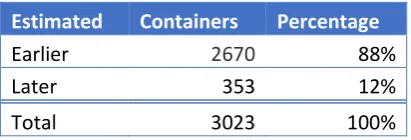
18
Estimated Containers Percentage
Earlier 2670 88%
Later 353 12%
[image:26.595.71.277.70.140.2]Total 3023 100%
Table 4: Containers that left before or after their estimated leave time.
As can be seen in Table 4, most containers (88%) leave before their estimated leave date. Only 12% of the containers leave after their estimated leave date. This means that when containers get stacked according to their estimated leave date, they probably leave the system earlier than expected. In Table 5, a comparison between the average estimated time until leave and the actual time until leave is displayed. The time barge in until barge out gives the hours that a container is expected to, and the actual time between, arrival by barge and leave by barge. The same estimate is displayed for the hours until truck move, only the actual time until a truck move is not known, as the data does not incorporate this aspect.
Average Time barge in until barge out (h) Time until truck move (h)
Terminal estimated 101:44:21 66:43:13
Terminal actual 94:54:50 N/A
Table 5: Comparison average time at terminal
From Table 5, it can be seen that the average time a container spends at the terminal (from the arrival by barge and the leave by barge) is quite accurate. On average the containers leave earlier than planned, as displayed in Table 4, and this also shows in Table 5. On average containers leave the terminal by barge about 7 hours earlier than estimated. This can be explained by the fact that the time of terminal departure of the container is logged once the container enters the barge. However, the barge does not immediately leave as more containers need to be loaded, causing some difference between estimated times and actual times. Furthermore, it can be seen that the estimated time until a truck move (truck picking up container, unloading it at company, and then returning it to the terminal) is lower than the container time at the terminal. Which is obvious, as the‘time barge in until out’ must be larger because most containers are picked up and transported by truck in between their barge moves. As to why a large part (88%) of the containers leave before their estimated leave time is that containers when estimating their barge leave time are always estimated at 15:00. As a normal working day takes place more hours before than after 15:00, most containers leave before this time. The containers are estimated in this manner as the time of arrival of a barge is uncertain, so they are rather estimated on a leave date than a leave time.
19
[image:27.595.71.474.77.505.2]Figure 7: Histogram of containers staying shorter at the terminal than estimated.
[image:27.595.70.473.310.542.2]Figure 8: Histogram of containers staying longer at the terminal than estimated.
Figure 7 displays the containers that leave the terminal earlier than estimated. Most containers leave [0:00 – 12:00] hours earlier. This indicates that the containers that leave earlier largely still leave on the same day as they were planned. The same holds for the containers that stay longer at the terminal than estimated, as can be seen in Figure 8. The difference in time that the containers stay longer or shorter at the terminal can thus also be explained by the fact that the arrival and departure times of a barge are estimates, and not precisely timed on the hour. Thus, it is safe to assume that the estimated times of arrival and departure are largely accurate to the day of arrival or leave.
Status Barge Barge Truck Truck
Estimate date 173 50% 6 2%
No estimate 174 50% 243 98%
Total 347 249
Table 6: Number of known estimated leave date, and unknown.
0.00% 20.00% 40.00% 60.00% 80.00% 100.00% 120.00% 0 100 200 300 400 500 600 700 800 Fre q u en cy
Bin hour interval
Histogram containers hrs shorter at terminal
Frequency Cumulative %
0.00% 20.00% 40.00% 60.00% 80.00% 100.00% 120.00% 0 10 20 30 40 50 60 70
-3:00 -6:00 -9:00 -12:00 -15:00 -18:00 -21:00 -24:00 More
Fre
q
u
en
cy
Bin hour interval
Histogram containers hrs longer at terminal
[image:27.595.72.369.686.750.2]20
In Table 6 it can be seen that for barge movements for 50% of the containers it is known beforehand when they need to leave again (an estimated leave date which largely corresponds to the actual leave date). However, for the truck movements the estimated leave date is 98% of the time unknown as can be seen in Table 6. The containers that have no information about their estimated leave date need to receive their own estimation based on the historical data. For the retrieval of the percentages in Table 6 only containers which have a “Next” or “Not_Started” status have been considered. This because containers that have already been processed by the terminal and receive a “FINISHED” status receive
an Etd (Estimated departure date) of the date that they have left the system and is thus wrongly displayed in the data set. Only containers that are yet to arrive to the terminal with an estimated leave date are relevant for the stacking of the container.
This estimation of containers with an unknown estimated leave date is done by taking the average hours a container stays at the terminal per carrier. Figure 9 displays these averages. The names of the carriers have been replaced with numbers to ensure the data confidentiality. The carriers that have transported 1-32 containers at the terminal over a time span of 364 days are disregarded in the data, as these numbers are too small to make their average viable. The containers that are transported by an unknown carrier will be given an estimated leave date according to the average time of the other carriers (1-13).
[image:28.595.74.516.349.581.2]Figure 9: Graph showing average time a container stays at terminal per carrier.
For example, when a container of carrier 3 arrives to the terminal, the estimated leave date of this container will be about 72 or 96 hours, depending on whether there is a truck move or not. Figure 9 shows that there is a difference between the estimated arrival and departure time of a container per different carrier. Thus, it is beneficial for the algorithm to consider the containers of their designated carriers with their corresponding times at the terminal. To clarify, the time arrival and leave barge is the time between the estimated arrival of a container at the terminal and the estimated leave by barge. The time until truck stopover is the time it takes on average between the arrival by barge and a possible planned truck move. Most containers arrive to the terminal, stay there until truck transportation, and then leave by barge again. Thus, most containers are transported by truck in between the arrival and leave by barge. Explaining why on average the hours until a truck stopover is shorter than the hours
0:00:00 24:00:00 48:00:00 72:00:00 96:00:00 120:00:00 144:00:00 168:00:00 192:00:00 216:00:00
Ti
me
Carrier
Average times per carrier
21
between arrival and leave barge. With these averages, an estimated leave date can be given to the containers that as of yet have an unknown one, and these containers can then be stacked according to this estimated leave date.
Number of relocations
[image:29.595.72.526.219.434.2]Another aspect that can be found in the data is the number of relocations that are performed. For each day it is known how many containers arrive, leave, and are relocated at the terminal. This information shows us the number of relocation moves compared to the number of containers entering and leaving the terminal per day. The data is shown in Figure 10.
Figure 10: Graph showing the containers entering and leaving the system on that day vs the number of relocations on that day.
In Figure 10 it can be seen that when the number of containers entering and leaving the terminal increases, the overall number of reshuffles performed also increases. Although the increase is not 1:1, as can be seen from the trendline, the relative number of relocation moves decrease when the total number of containers in and out increase.
Average in out reshuffles
Containers / day 42.42 49.72 24.23 Table 7: Average container movements per day.
In Table 7 one can see the number of containers that are processed at the terminal each day on average. It can be seen that on average there are more containers moving out of the terminal than into the terminal. This difference can be explained by the inconsistencies in the data set, and by containers that have not been fully processed at the terminal yet. But it can be assumed that all container that enter the system must also leave it again, thus the inflow of containers must be equal to the outflow of containers.
3.3 SOLUTION DESIGN
In this section the solution design will be explained. The previous parts of the report come together to create the solution design. With the solution design being what needs to be incorporated into the solution such that it reflects the real-world situation, and what can be incorporated into the solution
0 10 20 30 40 50 60 70 80 90
0 50 100 150 200 250
C o n tai n e rs r e lo cated
Containers in + out
Nr of containers in + out vs relocations
22
[image:30.595.74.524.108.439.2]that will improve the quality of it. The approach to setting up an algorithm is mapped in order to derive the algorithm in Section 4.
Figure 11: Flowchart displaying the loading and unloading of containers at the terminal .
Figure 11shows the process of a container arriving to or departing from the terminal. In process A, a container arrives to the terminal by truck or barge and needs to be transported to the bay where it needs to be placed. After the container arrives at the bay, the place of stacking needs to be determined. When the container has a known estimate leave date (Etd), the containers can get stacked according to this leave date. The containers that do not have an estimated leave date need to get one assigned. This can be done by assigning these containers estimated leave dates based on the historical data of the corresponding carrier transporting the container. The average times a container spends at the terminal corresponding to their carrier is shown in Figure 9.
Furthermore, the process of a leaving container is also mapped in Figure 11, process B. When a container needs to leave the system it first is checked whether other containers are stacked onto the container which needs to be retrieved. If it is the case that containers are stacked on top of the one that needs to be retrieved, these first need to be relocated.
23
need to be relocated. The relocating of containers also occurs in accordance to the estimated leave date of the container.
After the new stacking method is devised, and the possible generalisations are made, the writing of the algorithm can start. As most of the literature reports, it is quite hard to make a model that provides the optimal solution, as it has long computational times and is often complex. So, if this appears to be the case, a heuristic will be made to come up with a good solution. The devised algorithm considers the placement and relocation of the containers at the terminal reducing the total number of relocation moves.
All the constraints and specificities of the terminal need to be translated into the algorithm. Possibly algorithms or heuristics from the literature can be used and adapted to fit the situation at hand. The algorithm should be able to run and produce numerical results. After the algorithm is made and the results from the experiments are analysed, the performance and validity of the devised method will be known.
Validation
In order to ensure that the results from the model can be trusted, some form of validation is needed. If the model is not validated one cannot assume its outcomes to be true. In this research the model
will be validated by means of ‘black box validation’.
Black-box Validation
In black-box validation one looks at the results / data from the algorithm and compares it to the expected results stated before the experiment. It does not test the code itself of the algorithm, but just the outputs from the experiments with the finished algorithm. The expected outputs are set up according to the selected inputs into the experiment. The requirements for and the specificities of the algorithm are the foundation for the test cases. The goal of black-box testing is to determine whether the model is working as expected, and whether it meets the expectations set for it (Lozancic, 2017). Black-box validation is important for this research. It is used to ensure that the final outputs of the model are not illogical, ensuring validity.
3.4 CONCLUSION
In this chapter we wanted to find a design for the solution according to the data that is available and the situation at the terminal. The research questions that have been set up in Chapter 1 have been answered.
24
25
4. NEW STACKING METHOD
In Chapter 4, the new stacking method will be devised and implemented. The research questions that will be answered in this chapter are: “How will the new stacking method be shaped?” and “Is the implemented method of stacking valid?”. The answers to these questions can be found in Section 4.1 and 4.2, respectively. In Section 4.1, the different stacking policies are introduced and following in Section 4.2, the implementation of them is described. In Section 4.3, the conclusion and answers to the research questions are given.
4.1 ALGORITHM
This section described the algorithm that has been developed for the placement of containers at the terminal. The steps that the algorithm takes are described, together with the assumptions that are needed in order to be able to construct the algorithm.
Approach
The goal of this research and thus of the algorithm is to optimize container stacking operations at the terminal. The optimization of container stacking operations will be done by means of constructing an algorithm that determines where to place the containers at the terminal. An algorithm is “a set of
mathematical instructions or rules that, especially if given to a computer, will help to calculate an answer to a problem”8, thus by programming an algorithm a solution can be computed for the
container stacking problem.
The problem that is addressed in this research is the absence of a methodological stacking method. The algorithm will focus on minimizing the number of relocation moves at the terminal. Recall from the list of definitions that a relocation move is a move that relocates a container that is blocking the retrieval of another container. Relocation moves at a terminal are unproductive moves and all the time spend on them are wasted resources and time.
When constructing the algorithm, the containers are ordered and stacked based on their Estimated departure date (Etd). Their Etd is known, as the historical data of already processed containers is used as input. In the real life situation not all the Etd’s of containers are known. When this is the case, the average time a container spends at the terminal of their corresponding carrier can be used. As the algorithm does not consider the uncertainty of the leave date the results when applied in a real life situation might differentiate from our results. But as most Etd’s of containers are accurate it will not
have a large influence on the results. Another prerequisite for the working of the algorithm is that all containers receive an Etd.
For the algorithm the following 3 processes are defined: 1. The placement of arriving containers.
2. The retrieval of containers.
3. Special case: The processing of containers with a truck move.
In order to measure the performance of the stacking algorithm multiple policies will be set up. In this manner the performance of the devised algorithm can be compared, and it shows whether