OPTIMIZATION OF THE OPERATING
ROOM SESSION PLANNING WITHIN
DR. HORACIO E. ODUBER HOSPITAL
MASTER THESIS
Anneloes Herink
SCIENCE AND TECHNOLOGY FACULTY
HEALTH SCIENCES
EXAMINATION COMMITTEE
First supervisor Prof. dr. ir. E.W. Hans
Second supervisor Dr. C.G.M. Groothuis-Oudshoorn External supervisor Ir. S. Lucas – Information manager
ii
Management summary
Motivation & research objective
According to Andringa (2018) the OR session planning within Dr. Horacio E. Oduber hospital (HOH) is suboptimal. A consequence is that there is a peak in bed demand on certain days in the surgical nursing wards. A data analysis, which is part of this research, shows for both surgical nursing wards (surgical 3 and B4) a peak in bed demand at the beginning of the week and an off-peak load during the weekend. This research was carried out within the specialism general surgery to analyze whether it is possible to optimize the OR session planning such that there is a better distribution of bed occupation during the week. We thereby arrive at the following research objective:
To derive recommendations for optimizing the OR session planning within HOH such that the
peaks in bed demand in the surgical nursing wards can be decreased.
Research method
To write this research, the ‘Managerial Problem-Solving approach’ was used. Summary figure 1 gives an overview of the bed occupancy for ward B4. The current OR scheduling of HOH is explained using concepts known from the literature. A literature review is also being conducted to search for intervention options for HOH regarding the OR session planning. The Master Surgery Schedule (MSS) has been chosen to optimize the OR session planning. A Master Surgery Scheduling (MSS) allocates surgeons and surgical specialties to a specific OR time block, a day and a room, for a weekly planning horizon. In this research it was decided to exchange with specialists within the specialism general surgery.
iii Within HOH, the specialists have a fixed day to perform surgeries. In many cases this planning is not adhered to. Therefore, two separate datasets have been created and the analysis is conducted for the realization and the plan of HOH. The realization is what happened in practice, for the plan we assume that the planned sessions for specialist X are conducted by specialist X. For the analysis of the realization, three datasets have been made of the 1st of February 2018 until April 30, 2019. Ultimately dataset R-3 is used for the analysis of the current situation, this dataset included all surgeries which were only conducted in the morning sessions and the afternoon sessions and which were planned for general surgery. With this final dataset the exchanges between specialists can be made. The dataset for the plan of HOH consists of one dataset (P-1), where the exchanges between specialists can be made. In P-1 the data of 1st of February 2019 until April 30, 2019 is used. In this dataset the plan is made for the specialism general surgery which includes all surgeries conducted in the morning sessions and afternoon sessions, and which were planned for general surgery.
iv
Results
For both categories (realization and plan), the current situation is shown with three intervention options. The various options have been loaded into PFF and they are compared to the current situation. This research focused on the best intervention option. The three intervention options are listed below, these options are the same for the realization and the plan:
Option 1: General surgery E (Monday) exchange with General surgery C (Thursday). Option 2: General surgery A (Monday) exchange with General surgery C (Thursday). Option 3: Move General surgery A from Monday to Friday
Realization
The data which is used for the analysis of the realization is very small and cannot be optimally exchanged with specialists. Looking at the current situation and the three intervention options that were analyzed, the current situation will not be optimized. There is still an off-peak load during the weekends. The differences in beds between the peaks and off-peak loads for those options are three, four, and five beds. To compare the current situation and the three intervention options, the 5% and 95% quantiles (respectively the Lower Control Limit (LCL) and the Upper Control Limit (UCL)) of the distribution of the bed occupancy for the current situation and the intervention options are calculated.
v
Summary table 1 Overview of the differences in bed occupancy, LCL, UCL, and the bandwidth of the distribution of the bed occupancy of all options
Plan
This research has shown that the surgeries that are planned for general surgery are not always performed within general surgery. In this case we assume that the planned sessions for specialist X are conducted by specialist X. MSS intervention option 3 has the best distribution of beds, especially during the week. There is still an off-peak load during the weekends. The differences in bed occupancy between the peak and off-peak load for MSS intervention option 3 is five and six beds. The differences in bed occupancy between the peak and off-peak load for the MSS current situation, MSS intervention option 2, and MSS intervention option 3 is seven, eight, and nine beds. To compare the MSS current situation and the three MSS intervention options, the 5% and 95% quantiles (respectively the Lower Control Limit (LCL) and the Upper Control Limit (UCL)) of the distribution of the bed occupancy for the MSS current situation and the MSS intervention options are calculated.
MSS intervention option 3 is the best option compared to MSS intervention option 1 and MSS intervention option 2 since this option is the only option that shows a smaller bandwidth compared to the MSS current situation. There is a difference of two beds between MSS intervention option 3 and MSS current situation. Summary table 2 gives an overview of the differences in bed occupancy between the peaks and off-peak loads, LCL, UCL, and the bandwidth of the distribution of the bed occupancy of all MSS options.
Differences in bed occupancy LCL UCL Bandwidth
Current situation 3 and 4 4.39 10.95 6.56
Intervention option 1 3, 4, and 5 3.84 10.48 6.64
Intervention option 2 3 and 4 4.14 11.10 6.96
vi
Summary table 2 Overview of the differences in bed occupancy, LCL, UCL, and the bandwidth of the distribution of the bed occupancy of all MSS options
MSS intervention option 3 has been worked out in an MSS (see Summary figure 2). This is the best intervention option for the specialism general surgery within HOH.
Summary figure 2 Best intervention option MSS for the specialism general surgery within HOH
A step-by-step plan is created when HOH wants to exchange specialists of the aforementioned options. We suggest a step-by-step plan that contains the following main steps:
1. The OR committee should create a roadmap 2. Involve specialists and OR personnel
3. Implementation OR session planning 4. Evaluate the changes
Differences in bed occupancy LCL UCL Bandwidth MSS current situation 7 and 8 13.97 23.29 9.32
MSS intervention option 1 8 and 9 14.02 23.22 9.20
MSS intervention option 2 7 and 8 14.14 23.26 9.12
vii
Further research
Master Surgery Schedule: Our main recommendation is to implement an MSS. Currently, HOH does not use an MSS. To create more insight and order, an MSS would improve the OR session planning for the specialism general surgery. For optimizing this OR session planning, HOH should use and implement MSS option 3.
Master Surgery Schedule implementing within HOH: This research has shown that general surgery deviates a lot from the OR session planning. Before HOH wants to implement a change, it will first have to be examined why people deviate so much and if it is worth implementing an MSS within HOH.
viii
Managementsamenvatting (Dutch)
Aanleiding & doel van het onderzoek
Naar aanleiding van het onderzoek van Andringa (2018) is naar voren gekomen dat de OK-sessie planning niet optimaal is. Een gevolg van de suboptimale OK-sessie planning binnen het Dr. Horacio E. Oduber hospital (HOH) is dat er op bepaalde dagen een piek in de vraag naar bedden is op de snijdende verpleegafdeling. Een data-analyse, die onderdeel uitmaakt van dit onderzoek, toont aan dat er voor beide snijdende afdelingen (snijdend 3 en B4) een piek in beddenvraag is aan het begin van de week en een dal-bezetting van de bedden in het weekend. Er is een onderzoek uitgevoerd binnen het specialisme algemene chirurgie om te analyseren of het mogelijk is om de OK-sessie planning te optimaliseren zodat er een betere spreiding is van de bedden gedurende de week. Daarbij komen we bij het volgende onderzoeksdoel uit:
Een aanbeveling geven voor het optimaliseren van de OK-sessie planning binnen HOH, zodat de
piek in beddenvraag op de snijdende verpleegafdelingen wordt verminderd.
Onderzoeksmethode
ix
Samenvatting figuur 1 Overzicht van de bedbezetting voor afdeling B4 (n=2290, OR system HOH, 2018-2019)
Voor dit onderzoek is gebruik gemaakt van de Patient Flow Forecasting (PFF). Deze tool is ontwikkeld door Rhythm en kan de beddenvraag voorspellen. Voor elk blok telt PFF hoe vaak 𝑘 patiënten werden geopereerd 𝑘 ∈ {0,1, … }. Hiermee kan een empirische discrete kansverdeling bepaald worden. Hetzelfde zal worden uitgevoerd voor de ligduur van deze patiënten. Aangezien kansverdelingen niet bij elkaar opgeteld kunnen worden, wordt er gebruik gemaakt van convoluties.
Specialisten die werkzaam zijn bij het HOH hebben een vaste dag om operaties uit te voeren. In veel gevallen wordt er niet aan deze planning gehouden. Daarom zijn er twee verschillende datasets gemaakt en wordt de analyse uitgevoerd voor de realisatie en het plan van HOH. De realisatie is gebaseerd op wat er in de praktijk is uitgevoerd, bij het plan nemen we aan dat de geplande sessies voor specialist X ook worden uitgevoerd door specialist X.
Voor de analyse van de realisatie zijn er drie datasets gemaakt van 1 februari 2018 tot en met 30 april 2019. Uiteindelijk is dataset R-3 gebruikt voor de analyse van de huidige situatie.
0 5 10 15 20 25 30 35
Snijdende verpleeg afdeling - B4
x Dataset R-3 omvat alle operaties die in de ochtend- en middagsessie zijn uitgevoerd door algemene chirurgie en gepland waren voor algemene chirurgie. Uiteindelijk kan er met deze dataset gewisseld worden tussen de specialisten. De dataset voor het plan bestaat uit één dataset (P-1), hierin kunnen de wisselingen uitgevoerd worden tussen de specialisten. In P-1 worden de gegevens van 1 februari 2019 tot en met 30 april 2019 gebruikt. Deze dataset omvat alle operaties die in de ochtend- en middagsessie zijn uitgevoerd door algemene chirurgie en gepland waren voor algemene chirurgie.
Resultaten
Voor beide categorieën (realisatie en plan) wordt de huidige situatie weergegeven met drie interventie opties. De verschillende opties zijn ingeladen in PFF en vergeleken met de huidige situatie. Dit onderzoek richt zich op de beste interventie optie. De drie interventie opties staan hieronder vermeld, deze opties zijn hetzelfde voor de realisatie en het plan:
Optie 1: Wisseling van Algemene chirurgie E (maandag) met Algemene chirurgie C (donderdag) Optie 2: Wisseling van Algemene chirurgie A (maandag) met Algemene chirurgie C (donderdag) Optie 3: Verplaatsing van Algemene chirurgie A van maandag naar vrijdag
Realisatie
Er zijn uiteindelijk weinig gegevens gebruikt voor de analyse van de realisatie, hierdoor kan er niet optimaal gewisseld worden met specialisten. Kijkend naar de huidige situatie en de drie interventie opties, zal de huidige situatie niet geoptimaliseerd kunnen worden. Er is nog steeds een dal-bezetting van de bedden in het weekend. De verschillen in bedden tussen de pieken en de dal-bezetting voor de opties zijn drie, vier en vijf bedden. Om de huidige situatie en de drie interventie opties te vergelijken, zijn de 5% en 95% kwantielen (respectievelijk de onderste controlelimiet (LCL) en de bovenste controlelimiet (UCL)) van de verdeling van de bedbezetting voor de huidige situatie en de interventie opties berekend.
xi Er is onvoldoende verschil tussen de huidige situatie en interventie optie 3 om deze interventie toe te passen in de praktijk. Samenvatting tabel 1 geeft een overzicht van de verschillen in bedbezetting tussen de pieken en dal-bezetting, LCL, UCL en de bandbreedte van de bedbezetting van alle opties.
Samenvatting tabel 1 Overzicht van de verschillen in bedbezetting, LCL, UCL en de bandbreedte van alle opties
Plan
Dit onderzoek heeft aangetoond dat de operaties die gepland staan voor algemene chirurgie niet altijd worden uitgevoerd door algemene chirurgie. In dit geval nemen we aan dat de geplande sessies voor specialist X uitgevoerd worden door specialist X. MSS-interventie optie 3 heeft de beste verdeling van de bedden, vooral gedurende de week. Er is nog steeds een dal-bezetting tijdens het weekend. Het verschil in bedden tussen de piek en dal-bezetting voor MSS-interventie optie 3 is vijf en zes bedden. Het verschil in bedden tussen de piek en dal-bezetting voor MSS huidige situatie, MSS-interventie optie 1 en MSS-interventie optie 2 is zeven en acht bedden. Om de huidige situatie en de drie interventie opties te vergelijken, zijn de 5% en 95% kwantielen (respectievelijk de onderste controlelimiet (LCL) en de bovenste controlelimiet (UCL)) van de verdeling van de bedbezetting voor de huidige situatie en de interventie opties berekend. MSS-interventie optie 3 is de beste optie vergeleken met interventie optie 1 en interventie optie 2, omdat deze optie de enige optie is die een smallere bandbreedte heeft dan de huidige situatie. Er is een verschil van 2 bedden tussen deze twee opties. Samenvatting tabel 2 geeft een overzicht van de verschillen in bedbezetting tussen de pieken en dal-bezetting, LCL, UCL en de bandbreedte van de bedbezetting van alle MSS-opties.
Verschil in bedbezetting LCL UCL Bandbreedte Huidige situatie 3 en 4 4,39 10,95 6,56
Interventie optie1 3, 4 en 5 3,84 10,48 6,64
Interventie optie 2 3 en 4 4,14 11,10 6,96
xii
Samenvatting tabel 2 Overzicht van de verschillen in bedbezetting, LCL, UCL en de bandbreedte van alle MSS-opties
MSS-interventie optie 3 is uitgewerkt in een MSS (zie Samenvatting figuur 2). Dit is de beste interventie optie voor het specialisme algemene chirurgie binnen HOH.
Samenvatting figuur 2 Beste interventie optie MSS voor het specialisme algemene chirurgie binnen HOH
Er is een stappenplan geschreven voor HOH wanneer zij bovengenoemde opties willen implementeren binnen het ziekenhuis. Onze stappenplan bevat de volgende hoofdstappen:
1. De OK-commissie zou een stappenplan moeten opstellen 2. Specialisten en OK-personeel betrekken bij het plan 3. Implementeren van de OK-sessie planning
4. Evalueren van de veranderingen
Verschil in bedbezetting LCL UCL Bandbreedte MSS huidige situatie 7 en 8 13,97 23,29 9,32
MSS-interventie optie 1 8 en 9 14,02 23,22 9,20
MSS-interventie optie 2 7 en 8 14,14 23,26 9,12
xiii
Vervolgonderzoek
Master Surgery Schedule: Onze belangrijkste aanbeveling is om een MSS te implementeren. Momenteel gebruikt HOH geen MSS. Om meer orde en inzicht te creëren zou een MSS de sessie planning voor algemene chirurgie kunnen verbeteren. Voor het optimaliseren van de OK-sessie planning zou het HOH MSS-interventie optie 3 kunnen gebruiken en implementeren.
Master Surgery Schedule implementeren binnen HOH: Dit onderzoek heeft aangetoond dat algemene chirurgie veel afwijkt van de OK-sessie planning. Voordat HOH een wijziging wil implementeren zal er eerst onderzocht moeten worden waarom de specialisten van algemene chirurgie zoveel afwijken en of het de moeite waard is om een MSS binnen HOH te implementeren.
xiv
Preface
In front of you lies my master thesis. This thesis is my final step in finishing my master Health Sciences within the track “Optimization of Healthcare Processes” at the University of Twente.
After working for 5 years as a podiatrist, I quitted my job in June 2017. Thereafter, I started in September with the pre-master Gezondheidswetenschappen at the University of Twente. It was a great period in which I have learned a lot and met many nice people. For now, I am glad that 2 years after quitting my job I can finally present you the results of my master thesis.
I want to thank the dr. Horacio E. Oduber Hospitaal (HOH) for giving me the opportunity to perform my master thesis at Aruba and providing me with an inside look in the hospital. I would like to give a special thanks to my supervisor Stefan Lucas from HOH. Stefan helped me during the skype meetings and thereafter. I would also give a special thanks to Ricardo Dekker, he helped me a lot with the data I needed for this research. I loved the period in Aruba, and it was a great experience, which I would not want to have missed.
Furthermore, I want to thank my first supervisor from the University of Twente, Erwin Hans, for his guidance and enthusiasm. The meetings at school and calls via Skype were always supportive and valuable. I also want to thank my second supervisor from the University of Twente, Karin Groothuis, for her advice during this research. And last, but not least, I would like to thank Stephan Bras for his feedback and support from Rhythm during the weekly Skype sessions. I hope you enjoy your reading!
xv
Table of Contents
Management summary ...ii
Motivation & research objective ...ii
Research method ...ii
Results ... iv
Further research ... vii
Managementsamenvatting (Dutch) ... viii
Aanleiding & doel van het onderzoek... viii
Onderzoeksmethode ... viii
Resultaten ... x
Vervolgonderzoek ... xiii
Preface ... xiv
List of Abbreviations ... 21
1 Introduction ... 24
1.1 Research context: Dr. Horacio E. Oduber Hospital ... 24
1.2 Problem description ... 24
1.3 Research objective ... 25
1.4 Scope ... 25
1.5 Research questions ... 26
2 Context analysis ... 27
2.1 Process description ... 27
2.1.1 Patient population ... 27
xvi
2.1.3 Ward ... 29
2.2 Healthcare planning and control framework ... 31
2.3 Planning and control - strategic level ... 31
2.3.1 Production agreements ... 31
2.3.2 OR capacity ... 32
2.3.3 Specialties ... 33
2.3.4 OR personnel... 34
2.3.5 OR committee ... 35
2.3.6 Capacity of beds ... 35
2.4 Planning and control - tactical level ... 35
2.4.1 OR session planning ... 35
2.4.2 Influences departments on the OR session planning ... 36
2.4.3 Influences OR session planning on the bed occupancy in the surgical nursing wards Fout! Bladwijzer niet gedefinieerd. 2.4.4 Capacity for emergency surgeries ... 37
2.4.5 Personnel staffing ... 38
2.4.6 Bottleneck tactical level ... 38
2.5 Planning and control - offline operational level ... 39
2.5.1 Three months up to three working days before OR day ... 39
2.5.2 Three working days up to 24 hours before OR day ... 39
2.5.3 24 hours before OR day (hospitalization day) ... 40
2.5.4 OR day ... 41
xvii
2.6 Planning and control - online operational level ... 42
2.6.1 Emergency surgeries ... 42
2.6.2 Cancellations ... 43
2.7 Performance analysis ... 43
2.7.1 Overview of the bed occupancy ... 43
2.7.2 Occupancy of beds per specialism per day ... 49
2.7.3 Sessions per specialism per weekday ... 51
2.7.4 Amount of surgeries per session per specialism ... 52
2.7.5 LOS of patients per specialism ... 53
2.8 Conclusion ... 54
3 Current OR scheduling HOH... 55
3.1 OR scheduling system ... 55
3.2 Advanced scheduling... 55
3.3 Allocation scheduling ... 56
3.4 OR policy ... 56
3.5 Conclusion ... 57
4 Intervention options ... 58
4.1 Literature OR scheduling ... 58
4.2 Options OR session planning ... 58
4.3 Chosen intervention option ... 59
4.3.1 Master Surgery Scheduling ... 59
4.4 Conclusion ... 61
xviii
5.1 Background information ... 62
5.2 Input data ... 63
5.3 Results ... 66
5.3.1 Current situation ... 67
5.3.2 Results of the realization ... 70
5.3.3 Intervention options realization ... 73
5.3.4 Results of the plan ... 78
5.3.5 Intervention options plan ... 82
5.4 Best intervention option ... 85
5.5 Conclusion ... 87
6 Implementation ... 90
6.1 OR session planning ... 90
6.2 Step-by-step plan ... 90
6.3 Conclusion ... 92
7 Conclusions ... 93
8 Discussion... 99
8.1 Strengths ... 99
8.2 Limitations ... 99
8.3 Contribution to practice and literature ... 100
8.4 Further research ... 100
References ... 102
Appendix A – Healthcare planning and control framework ... 104
xix
Appendix C – Overview bed occupancy per day for ward surgical 3 and B4 ... 107
Bed occupancy surgical 3 ... 107
Bed occupancy B4 ... 111
Appendix D – Planned and performed surgeries per specialism ... 115
Appendix E – Surgeries, sessions, LOS per specialist ... 116
Surgeries per specialist ... 116
Sessions per specialist ... 117
LOS per specialist ... 119
Appendix F – Descriptive statistics of the bed occupancy ... 121
Current situation ... 121
Intervention option 1 ... 122
Intervention option 2 ... 123
Intervention option 3 ... 124
MSS current situation ... 125
MSS intervention option 1 ... 126
MSS intervention option 2 ... 127
MSS intervention option 3 ... 128
Appendix G –Realization 1, 2, and 3 ... 129
Peak and off-peak load realization 1 ... 132
Peak and off-peak load realization 2 ... 133
Peak and off-peak load realization 3 ... 134
Appendix H – Intervention options 1, 2, and 3 of the realization ... 136
xx
Intervention option 2 ... 140
Intervention option 3 ... 143
Appendix I – MSS intervention options 1, 2, and 3 ... 145
MSS intervention option 1 ... 145
MSS intervention option 2 ... 147
21
List of Abbreviations
AZV (Algemene Ziektekosten Verzekering) Basic insurance (health insurance)
Closed bed A bed that is physically there but there are no
personnel scheduled to support it CSSD (Central Sterile Supply Department) Sterile department
Designated ward The intended ward for a patient
Elective patient Scheduled patient requiring non-urgent care
ED (Emergency Department) A medical treatment facility specializing in emergency medicine
Emergency patient Unscheduled patient requiring urgent care
Electronic Medical Record (EMR) A software application in which medical record data of the patient is stored in digital form and made available
FCFS (First Come First Serve) policy The first patient will be served first
FIN (Financial Identification Number) A patient gets a unique number for every hospitalization at the hospital
HOH Dr. Horacio E. Oduber Hospital
Inpatient A patient admitted to one of the wards in the
hospital
Intake The moment a patient arrives at the hospital
on the day of the treatment/surgery
22 LOS (Length of Stay) The amount of time (days/hours) a patient
occupies a bed
MRN (Medical Record Number) Every patient has a unique MRN MRSA (Methicillin-Resistant Staphylococcus
Aureus)
A bacterium
MSS (Master Surgery Schedule) The schedule assigning blocks in a specific OR to a specific specialty
Opened bed A bed for which supporting personnel is
scheduled on wards
OR (Operating Room) The room equipped for performing surgeries. The medical equipment available differs per OR
OR schedule The schedule assigning patients, specialists,
staff, and equipment to an operating room Outpatient A patient that is not admitted to one of the
wards in the hospital
PACU (Post Anesthesia Care Unit) A unit designed to provide care for patients recovering from general anesthesia, regional anesthesia, or local anesthesia
PFF (Patient Flow Forecasting) A tool which is used for the analysis, created by Rhythm
POS (Pre-Operative Screening) Screening for patients before they are getting scheduled for surgery
23 SEPT (Shortest Expected Processing Time) The scheduling algorithm in which the
shortest expected duration is scheduled first
Ward A facility inside a hospital that is dedicated to
24
1
Introduction
This research is conducted at the Horacio E. Oduber Hospital in Aruba to derive recommendations for optimizing the OR session planning such that the peaks in bed demand at the surgical nursing wards can be decreased. This chapter describes the research context (Section 1.1), problem description (Section 1.2), research objective (Section 1.3), scope (Section 1.4), and the research questions (Section 1.5).
1.1 Research context: Dr. Horacio E. Oduber Hospital
In 1977, the Dr. Horacio E. Oduber Hospital (HOH) was founded in Aruba. Aruba is an island in the Caribbean Sea, and it is part of the kingdom of the Netherlands. It has over 116,000 citizens and a surface of 180 square kilometers (CIA, 2018). The HOH is the only hospital on this island. There are more than 900 employees and about 70 medical specialists working in this hospital. Every year, approximately 10,000 patients are admitted in the hospital. Furthermore, the hospital has a capacity of six operating rooms (ORs), 172 nursing beds, and offers all major medical specialties such as Gynecology, Urology, and General Surgery. In the year 2014, HOH started the project ‘Hunto Miho’, which means ‘better together’. With this project HOH wants to realize their ambition to become one of the best hospitals in the region (HOH, 2019).
1.2 Problem description
25
1.3 Research objective
The objective of this research is:
To derive recommendations for optimizing the OR session planning within HOH such that the
peaks in bed demand in the surgical nursing wards can be decreased.
This objective will be achieved by regulating the number of OR patients flowing into the surgical nursing wards and considering the length of stay of patients when scheduling elective surgical admissions.
1.4 Scope
This research focusses on the OR session planning within HOH and the patient flows through the admissions department, the ORs, and the surgical nursing wards (surgical 3 and B4). The scope of this research is defined as the elective surgical admission planning for the specialism general surgery within the OR session planning of HOH. Outside the scope of this research are operating materials and personnel. This research provides the hospital an intervention to address the problem with the OR session planning and thereby a decrease in the peaks in bed demand at the surgical nursing wards. We position this research in the healthcare planning and control framework of Hans, Van Houdenhoven & Hulshof (2012) at the tactical level of the resource capacity planning (Figure 1-1). The other levels (strategic, offline operational, online operational) of the resource capacity planning will be described shortly in Chapter 2.
26
1.5 Research questions
In order to fulfill the research objective, five research questions are defined.
1. What is the current influence of the OR session planning on the bed occupancy at the surgical nursing wards within HOH?
There are several influences of the OR session planning on the bed occupancy at the surgical nursing wards within HOH, we map these influences. Employees of several departments who are involved in the OR session planning are questioned. This question is answered in Chapter 2.
2. How is the current OR session planning of HOH organized?
The current OR session planning of HOH is explained using concepts known from literature. The OR scheduling system, advanced scheduling, allocation scheduling, and the OR policy is discussed. This question is answered in Chapter 3.
3. What are possible intervention options for the OR session planning within HOH?
A literature review is conducted to search for intervention options for HOH regarding the OR session planning. The literature of OR scheduling, options OR scheduling, and the recommended option will be discussed. This question is answered in Chapter 4.
4. What is the effect of the intervention for the peaks in bed demand at the surgical nursing wards within HOH?
The tool “Patient Flow Forecasting” created by Rhythm will be used to measure the effect of the intervention for the peaks in bed demand at the surgical nursing wards within HOH. The specialism general surgery will be analyzed. Within this specialism the specialists will be exchanged. This question is answered in Chapter 5.
5. What steps need to be taken by HOH to implement the most possible intervention option?
27
2
Context analysis
The current situation regarding the process, the OR, and the wards within HOH will be explained. This chapter describes the process description (Section 2.1), the healthcare planning and control framework (Section 2.2), planning and control - strategic level (Section 2.3), planning and control - tactical level (Section 2.4), planning and control - offline operational level (Section 2.5), planning and control - online operational level (Section 2.6), performance analysis (Section 2.7), and the conclusion (Section 2.8).
2.1 Process description
To understand the processes within HOH an overall view of the patient population (Section 2.1.1), the patient flow (Section 2.1.2), and the ward (Section 2.1.3) is given.
2.1.1 Patient population
28
Figure 2-1 Aspects of patient types in the patient population (Glerum, 2014)
[image:29.612.77.510.420.622.2]Since HOH is the only hospital on the island Aruba, it treats (almost) all patients. Data from 2017 and 2018 showed that around 10,000 patients underwent a surgery at HOH. The proportion elective versus emergency patients who had surgery in 2017 and 2018 is both 79% versus 21%. Figure 2-2 shows an overview of the elective versus emergency patients who had surgery in the year 2017 and 2018.
Figure 2-2 Overview elective versus emergency patients who had surgery within HOH (n=10,049, OR system HOH, 2017) (n=9,912, OR system HOH, 2018)
Elective 79% Unknown
0% Emergency
10%
Emergency in shift 11%
2017
Elective 79% Unknown
0% Emergency
9%
Emergency in shift 12%
29
2.1.2 Patient flow
[image:30.612.77.535.268.484.2]The patient flow through a hospital depends on the unique characteristics of the patient. Emergency patients usually enter the system through an emergency department. Elective patients usually enter the system through an outpatient clinic. All elective patients who have surgery visit the pre-operative screening and admission planners before surgery. Within HOH, in most cases the patients are placed in a bed the day before surgery. After surgery, patients always visit the recovery before arriving back at the ward. Figure 2-3 is a graphical representation of the different patient flows, where S = surgical specialty, and M = Medical specialty.
Figure 2-3 Patient flow through the system within HOH (S=Surgical specialty, M=Medical specialty)
2.1.3 Ward
30
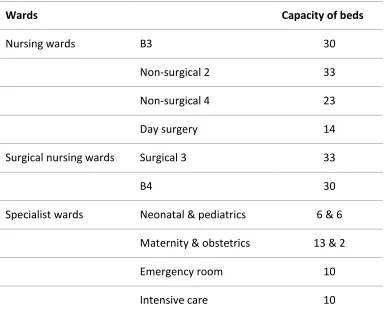
Table 2-1 Overview wards HOH
Wards Capacity of beds
Nursing wards B3 30
Non-surgical 2 33
Non-surgical 4 23
Day surgery 14
Surgical nursing wards Surgical 3 33
B4 30
Specialist wards Neonatal & pediatrics 6 & 6 Maternity & obstetrics 13 & 2
Emergency room 10
Intensive care 10
There is a difference between ‘opened’ beds and ‘closed’ beds. A bed is open when it is staffed,
which means that personnel is scheduled to attend that bed. A bed is closed when the bed is physically present but is not staffed. In this research beds refer to ‘opened’ beds.
Inflow of the wards: When a patient leaves the OR, it almost always needs a bed on a specific ward. This is the patient ‘designated ward’. On the day of surgery (or the day before surgery) a patient can be assigned to a bed. From this moment, the bed is no longer available for other patients. The hospital has control over the inflow of elective patients through the admission planning, the surgeon scheduling, and the bed planning.
31
2.2 Healthcare planning and control framework
The healthcare planning and control framework of Hans, van Houdenhoven & Hulshof (2012) will be used as a tool to map the planning and control decisions regarding the OR session planning within HOH. A short explanation of the healthcare planning and control framework is given in Appendix A.
The resource capacity planning on different hierarchical levels will be discussed in the upcoming sections (the strategic level (Section 2.3), tactical level (Section 2.4), offline operational level (Section 2.5), and online operational level (Section 2.6)). Since this research focusses on the tactical level of the resource capacity planning, this level will be described in detail. The other levels of the resource capacity will be discussed shortly. The other three managerial areas fall outside the scope of this research.
2.3 Planning and control - strategic level
This section describes the planning and control decisions of HOH regarding the strategic level. The production agreement (Section 2.3.1), OR capacity (Section 2.3.2), specialties (Section 2.3.3), OR personnel (Section 2.3.4), OR committee (Section 2.3.5), and the capacity of beds (Section 2.3.6) will be discussed.
2.3.1 Production agreements
The Algemene Ziektekosten Verzekering (AZV) is a basic insurance (health insurance) that applies to every resident in Aruba. The role of the AZV is to implement the Landsverordening AZV. This means that medical expenses (e.g. general practitioner, specialist, physiotherapy, dentist, and hospital admission) are reimbursed for everyone who is registered as a resident of Aruba. AZV is cooperating with all the aforementioned care providers.
32
2.3.2 OR capacity
HOH has six ORs, the sizes of the ORs are between 26.5m2 and 41m2. In 2021, when the rebuilding is finished, the sizes of the ORs will be between 32m2 and 43m2. A short explanation of the specialties per OR is given:
• OR1: Neurosurgery, general surgery, and gynecology.
• OR2: Ear Nose Throat (ENT), and gynecology.
• OR3: Urology, general surgery, and pain treatment.
• OR4: General surgery, trauma, and plastic surgery.
• OR5: Orthopedic and urology.
• OR6: Ophthalmology, plastic surgery, and general surgery.
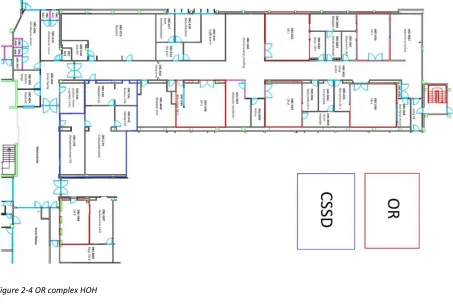
[image:33.612.76.529.374.681.2]All the ORs can serve as an emergency room. OR6 is an outpatient OR, the smallest elective surgeries take place in this OR. Figure 2-4 shows an overview of the OR complex within HOH.
33 During an OR day, the personnel and performing specialists need to be present at 7:00 a.m. They can prepare so that the first surgery can start at 7:30 a.m., which is the beginning of the OR session. The end of the OR session is at 2:30 p.m., the end of the working day is at 3:00 p.m. In this way they have time to finish some activities and change clothes. During the day, the personnel and performing specialists have two lunchbreaks of 15 minutes. This is between the surgeries and the OR team decides when these lunchbreaks take place. Sometimes, two sessions are planned on one OR day. In this case the OR day is split up between a morning session and an afternoon session.
The morning session starts at 7:30 a.m. and ends at 11:00 a.m. The afternoon session starts at 11:00 a.m. and ends at 2:30 p.m. Both sessions consist of 210 minutes. Concluding: an OR day has a capacity of 390 minutes in total. Table 2-2 shows a summary of the OR capacity.
Table 2-2 Summary OR capacity HOH
2.3.3 Specialties
HOH has several specialties who use the OR capacity. Table 2-3 shows a summary of the specialists using the OR capacity. Per specialty the number of specialists is indicated. Most specialists are independent, except for four gynecologists and two urologists. These six specialists are in pay of HOH. The pain treatment is performed by a neurologist.
Period From To Total (minutes)
OR day 7:00 a.m. 3:00 p.m. 480
OR session 7:30 a.m. 2:30 p.m. 420
Morning session 7:30 a.m. 11:00 a.m. 210
Lunchbreak Between surgeries 30 (2*15)
Afternoon session 11:00 a.m. 2:30 p.m. 210
34
Table 2-3 Specialties using the OR capacity within HOH
Specialties Number of specialists
General surgery 6
Neurosurgery 1
Cardiology 2
Gynecology 5
Plastic surgery 2
Ear, Nose, Throat (ENT) 2
Orthopedics 4
Urology 3
Ophthalmology 3
Pain treatment 1
2.3.4 OR personnel
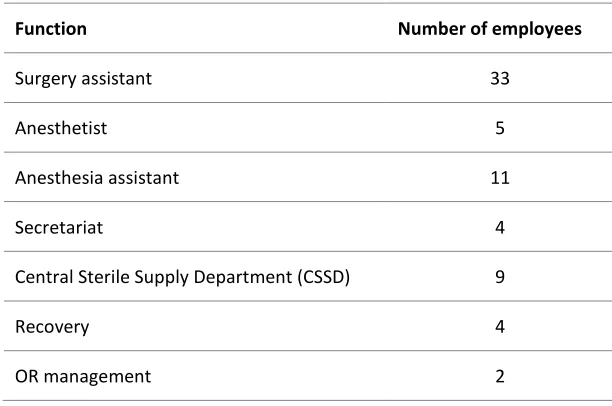
Next to the specialists mentioned before, other OR personnel are needed. Table 2-4 gives an indication of the OR personnel. These are all employed by HOH. Per function the number of employees is indicated.
Table 2-4 OR personnel HOH
Function Number of employees
Surgery assistant 33
Anesthetist 5
Anesthesia assistant 11
Secretariat 4
Central Sterile Supply Department (CSSD) 9
Recovery 4
35
2.3.5 OR committee
HOH has an OR committee. This committee makes decisions of different hierarchical levels regarding the OR complex. The OR committee represents all stakeholders of the OR. The goal of this committee is to treasure the quality and quantity of the services within the OR complex. Table 2-5 shows the members of the OR committee.
Table 2-5 Members OR committee HOH
Members OR committee
Cluster manager General surgeon
OR manager Plastic surgeon
OR manager assistant Anesthetist
Orthopedic surgeon Anesthesia assistant
2.3.6 Capacity of beds
Normally, HOH has six nursing wards and a capacity of 172 beds. Nowadays, the capacity of beds is 148. The reason that there are temporarily 148 beds is because of the rebuilding of the hospital. In 2021, when the rebuilding is finished, the nursing bed capacity will be 172 again. The capacity of beds of the wards is given in Table 2-1.
2.4 Planning and control - tactical level
This section describes the tactical decisions of HOH concerning the OR session planning. The OR session planning (Section 2.4.1), influences departments on the OR session planning (Section 2.4.2), capacity for emergency surgeries (Section 2.4.3), personnel staffing (Section 2.4.4), and the bottleneck tactical level (Section 2.4.5) will be discussed.
2.4.1 OR session planning
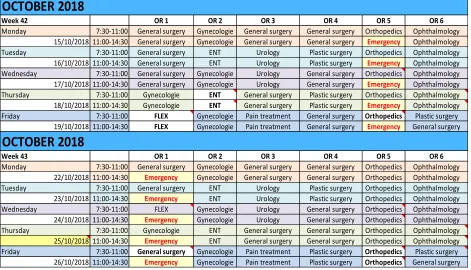
36 Besides fixed sessions, there are flex sessions in the OR session planning. These flex sessions are not dedicated to a specialist, which means multiple specialists can make use of the same session. When a specialist wants to make use of the flex session outside the regular OR session, he/she can send a request to the OR planner. When a specialist is absent during his/her OR session, the session becomes a flex session. Figure 2-5 shows an example of the current OR session planning of HOH.
Figure 2-5 Example OR session planning HOH October 2018
2.4.2 Influences departments on the OR session planning
Outpatient clinic: When a patient needs to have surgery, the patient must make an appointment. The outpatient clinic does not make appointments and it cannot be checked in the system since the specialists schedule the surgeries themselves. In practice, many patients wait with making an appointment instead of making it immediately. This in turn has consequences for the pre-operative screening and ultimately the OR session planning (with the cancellation of the surgery as a result).
OCTOBER 2018
Week 42 OR 1 OR 2 OR 3 OR 4 OR 5 OR 6
Monday 7:30-11:00 General surgery Gynecologie General surgery General surgery Orthopedics Ophthalmology 15/10/2018 11:00-14:30 General surgery Gynecologie General surgery General surgery Emergency Ophthalmology Tuesday 7:30-11:00 General surgery ENT Urology Plastic surgery Orthopedics Ophthalmology 16/10/2018 11:00-14:30 General surgery ENT Urology Plastic surgery Emergency Ophthalmology Wednesday 7:30-11:00 General surgery Gynecologie Urology General surgery Orthopedics Ophthalmology 17/10/2018 11:00-14:30 General surgery Gynecologie Urology General surgery Emergency Ophthalmology Thursday 7:30-11:00 Gynecologie ENT General surgery Plastic surgery Orthopedics Ophthalmology 18/10/2018 11:00-14:30 Gynecologie ENT General surgery Plastic surgery Emergency Ophthalmology Friday 7:30-11:00 FLEX Gynecologie Pain treatment General surgery Orthopedics Plastic surgery
19/10/2018 11:00-14:30 FLEX Gynecologie Pain treatment General surgery Emergency General surgery
OCTOBER 2018
Week 43 OR 1 OR 2 OR 3 OR 4 OR 5 OR 6
Monday 7:30-11:00 General surgery Gynecologie General surgery General surgery Orthopedics Ophthalmology 22/10/2018 11:00-14:30 Emergency Gynecologie General surgery General surgery Orthopedics Ophthalmology Tuesday 7:30-11:00 General surgery ENT Urology Plastic surgery Orthopedics Ophthalmology 23/10/2018 11:00-14:30 Emergency ENT Urology Plastic surgery Orthopedics Ophthalmology Wednesday 7:30-11:00 FLEX Gynecologie Urology General surgery Orthopedics Ophthalmology 24/10/2018 11:00-14:30 Emergency Gynecologie Urology General surgery Orthopedics Ophthalmology Thursday 7:30-11:00 Gynecologie ENT General surgery General surgery Orthopedics Ophthalmology 25/10/2018 11:00-14:30 Emergency ENT General surgery General surgery Orthopedics Ophthalmology Friday 7:30-11:00 General surgery Gynecologie Pain treatment Plastic surgery Orthopedics Plastic surgery
37
Pre-operative screening: All patients who must be scheduled for surgery have to undergo a screening; this is called a pre-operative screening (POS). A patient is referred from the consultation with the specialist to the screening and takes his/her personal data. Upon arrival, the personal data will be collected by the POS and an appointment will be scheduled. The patient is screened and checked to see if he/she is healthy enough for anesthesia. After completion, there will be a stamp on the papers with information: ‘pre-good’, or ‘pre-op not good’.
If the POS is not completed, the relevant specialist will be contacted to agree on what needs to be done to be able to conduct surgery on the patient. An incomplete screening of a patient often requires additional insight from cardiologist (ECG), nephrologist (kidney specialist), or determining the blood result and blood group to be able to send the complete patient card to the admission for the planning of the procedure. In practice, when a patient needs to see a specialist for the check, the patient is often lost sight of at that moment. This has influences on the OR session planning.
Radiology: The radiology department provides imaging during operations. They need to know in advance how many patients will need imaging, to match the personnel. When there are not enough personnel, it has an influence on the OR session planning. In addition, they need to know how many hip and knee surgeries are conducted, for planning the control X-rays the next day.
Rehabilitation: The goal of HOH is to discharge all clinical patients between 9:00 a.m. and 10:15 a.m., in practice this is not always possible. In orthopedic patients, patients can only be discharged after they have received physiotherapy. The doctor of the ward must wait for the advice of the physiotherapist; until then the bed remains occupied.
2.4.3 Capacity for emergency surgeries
38 Every week, one OR is available for emergency surgeries. When the emergency OR is not available before 11:00 a.m., or the emergency OR is occupied, the elective program still needs to be interrupted for emergency patients with a high urgency level.
2.4.4 Personnel staffing
Table 2-6 gives an overview of which a standard OR team consists of. There are three exceptions for a standard OR team. 1) Neurosurgery; this specialism has two surgery assistants instead of three. 2) Orthopedics; this specialism has four surgery assistants instead of three. 3) Outpatient surgeries (OR6); have two surgery assistants and no anesthetist.
Table 2-6 Standard OR team HOH
Standard OR team Number of employees
Surgeon 1
Anesthetist 1
Surgery assistant 3
Anesthesia assistant 1
After the OR day (3:00 p.m.) there is a team available with the same composition as a standard OR team. This team is present for finishing the elective surgeries that overrun and for taking care of all emergency surgeries after 3:00 p.m. This team can go home when the last surgery is finished. However, after the team went home, it needs to be available until 7:00 a.m. for emergency surgeries. Besides this team, there is a back-up team for handling peak moments between 3:00 p.m. and 7:00 a.m.
2.4.5 Bottleneck tactical level
39 the weekend. At Thursday, you have some patients who still occupy a bed and you get new patients for a bed. Most people get discharged at Friday. The analysis of this data will be discussed in the performance analysis in Section 2.7.1.
2.5 Planning and control - offline operational level
This section describes the offline planning process of the elective surgeries within HOH. The three months up to three working days before OR day (Section 2.5.1), three working days up to 24 hours before OR day (Section 2.5.2), 24 hours before OR day (hospitalization day ) (Section 2.5.3), OR day (Section 2.5.4), and the planning process elective surgeries (Section 2.5.5) will be discussed.
2.5.1 Three months up to three working days before OR day
The planning process for elective surgeries starts when the specialist decides that a patient need to have surgery after a visit in the outpatient clinic. The patient will be sent to the department and gets an indication for the date of surgery. Before surgery, all elective patients need to undergo a POS.
When there are no particularities, the nurse from the POS sends the patient to the admission department. The secretary creates a Financial Identification Number (FIN) for the patient and register the patient in Chipsoft.
A FIN is linked with a Medical Record Number (MRN) and is unique for every hospitalization. Every patient has one MRN but can have multiple FIN numbers. Chipsoft is the software program HOH uses for scheduling surgeries.
When there are particularities during the POS, the nurse consults the specialist. The specialist tells what needs to be done, so that the surgery still can take place.
2.5.2 Three working days up to 24 hours before OR day
40 If the OR planner received all lists, the patient cards will be picked up at the admission department. The completeness of the information will be checked, and missing information will be added.
When all information is gathered and complete, the OR planner calculates the length of the OR program with help of the program Chipsoft. In Chipsoft, every surgery has its own code. The expected duration of a surgery is calculated by taking the average of the last 25 surgeries of the same surgery type of the performing specialist. Outliers are excluded in this case.
The duration of the program should not exceed 390 minutes to prevent overtime, this is including the changeover times. The planned changeover time is 9 minutes per changeover for all surgeries, there are exceptions such as surgeries who take place in OR6. In that case, the planned changeover time is 6 minutes. When the duration of the program is too long, or there is space left in the duration of the program, the OR planner discusses with the specialist what to do. If the duration of the program is acceptable, the OR planner sends the provisional program to all specialists in question and to the admission department. The deadline for sending the provisional program is two working days before the OR day at 12:00 p.m. In practice, this deadline is not always met.
For the sequence of the OR program, the OR planner consider the guidelines. Some surgeries must be planned first. The following surgeries are scheduled first, in order of priority: child patients, pregnant patients, patients with a metabolic disorder, and surgeries with the longest expected duration. The following surgeries are scheduled last: MRSA patients, and patients under local anesthesia.
2.5.3 24 hours before OR day (hospitalization day)
41 The employee of the admission department informs which patients are going to be hospitalized. The attendees check whether there are enough beds available to hospitalize all patients on the OR program.
When there are not enough beds available the specialist checks if there are more patients that can be discharged. When there are still too few beds available, the specialist informs the OR planner which patient should be removed from the OR program. The admission department calls the patient with the information that the surgery is cancelled.
Hereafter, the admission department calls the clinical patients to inform them about their hospitalization. The goal of the admission department is to call these patients before 10:00 a.m., since these patients needs to be hospitalized at 12:00 p.m. When all clinical patients are informed, the patients for day surgery are called. According to the OR regulations, the patients for day surgery need to be called two working days before the OR day at 2:00 p.m. This is not possible when the provisional program is only 24 hours before the OR day available.
When patients cancel their surgery, the admission department reports this to the OR planner. The OR planner can inform the specialist(s). The specialist and the OR planner try to schedule other patients instead of the cancelled patients, this is only possible if they receive the cancellations in time. After the schedule is adjusted, the OR planner sends the final program to the specialist(s), the admission department, and the nursing department the day before the OR day at 12:00 p.m.
2.5.4 OR day
During the OR day, the specialists perform surgery on the patients that are scheduled on the OR program. Information about the surgery is stored in Chipsoft, such as timestamps of patients entering and leaving the OR, and surgery duration.
2.5.5 Planning process elective surgeries
42
2.6 Planning and control - online operational level
This section describes the online operational decisions of HOH for monitoring the process and reacting to unforeseen events. The emergency surgeries (Section 2.6.1), and the cancellations (Section 2.6.2) will be discussed.
2.6.1 Emergency surgeries
Within HOH, there are two subgroups in types of emergency. The first group consists of all emergency cases that are performed inside the OR day. These emergency cases are between 7:00 a.m. and 3:00 p.m. and are called ‘emergency in OR day’ (‘spoed’). The second group consists of all emergency cases that are performed outside the OR day, weekend and holidays included. These emergency cases are called ‘emergency in shift’ (‘spoed in dienst’).
Most of the ‘emergency in shift’ cases take place in OR1 and OR5. These ORs are the largest and close to the entrance, which is easy to enter. HOH has four different priorities concerning emergency surgeries. Table 2-7 gives an overview of these four different priorities concerning emergency surgeries.
Table 2-7 Priorities concerning emergency surgeries within HOH
Urgency Subscription Surgery
Urgency A Life-threatening Surgery should start right away, with a maximum
waiting time of two hours
Urgency B Threatening irreversible condition Surgery should start within two to six hours
Urgency C Condition for which delaying the surgery can
cause function damage
Surgery should start within 24 hours
Urgency D Semi-urgent patients Surgery should start within 72 hours
43
2.6.2 Cancellations
In Section 2.5 the cancellations that appear when admissions call the patient are mentioned. These cancellations are known before the program is definitive. Sometimes there are cancellations that occur during the OR day, e.g. when a patient does not show up for hospitalization, or a patient is not sober. In this case the OR capacity which is reserved for the surgery cannot be used for that surgery. An option could be that the surgery which was initially scheduled after the cancelled surgery could be performed earlier. If this option is not possible, there is a gap in the schedule.
Another manner of cancellation a surgery is when the program overran, and the start of the surgery would be after 2:30 p.m. In that case, the specialist can put the patient on the request list and the OR planner tries to find an empty spot in another specialist’s session to conduct the
surgery. However, the usage of the request list is not mandatory, and it is up to the specialist if he/she wants to use this possibility.
2.7 Performance analysis
A performance analysis of the data is given, this will be used to give an overview of the peaks in bed demand per surgical nursing ward. Data of the 1st of February 2018 until April 30, 2019 is used for all the calculations. This section describes the overview of the bed occupancy (Section 2.7.1), occupancy of beds per specialism per day (Section 2.7.2), sessions per specialism per weekday (Section 2.7.3), amount of surgeries per session per specialism (Section 2.7.4), and the LOS of patients per specialism (Section 2.7.5).
2.7.1 Overview of the bed occupancy
44 Figure 2-7 gives an overview of the bed occupancy for the surgical nursing ward B4. These figures show the minimum and the maximum bed occupancy of the specific ward.
Figure 2-6 Overview of the bed occupancy for ward surgical 3 (n=2,290, OR system HOH, 2018-2019)
0 5 10 15 20 25 30 35
Surgical nursing ward - surgical 3
45
Figure 2-7 Overview of the bed occupancy for ward B4 (n=2,290, OR system HOH, 2018-2019)
Table 2-8 gives an overview of the maximum bed occupancy for ward surgical 3. The maximum capacity of 33 beds is occupied in 5 times during the period in the dataset, this is 1%. At Thursday, the maximum capacity of 33 beds is reached twice. To give more insight in the bed occupancy, the maximum capacity -1 is also given. For surgical 3 the capacity of 32 beds is occupied in 68 times during the period in this dataset. The bed occupancy is 32 or more in 16% of the time.
Table 2-8 Overview of the bed occupancy of the maximum capacity and the maximum capacity -1 for ward surgical 3
0 5 10 15 20 25 30 35
Surgical nursing ward - B4
MIN MAX Capacity
Amount of days
MAX capacity (33 beds)
MAX capacity (%)
MAX capacity -1 (32 beds)
MAX capacity -1 (%)
32 + 33 beds occupied (%)
Monday 65 0 0% 7 11% 11%
Tuesday 65 1 2% 13 20% 22%
Wednesday 64 1 2% 15 23% 25%
Thursday 65 2 3% 20 31% 34%
Friday 65 0 0% 10 15% 15%
Saturday 65 0 0% 2 3% 3%
Sunday 65 1 2% 1 2% 3%
46 Table 2-9 gives an overview of the maximum bed occupancy of B4. The maximum capacity of 30 beds is occupied in 164 times during the period in the dataset, this is 36%. At Mondays, Tuesdays, and Wednesdays the maximum capacity of 30 beds is reached 30 times. For example: on Monday 46% of the time the maximum capacity of 30 beds is occupied. To give more insight in the bed occupancy, the maximum capacity -1 is also given. For B4 the capacity of 29 beds is occupied in 69 times during the period in this dataset. The bed occupancy is 29 or more in 51% of the time.
Table 2-9 Overview of the bed occupancy of the maximum capacity and the maximum capacity -1 for ward B4
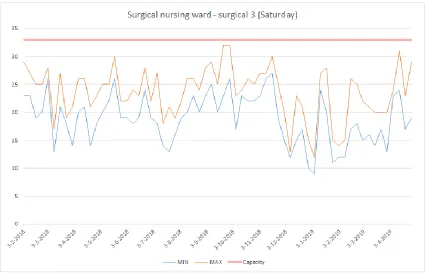
The aforementioned tables show a peak in bed demand at the beginning of the week, and an off-peak load at Saturday. For both wards the Thursdays and Saturdays will be shown in the graphs below. Figure 2-8 gives an overview of Thursday for ward surgical 3, and Figure 2-9 gives an overview of Saturday for ward surgical 3. Figure 2-10 gives an overview of Thursday for ward B4, and Figure 2-11 gives an overview of Saturday for ward B4. In Appendix C – Overview bed occupancy per day for ward surgical 3 and B4 an overview of all days for ward surgical 3 and ward B4 are given. Where an overview of all days for ward surgical 3 can be found in: Bed occupancy surgical 3. Where an overview of all days for ward B4 can be found in: Bed occupancy B4.
Amount of days
MAX capacity (30 beds)
MAX capacity (%)
MAX capacity -1 (29 beds)
MAX capacity -1 (%)
29 + 30 beds occupied (%)
Monday 65 30 46% 7 11% 57%
Tuesday 65 30 46% 11 17% 63%
Wednesday 64 30 47% 9 14% 61%
Thursday 65 28 43% 13 20% 63%
Friday 65 18 28% 10 15% 43%
Saturday 65 7 11% 6 9% 20%
Sunday 65 21 32% 13 20% 52%
47
Figure 2-8 Overview of the bed occupancy for ward surgical 3 at Thursday (n=335, OR system HOH, 2018-2019)
Figure 2-9 Overview of the bed occupancy for ward surgical 3 at Saturday (n=325, OR system HOH, 2018-2019) 0
5 10 15 20 25 30 35
Surgical nursing ward - surgical 3 (Thursday)
[image:48.612.72.499.376.653.2]48
Figure 2-10 Overview of the bed occupancy for ward B4 at Thursday (n=335, OR system HOH, 2018-2019)
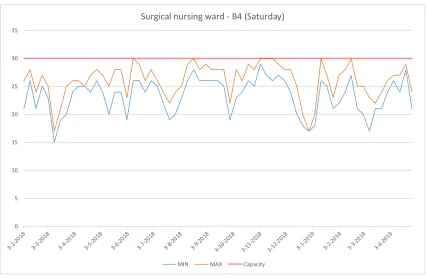
Figure 2-11 Overview of the bed occupancy for ward B4 at Saturday (n=325, OR system HOH, 2018-2019) 0
5 10 15 20 25 30 35
Surgical nursing ward - B4 (Thursday)
MIN MAX Capacity
0 5 10 15 20 25 30 35
Surgical nursing ward - B4 (Saturday)
[image:49.612.72.499.374.653.2]49 Patients of the following specialisms are placed in ward surgical 3: urology, orthopedics, gynecology, and general surgery. Patients of the following specialisms are placed in ward B4: general surgery. An overview of the bed occupancy of these 4 specialisms will be given in the following sections, since these patients belong to the surgical nursing wards. In practice, patients of other specialisms can go these wards, but these are not included.
2.7.2 Occupancy of beds per specialism per day
As mentioned in section 2.7.1, an overview of the following specialisms will be given for ward surgical 3: general surgery, gynecology, orthopedics, and urology. An overview of the specialism general surgery will be given for ward B4. The dataset contains the occupancy of beds for every hour per day. Data of the wards surgical 3 and B4 are used since these wards are inside the scope of this research. The patients that are selected are inpatients. Not all inpatients underwent a surgery, sometimes patients died, or their surgery was cancelled. However, these patients did occupy a bed, so they are included. Since many surgical patients enter through the Emergency Department (ED), it is not valid only considering the elective patients. Therefore, the non-scheduled OR patients (emergency) during 7:30 a.m. – 2:30 p.m. are also included.
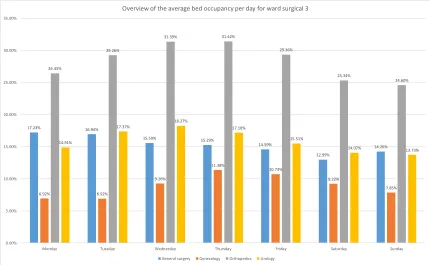
The average bed occupancies of the four discussed specialisms per day are shown in the figures below. Figure 2-12 gives an overview of the average bed occupancy for ward surgical 3. Figure 2-13 gives an overview of the average bed occupancy for ward B4. The average bed occupancy per day is calculated with the following formula:
𝐴𝑣𝑒𝑟𝑎𝑔𝑒 𝑏𝑒𝑑 𝑜𝑐𝑐𝑢𝑝𝑎𝑛𝑐𝑦 𝑝𝑒𝑟 𝑠𝑝𝑒𝑐𝑖𝑎𝑙𝑖𝑠𝑚 𝑝𝑒𝑟 𝑑𝑎𝑦
= ∑ ∑ 𝑡𝑖𝑚𝑒 𝑜𝑐𝑐𝑢𝑝𝑖𝑒𝑑 𝑏𝑒𝑑 𝑓𝑜𝑟 𝑠𝑝𝑒𝑐𝑖𝑎𝑙𝑖𝑠𝑚 𝑋 𝑜𝑛 𝑑𝑎𝑦 (𝑌 ⋅ 7 − 6) 24 ⋅ 𝑚
𝑚 𝑌=1 23
ℎ=0
50
Figure 2-12 Overview of the average bed occupancy per day for ward surgical 3 (n=2,290, OR system HOH, 2018-2019)
Figure 2-13 Overview of the average bed occupancy per day for ward B4 (n=2,290, OR system HOH, 2018-2019)
17.23% 16.94% 15.59% 15.29% 14.59% 12.99% 14.26% 6.92% 6.92% 9.26% 11.38% 10.73% 9.22% 7.85% 26.45% 29.26% 31.39% 31.42% 29.36% 25.34% 24.60% 14.91% 17.37% 18.27% 17.18% 15.51% 14.07% 13.73% 0.00% 5.00% 10.00% 15.00% 20.00% 25.00% 30.00% 35.00%
Monday Tuesday Wednesday Thursday Friday Saturday Sunday
Overview of the average bed occupancy per day for ward surgical 3
General surgery Gynecology Orthopedics Urology
82.57% 83.10% 81.74% 82.19% 79.25% 76.04% 79.11% 0.00% 10.00% 20.00% 30.00% 40.00% 50.00% 60.00% 70.00% 80.00% 90.00% 100.00% General surgery
Overview of the average bed occupancy per day for ward B4
[image:51.612.72.503.371.685.2]51 Orthopedics has the highest average bed occupancy per day for ward surgical 3. General surgery has the highest bed occupancy at Tuesday for ward B4.
2.7.3 Sessions per specialism per weekday
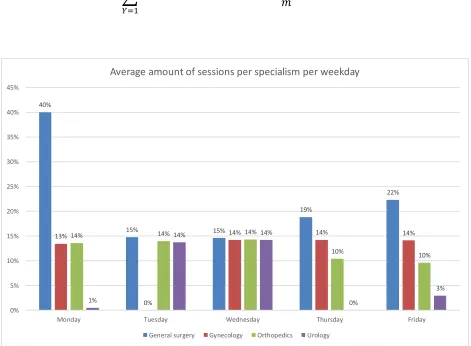
Figure 2-14 gives an overview of the average amount of sessions for the specialisms: general surgery, gynecology, orthopedics, and urology per weekday. The total amount of sessions per day are 12, since there are six ORs and there are two sessions per day. The performed surgeries of the discussed specialisms are calculated with the following formula:
𝐴𝑣𝑒𝑟𝑎𝑔𝑒 𝑎𝑚𝑜𝑢𝑛𝑡 𝑜𝑓 𝑠𝑒𝑠𝑠𝑖𝑜𝑛𝑠 𝑝𝑒𝑟 𝑠𝑝𝑒𝑐𝑖𝑎𝑙𝑖𝑠𝑚 𝑝𝑒𝑟 𝑑𝑎𝑦
= ∑𝑆𝑒𝑠𝑠𝑖𝑜𝑛𝑠 𝑝𝑒𝑟𝑓𝑜𝑟𝑚𝑒𝑑 𝑏𝑦 𝑠𝑝𝑒𝑐𝑖𝑎𝑙𝑖𝑠𝑚 𝑋 𝑜𝑛 𝑑𝑎𝑦 (𝑌 ⋅ 7 − 6) 𝑚
𝑚
[image:52.612.71.542.295.641.2]𝑌=1
Figure 2-14 Overview average amount of sessions per specialism per weekday (n=2,034, OR system HOH, 2018-2019)
General surgery has every day the highest average amount of sessions. The peak of the average amount of sessions is at Monday. 40% of all sessions on Monday are planned for general surgery.
40%
15% 15%
19%
22%
13%
0%
14% 14% 14%
14% 14% 14%
10% 10%
1%
14% 14%
0%
3%
0% 5% 10% 15% 20% 25% 30% 35% 40% 45%
Monday Tuesday Wednesday Thursday Friday
Average amount of sessions per specialism per weekday
52
[image:53.612.72.542.267.578.2]2.7.4 Amount of surgeries per session per specialism
Figure 2-15 gives an overview of the average amount of surgeries per session per specialism per day. The amount of surgeries per session per specialism per weekday is calculated with the following formula:
𝐴𝑣𝑒𝑟𝑎𝑔𝑒 𝑎𝑚𝑜𝑢𝑛𝑡 𝑜𝑓 𝑠𝑢𝑟𝑔𝑒𝑟𝑖𝑒𝑠 𝑝𝑒𝑟 𝑠𝑝𝑒𝑐𝑖𝑎𝑙𝑖𝑠𝑚 𝑝𝑒𝑟 𝑑𝑎𝑦
= 𝑁𝑢𝑚𝑏𝑒𝑟 𝑜𝑓 𝑠𝑢𝑟𝑔𝑒𝑟𝑖𝑒𝑠 𝑝𝑒𝑟 𝑠𝑒𝑠𝑠𝑖𝑜𝑛 𝑝𝑒𝑟 𝑠𝑝𝑒𝑐𝑖𝑎𝑙𝑖𝑠𝑚 𝑋 𝑜𝑛 𝑑𝑎𝑦 𝑌
(𝐴𝑚𝑜𝑢𝑛𝑡 𝑜𝑓 𝑑𝑎𝑦𝑠 𝑌 𝑖𝑛 𝑑𝑎𝑡𝑎𝑠𝑒𝑡) ⋅ (𝐴𝑣𝑒𝑟𝑎𝑔𝑒 𝑎𝑚𝑜𝑢𝑛𝑡 𝑜𝑓 𝑠𝑒𝑠𝑠𝑖𝑜𝑛𝑠 𝑝𝑒𝑟 𝑠𝑝𝑒𝑐𝑖𝑎𝑙𝑖𝑠𝑚 𝑝𝑒𝑟 𝑑𝑎𝑦)
Figure 2-15 Overview average amount of surgeries per session per specialism per weekday (n=5,048, OR system HOH, 2018-2019)
General surgery has the highest amount of surgeries per session at Tuesday, Wednesday, Thursday, and Friday. Urology has the highest amount of surgeries per session at Monday.
2.1
2.5
3.7
2.7
3.2
2.3
0.0
2.5 2.5 2.4
2.6
2.2 2.4
1.2
2.1 7.9
2.3
1.8
0.0
3.1
0.0 1.0 2.0 3.0 4.0 5.0 6.0 7.0 8.0 9.0
Monday Tuesday Wednesday Thursday Friday
Average amount of surgeries per session per specialism per weekday
53
2.7.5 LOS of patients per specialism
The average LOS of patients per specialism is calculated, to give more insight in the bed occupancy per specialism per weekday. Figure 2-16 gives an overview of the average LOS per specialism per weekday. The LOS per specialism per weekday is calculated with the following formula:
𝐴𝑣𝑒𝑟𝑎𝑔𝑒 𝐿𝑂𝑆 𝑜𝑓 𝑝𝑎𝑡𝑖𝑒𝑛𝑡𝑠 𝑝𝑒𝑟 𝑠𝑝𝑒𝑐𝑖𝑎𝑙𝑖𝑠𝑚 𝑝𝑒𝑟 𝑤𝑒𝑒𝑘𝑑𝑎𝑦 = 𝑆𝑢𝑚 𝑜𝑓 𝐿𝑂𝑆 𝑝𝑒𝑟 𝑠𝑝𝑒𝑐𝑖𝑎𝑙𝑖𝑠𝑚 𝑋 𝑜𝑛 𝑑𝑎𝑦 𝑌
[image:54.612.75.541.255.503.2]𝐴𝑚𝑜𝑢𝑛𝑡 𝑜𝑓 𝑠𝑢𝑟𝑔𝑒𝑟𝑖𝑒𝑠 𝑝𝑒𝑟 𝑠𝑝𝑒𝑐𝑖𝑎𝑙𝑖𝑠𝑚 𝑝𝑒𝑟 𝑑𝑎𝑦 𝑌
Figure 2-16 Overview average LOS per specialism per weekday (n=6,114, OR system HOH, 2018-2019)
The average LOS of patients is the highest for general surgery. There is a peak at Wednesday and an off-peak load at Monday. Gynecology has the lowest LOS of patients, there is not a peak or an off-peak load for this specialism.
4
8
10
8
7
3
3
3 2
3 3
5 4
4
6 7
5
3
9
5
0 2 4 6 8 10 12
Monday Tuesday Wednesday Thursday Friday
Average LOS per specialism per weekday
54
2.8 Conclusion
The first research question is discussed in this chapter.
What is the current influence of the OR session planning on the bed occupancy in the surgical
nursing wards within HOH?
An overview of the bed occupancy is given for both wards. In this overview 1% of the time the maximum capacity is reached for ward surgical 3, and in 36% of the time the maximum capacity is reached for ward B4. When calculating the maximum capacity -1 the bed occupancy is 32 or more in 16% of the time for surgical 3, and the bed occupancy is 29 or more in 51% of the time for ward B4.
There is a peak in bed occupancy at the beginning of the week, and an off-peak load at Saturday for both wards. A possible reason for the peak of bed demand at the beginning of the week is that specialists wants to conduct surgery in the beginning of the week, their reason is that more beds are available at the beginning of the week and they do not want to discharge patients during the weekend. Most people get discharged at Friday. An overview is given of the average sessions per specialism per day. The biggest peak of the week in the amount of sessions is for general surgery on Monday. 40% of all sessions on Monday are planned for general surgery. General surgery has the highest amount of surgeries per session at Tuesday, Wednesday, Thursday, and Friday. Urology has the highest amount of surgeries per session at Monday. The average LOS of patients is the highest for general surgery. There is a peak at Wednesday and an off-peak load at Monday. Gynecology has the lowest LOS of patients, there is not a peak or an off-peak load for this specialism.