Original citation:
Su, J. and Bloodworth, Alan G. (2016) Interface parameters of composite sprayed concrete linings in soft ground with spray-applied waterproofing. Tunnelling and Underground Space Technology, 59 . pp. 170-182. ISSN 0886-7798
Permanent WRAP URL:
http://wrap.warwick.ac.uk/81790
Copyright and reuse:
The Warwick Research Archive Portal (WRAP) makes this work by researchers of the University of Warwick available open access under the following conditions. Copyright © and all moral rights to the version of the paper presented here belong to the individual author(s) and/or other copyright owners. To the extent reasonable and practicable the material made available in WRAP has been checked for eligibility before being made available.
Copies of full items can be used for personal research or study, educational, or not-for-profit purposes without prior permission or charge. Provided that the authors, title and full bibliographic details are credited, a hyperlink and/or URL is given for the original metadata page and the content is not changed in any way.
Publisher’s statement:
© 2016, Elsevier. Licensed under the Creative Commons Attribution-NonCommercial-NoDerivatives 4.0 International http://creativecommons.org/licenses/by-nc-nd/4.0/ A note on versions:
The version presented here may differ from the published version or, version of record, if you wish to cite this item you are advised to consult the publisher’s version. Please see the ‘permanent WRAP URL’ above for details on accessing the published version and note that access may require a subscription.
Interface parameters of composite sprayed concrete linings in soft
ground with spray-applied waterproofing
Authors:
Jiang Su1
Alan Bloodworth2
Affiliations:
(1) Tunnels, AECOM, Croydon, UK
(2) School of Engineering, University of Warwick, UK
Abstract:
The presence of a spray-applied waterproofing membrane between the primary and secondary lining
layers is important to the behaviour of a composite sprayed concrete lined (SCL) tunnel in soft ground.
In order to confirm the feasibility of the composite shell lining concept, the structural adequacy of the
concrete-membrane interfaces under the effects experienced in a typical tunnel needs to be
investigated.
This paper presents a series of laboratory tests on samples cut from composite sprayed concrete panels,
to which uniaxial compression, direct tension and direct shear loadings are applied over both short-
and long-term timeframes under conditions of ambient atmospheric humidity. Test results show that
the interfaces are capable of resisting significant compression, tension and shear in both short- and
long-term. Failures under these actions should not occur in a typical shallow SCL tunnel, and a degree
of composite action between primary and secondary layers should be expected. Influence of substrate
roughness and membrane thickness on the measured interface properties has been quantified. Overall,
this investigation confirms the existence of composite action for composite sprayed concrete linings in
1
Introduction
Sprayed concrete lining (SCL) is an established tunnelling method used in many countries for the
creation of underground space (Kovári, 2003a, 2003b). Traditionally, SCL tunnels consist of a layer of
sprayed primary lining (considered as temporary works, not part of the permanent structure), a layer of
sheet waterproofing membrane and a layer of cast secondary lining, regarded as the permanent
load-bearing structure (Thomas, 2009; Institution of Civil Engineers, 1996). The tunnelling industry has
long expressed concern about over-excavation and material waste due to the primary lining being
treated as sacrificial in the long term (Duarte et al., 2012), and there have been rapid developments in
the UK over the last twenty years to tackle this issue.
One of these was the inclusion of the primary lining in the permanent structure, sometimes with
addition of a second sprayed layer, but known as a single shell lining (Grose and Eddie, 1996; Watson
et al., 1999). Although this solution was cost-effective to construct, long-term problems associated
with leaks and maintenance has pushed the industry back to including a waterproofing membrane.
This option, consisting of a permanent sprayed concrete primary lining, sheet or spray-applied
waterproofing membrane and sprayed or cast secondary lining, but with no adhesive and shear bond
assumed at the concrete-membrane interface, is called a double shell lining, and has been adopted for
several projects such as the A3 Hindhead Tunnel (Peynolds, 2008) and Crossrail (Su and Thomas,
2014) in the UK.
Whilst efficiency gains may be achieved with double shell linings compared to sacrificial primary linings for some cases, there is a desire for further improved lining thickness efficiency by utilising the
adhesive and shear bonds at the concrete-membrane interface. This option, consisting of a permanent
sprayed concrete primary lining, spray-applied waterproofing membrane and sprayed or cast
secondary lining, with assumption of a degree of adhesive and shear bond (“composite action”) across
the interfaces, is called a composite shell lining (Pickett and Thomas, 2011; ITAtech, 2013).
For the moment, there is still uncertainty about the properties of the concrete-membrane interface.
Therefore, there is scope for further investigation into the properties of the concrete-membrane
each lining configuration with particular regard to how short and long-term ground loading and water
pressure is shared between the lining layers is given in Table 1.
Table 1
Lining and interface loading scenarios for different SCL tunnel configurations
Lining
configuration
Composite
action between
layers
Load sharing assumptions
Short-term loading Long-term consolidation loading Long-term water pressure Single Shell Lining
N/A All on the
single layer
All on the single
layer
All on the single layer
Double Shell Lining
None All on the
primary
lining
Shared between two linings
All on the secondary lining
Composite
Shell Lining
Partial or full
composite
All on the
primary
lining
Shared between
two linings
Shared between two
linings
Until now, only a limited number of test results on interface properties with spray-applied
waterproofing membrane have been reported, most of which refer to an ethyl-vinyl-acetate (EVA)
based membrane (MasterSeal 345) under normal atmospheric moisture conditions (Verani and Aldrian 2010). Nakashima et al. (2015) presented flexural test results on two composite shell lining beams
with and without axial force under normal ambient humidity condition. No information has been given
with regards to the mechanical properties of the spray-applied waterproofing membrane interface.
Field measurements by Holter and Geving (2015) on an SCL tunnel in rock with spray-applied
waterproofing found the moisture content of the membrane to vary between 30% and 40%, determined
by the moisture properties of the concrete and the membrane, as well as the interfaces between the two
materials. Further research by Holter (2016) suggested that high moisture content in the membrane
paper, we have also assumed the membrane to be essentially dry (i.e. subject only to normal
atmospheric humidity) as the best estimate of conditions in typical soft ground tunnelling for two main
reasons. Firstly, the very low permeability of modern sprayed concrete, and extensive grouting
normally carried out to seal primary lining cracks prior to application of the membrane, would
substantially slow the rate of supply of moisture to the membrane. Secondly, the hotter temperature
inside the tunnel would draw moisture from membrane into the tunnel where it would evaporate into
the air. In the event of a structural crack occurring in the primary lining, groundwater could contact the
membrane and increase its level of saturation. However, this would be a localised effect not significant
to the tunnel as a whole provided the tensile bond between the membrane and the primary lining
exceeds the water pressure and thus prevents the membrane debonding from the primary lining and
allowing groundwater to contact a wider area of membrane.
Confirming the feasibility of the composite shell lining concept requires a thorough understanding of the fundamental properties of the concrete-membrane interfaces under conditions representative of
those in the actual tunnel and derivation of appropriate parameters for input into numerical models for
design. A testing programme has been carried out with these objectives, on samples cut from
composite shell test panels, including quantifying the impact of substrate roughness and membrane
thickness on interface properties. This paper reports the test methods and the results obtained and their
significance, referring to another EVA-based waterproofing membrane (TamSeal 800). This product
contains more than 75% by weight of EVA co-polymer, and its functional properties are expected to
be similar to other EVA-based membranes.
2
Loading conditions of the membrane interface in a composite SCL
structure
Behaviour of the primary and secondary linings, in particular the distribution of bending moment and
axial force, is affected not only by ground and water pressures but also the properties of the interface
between the layers. As a result of the global actions on the tunnel, the interface itself may experience
tension or compression, either of which may be in combination with shear, at different locations
An initial investigation into the behaviour of an idealised composite SCL tunnel under external
loadings was carried out using Finite Difference software FLAC. The model consists of two circular
rings in solid elements representing the primary and secondary linings, with an interface with normal
stiffness of 17 GPa/m and shear stiffness of 8.7 GPa/m (Verani and Aldrian 2010, Table 2 Specimen
0) assigned in between to represent the spray-applied membrane. Both solid and interface elements are
assumed elastic. Unequal vertical and horizontal loads at a ratio of 2:1 (1000 kPa : 500 kPa) were
applied, as shown in Figure 1(a), and Figure 1(b) shows the general form of the lining deformation
that resulted.
Ovalisation of the tunnel as shown in Figure 1(b) implies development of compressive stress in the
interface between the primary and secondary linings at the crown and invert, and tensile stress at axis
level. Relative shear between the lining layers will be greatest at the intermediate positions, although
the maximum interface shear displacement observed was less than 1 mm. Different loading conditions (e.g. greater value of K0) may change the lining deformation pattern and distribution and magnitude of
interface stresses, but the interface should still experience these three stress conditions at different
locations.
3
Laboratory tests and testing parameters
3.1 Laboratory tests and interface properties
In response to this fact, three types of laboratory test were conducted on samples cut from composite
sprayed panels: (a) uniaxial compression, (b) direct tension, and (c) direct shear. The interface
properties sought under each of these actions were peak and post-peak strengths, and short- and
long-term stiffnesses. Adequate interface peak strength and ductile post-peak behaviour give confidence
that the composite shell lining would be robust and maintain its integrity under ground loading, with
ductility important in resisting sudden loading changes, such as those caused by excavation in close
proximity or construction of cross-passages. There is an additional requirement on the tensile strength
that it should exceed the likely possible groundwater pressure, so that in the event of a localised crack
in the primary lining allowing water to reach the membrane, no debonding occurs which could allow
Interface stiffness values under all three actions are sought as input to numerical models to accomplish
tunnel analysis and design. The shear stiffness is key in determining the degree of composite action
between the primary and secondary linings, whilst the normal (compression and tension) stiffnesses
influence the amount of load that can be transferred between the primary and secondary linings at the
locations where the interface is under normal stress as described in the previous section.
Each test type was carried out under both short- and long-term loading. In the long term, the interface
may relax gradually, leading to a reduced apparent stiffness and degree of composite action for a
composite SCL tunnel. A term relaxation ratio is defined (for each loading condition) as the
long-term interface stiffness as a percentage of the short-long-term. 3.2 Testing parameters
The ranges of parameters for the tests under the three types of action given above are now described.
In compression, samples were loaded until failure and the peak stress recorded. From the
stress-displacement relationship, the first loading stiffness was obtained as a measure of the stiffness at low
load for input into a numerical model. In addition, samples were taken through unload-reload cycles
between approximately 10% and 50% of peak stress (once this was known) to ascertain the likely
degree of hysteresis and degradation of stiffness with stress at levels indicative of the maximum likely
to which the lining would be loaded in practice.
In the long-term compression test, confirmation was sought that the lining system could resist the
maximum theoretical full overburden pressure, and so sufficiently large stresses of 3 MPa, 6 MPa and
15 MPa (representing overburdens up to 750 m) were applied and each held for a period of time.
In the tensile tests, samples were loaded up to 0.6 MPa (representing a ground water head of 60 m
which exceeds the likely maximum in most soft ground tunnelling projects) to obtain the first loading
stiffness. The load was then cycled between 0.1 MPa and 0.6 MPa to explore any degradation of stiffness with cycles, before loading to failure to obtain peak stress. In the long term test, a stress of
0.5 MPa was applied to represent a depth below water table of 50 m, and held.
Direct shear tests were carried out under normal stresses of 250 kPa, 500 kPa and 750 kPa,
representing full overburdens on tunnels in the range 15-40 m below ground. Pickett & Thomas (2011)
lower strength may be adequate in cases of partial composite action, and the actual strength
requirement could be confirmed in a numerical model once the interface stiffness parameters are
understood, which is an aim of this paper. Samples were sheared to around 0.7 MPa shear stress to
obtain first loading shear stiffness, the stress reduced to 0.2 MPa and then samples taken through
progressively increasing stress cycles until peak stress is reached, to again explore stiffness
degradation and the impact of machine compliance. In the long term test, a shear stress of 1 MPa was
applied and held.
4
Procurement of test samples
4.1 Sample mix and spray
A contractor was commissioned to produce fifteen panel boxes, 800 mm×800 mm or 800 mm×1000
mm in size and 200 mm deep. Sprayed concrete mix specification and design are given in Tables 2
and 3 respectively. An EVA-based waterproofing membrane (TamSeal 800) was used. The spray was carried out at the contractor’s plant facility and the direction of all spray was perpendicular to the test
box (Figure 2) (BS-EN 14487-1, 2005).
Table 2
Mix specification for primary and secondary lining sprayed concrete
Mix Description Agg Size
(mm)
Cement
Type
Targeted
Slump
Targeted
90-day
Strength
20080778
P450 HP-PLA sprayed concrete
mix
8 CEM1 S3 40MPa
Table 3
Mix design for primary and secondary lining sprayed concrete
Materials DRY Batch Weights kg/m3
CEM1 Cemex- Rugby 450
0/4 MP Sand Cemex - Northfleet 1300
4/10 Gravel Cemex - Northfleet 550
WRA (N) Cemex – CP105 (ml) 2250
Target W/C Target Water/Cement Ratio 0.45
Steel fibre Dramix 40
Accelerator
Superplasticiser
Tamshot 800
TamCem 60
6% (weight of cement)
0.9% (weight of cement)
4.2 Sample panel specification
The primary layer was first sprayed to approximately half of the boxes’ depth and then finished in one
of three ways typically used in SCL tunnel projects (Figure 3): (i) as-sprayed with relatively rough
surface and fibers protruding; (ii) float finish (where the standard material is worked immediately after
spraying to give a smooth flat finish) and (iii) regulated finish. The latter was achieved by returning a
few days after primary lining spray and dry-spraying a finer, fiber-free material (in this case TamCrete
Topshot), without further working or smoothing. Regulated finish has been recommended by both a
designer and material supplier where spray-applied waterproofing membrane is to be applied, as it
enables application of a regular thickness of membrane without the need to work at height first to achieve a “plaster-smooth” finish to the primary lining (Crossrail, 2009; Dimmock et al., 2011). The
primary layer was cured for 28 days.
The membrane material is supplied as dry powder that is mixed with water using a dry-rotor machine.
The powder/water ratio is set to ensure full polymerisation, typically at 1.75:1. The membrane was
applied in two layers, the first coloured orange and the second applied a short while later coloured
white/grey, as recommended by Normet (2011) to enable greater quality control of the application.
Two target membrane thicknesses were aimed for in this project: (i) thin membrane (<=4 mm),
representing the ideal best practice; and (ii) thick membrane (>4 mm), representing a non-ideal
scenario of over-sprayed membrane. Achievable membrane thickness can be expected to relate to
layer achievable on a smoother surface. The membrane achieves initial set after only a couple of
hours, but was left for 48 hours to ensure complete curing before the secondary lining was applied.
A secondary sprayed concrete layer (the same fibre-reinforced mix as the primary lining) was then
applied directly to the membrane surface that had been dampened in accordance with manufacturer’s
recommendations. The secondary lining was also cured for 28 days.
After each spray, the boxes were covered with plastic sheeting to prevent exposure to sunshine or cold
air, simulating a realistic environment for sprayed concrete curing in the underground. The spray was
carried out during the summer (June –August 2011) in the UK, with daily temperatures ranging from
15-25 °C.
4.3 Test sample preparation
Once spraying and curing were completed, the sprayed concrete panels were cored and cut to obtain
cylinder, cube and beam samples. Only the tests on cylinder and cube samples are presented in this
paper. Beam samples were tested later once the basic compression, tension and shear behaviour of the
interfaces was known, to calibrate a numerical simulation approach for a composite shell lining, which
is the subject of a future paper.
Cylinders with a diameter of 100 mm and a nominal height of 200 mm were desired for compression
and tension testing, as recommended by BS-EN 12390-1 (BSI 2000). However, due to the necessity of
removing the uneven top surface resulting from the secondary lining spraying, actual heights of the
cylinders varied between 180-190mm, but this height difference was thought to only make a small
difference of ~2% to test results compared to standard dimension samples (Neville 2011, Table 12.1).
Target dimensions for cube samples were 200×200×200 mm. Typical ‘thin’ membrane cylinder and
cube samples are shown in Figure 4.
Test samples were coded with two numbers, the first being the Sample Type, which indicates the combination of interface finish and measured membrane thickness that comprise the interface
characteristics (Table 4), and the second the sample number within its Type. For example, Sample 2-6
is the 6th of the Type 2 samples. The three different types of interface finish are illustrated in Figure 3.
Table 4
Sample Type Interface finish
(substrate roughness)
Range of measured membrane
thickness (mm)
Type 1 Smooth 1-4
Type 2 Regulated 1-4
Type 3 As sprayed 1-4
Type 4 Smooth 4-12
Type 5 Regulated 4-12
Type 6 As sprayed 4-12
5
Test programme and methodologies
5.1 Testing programme
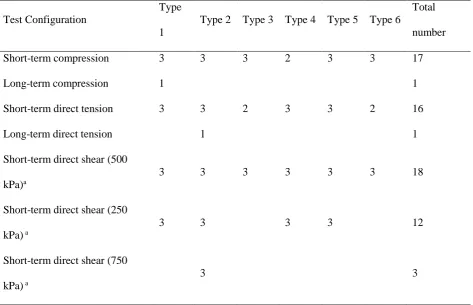
Nine test configurations covered short- and long-term uniaxial compression, direct tension and direct
[image:11.595.63.537.470.775.2]shear, as listed for each Sample Type in Table 5.
Table 5
Numbers of samples for each test configuration
Test Configuration
Type
1
Type 2 Type 3 Type 4 Type 5 Type 6
Total
number
Short-term compression 3 3 3 2 3 3 17
Long-term compression 1 1
Short-term direct tension 3 3 2 3 3 2 16
Long-term direct tension 1 1
Short-term direct shear (500
kPa)a
3 3 3 3 3 3 18
Short-term direct shear (250
kPa) a
3 3 3 3 12
Short-term direct shear (750
kPa) a
Long-term direct shear (500
kPa) a
1 1
Long-term direct shear (250
kPa) a
1 1
a Applied normal pressure in direct shear tests
5.2 Uniaxial compression test
The setup is shown in Figure 5. Load was applied using a servo-hydraulic machine with 650 kN
capacity. Three potentiometers were arranged symmetrically around the sample, positioned between
two aluminium rings attached to the sample to measure local change in length across the interface,
over a gauge length of approximately 160 mm. Machine load and stroke position were logged once per
second, along with potentiometer output. All tests were performed in stroke control mode.
For short-term tests, firstly one sample was taken and loaded in compression up to 10 MPa average stress to obtain the first loading stiffness. An unload-reload cycle down to 2 MPa and back to 10 MPa
was then applied to obtain the cyclic loading compressive stiffness and check for hysteresis. This was
repeated twice more to obtain an average value of cycle loading stiffness. After that, load was
increased until the samples started to fail and stress started to drop. Stroke rate was maintained at
0.01mm/s throughout.
This first test on a sample of each type indicated its general behaviour and compressive strength. For
the remaining samples of each type, the test procedure was basically the same but with upper and
lower bounds of the load-unload cycles fixed at 50% and 10% of the compressive strength found from
the first sample.
Long-term uniaxial compression tests were carried out for just one Type 1 sample (1-1), as relaxation
is believed not to be influenced by substrate roughness or membrane thickness, but only by the
molecular structure and physical properties of the membrane polymer (Ashby and Jones, 2005). The
sample was loaded to progressively increasing target stresses of 3.0, 6.0 and 15 MPa, and once the
target stress was reached, the steel loading plates were held stationary, allowing stress relaxation to
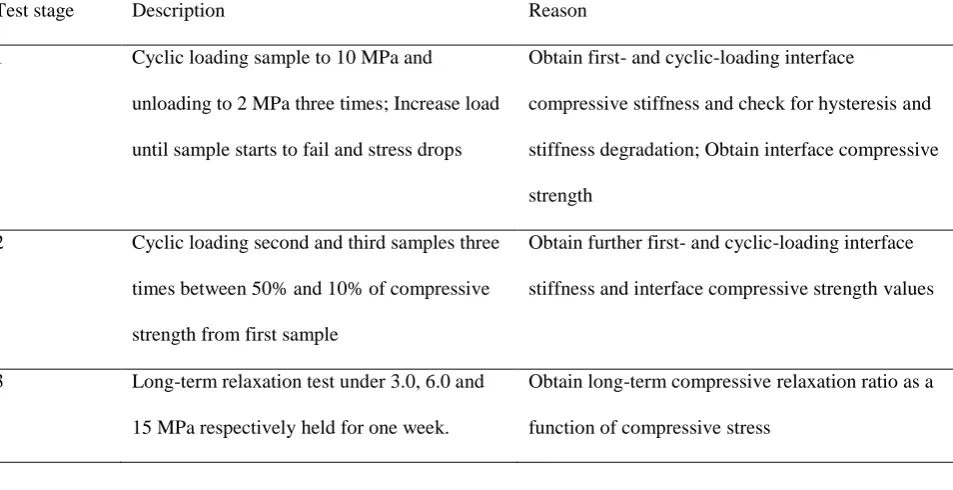
The compression tests and their objectives are summarised in Table 6.
Table 6
Uniaxial compression test stages and objectives
Test stage Description Reason
1 Cyclic loading sample to 10 MPa and
unloading to 2 MPa three times; Increase load
until sample starts to fail and stress drops
Obtain first- and cyclic-loading interface
compressive stiffness and check for hysteresis and
stiffness degradation; Obtain interface compressive
strength
2 Cyclic loading second and third samples three
times between 50% and 10% of compressive
strength from first sample
Obtain further first- and cyclic-loading interface
stiffness and interface compressive strength values
3 Long-term relaxation test under 3.0, 6.0 and
15 MPa respectively held for one week.
Obtain long-term compressive relaxation ratio as a
function of compressive stress
5.3 Direct tension test
The setup is shown in Figure 6. Direct tension was applied by means of steel plates 20 mm thick glued
to the ends of the samples with epoxy adhesive, to which steel rods were welded perpendicular and
held in the machine grips. Arrangement of potentiometers and data recording were the same as for the
compression tests.
The short-term testing procedure was the same for all samples. Samples were firstly loaded up to 0.6
MPa, a stress level safely exceeding the likely maximum water pressure acting on a shallow tunnel, to
obtain the first loading tensile stiffness. Stress was then reduced below 0.1 MPa and increased back to
0.6 MPa to complete an unload-reload cycle; this was repeated three times to obtain the average secant
cyclic tensile stiffness. Stress was then increased until the samples started to fail and the stress began
to drop. Stroke rate was maintained at 0.01 mm/s throughout.
A single long-term test was carried out, on a Type 2 sample, as substrate roughness and membrane
thickness were discovered in the short-term tests to have little impact on tensile modulus, as discussed
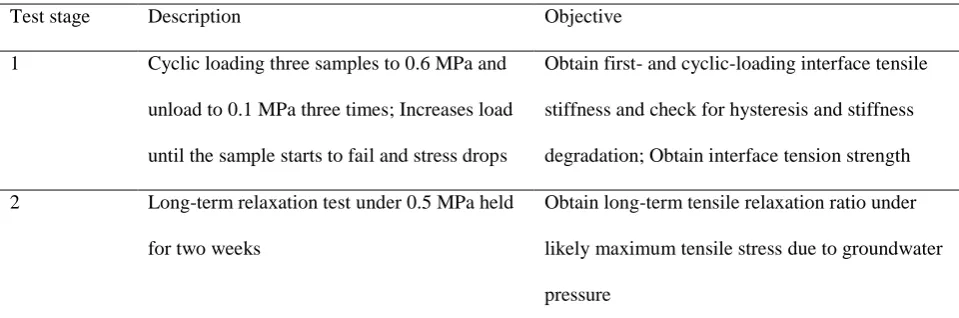
The tension tests and their objectives are summarised in Table 7.
Table 7
Uniaxial tension test stages and objectives
Test stage Description Objective
1 Cyclic loading three samples to 0.6 MPa and
unload to 0.1 MPa three times; Increases load
until the sample starts to fail and stress drops
Obtain first- and cyclic-loading interface tensile
stiffness and check for hysteresis and stiffness
degradation; Obtain interface tension strength
2 Long-term relaxation test under 0.5 MPa held
for two weeks
Obtain long-term tensile relaxation ratio under
likely maximum tensile stress due to groundwater
pressure
5.4 Direct shear test
The direct shear tests were carried out in a large geotechnical shear testing machine (Wykeham
Farrance, equipped with a Sercomp 7 Special hydraulic controller system). The shear machine has two
loading systems, one for normal stress and one for shear stress, and comprises an upper box fixed
stationary to the machine and a lower box pushed by two hydraulic rams to generate shear in samples
(Figure 7). As the dimensions of the shear box, 300×300×200 mm, were larger than those of the cube
samples, timber wedges were used to restrict the movement of the samples within the shear boxes. The Young’s modulus of timber is around 10 GPa, leading to a stiffness for a 150 mm combined length
timber wedge of 6.66 GPa/m, which is much higher than the first loading stiffness of the membrane interface (between 0.5-1.0 GPa/m). The impact of timber wedge compliance on the cyclic loading
stiffness is therefore expected to be minimal after the first loading cycle. Once the test sample was
positioned in the shear box and fixed by the timber wedges, the top cap was placed and followed by
the crossbeam, through which normal stress was applied to simulate the tunnel overburden of 250 kPa,
500 kPa or 750 kPa.
A total of six LVDTs were calibrated and used to record data. One LVDT is located within a loading
ring positioned to the rear of the machine to record shear load and another at the back of the lower
corners of the top cap to measure vertical dilation and rotation of the sample. Normal force applied by
the cross beam was also recorded continuously.
The short-term shear tests followed a similar pattern to the direct tension tests, in which the blocks
were initially sheared to around 0.7 MPa to obtain first loading shear stiffness and then the stress
reduced to 0.2 MPa for a complete cycle of load. Second and the third cycles of loading were then
performed at progressively higher stress levels, each 0.3-0.4 MPa higher than the previous to obtain
the average secant cyclic shear stiffness, before the sample was then sheared to failure, judged to be
when the shear force started to drop. Shear stroke rate was 0.2 mm/min throughout.
For the long-term tests, two Type 2 samples, one under 500 kPa normal stress and the other under 250
kPa, were sheared to 1 MPa and then the shear displacement kept constant, allowing stress relaxation
to occur over a period of two weeks. Laboratory temperature was recorded continuously by a probe
adjacent to the shear box.
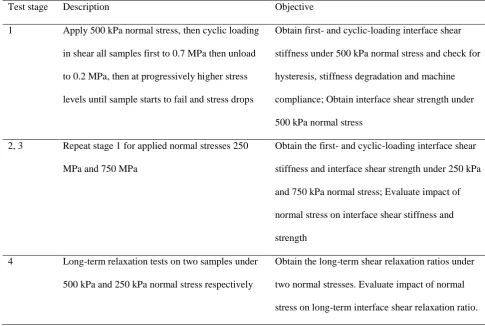
[image:15.595.63.549.450.776.2]The direct shear tests and their objectives are summarised in Table 8.
Table 8
Direct shear test stages and objectives
Test stage Description Objective
1 Apply 500 kPa normal stress, then cyclic loading
in shear all samples first to 0.7 MPa then unload
to 0.2 MPa, then at progressively higher stress
levels until sample starts to fail and stress drops
Obtain first- and cyclic-loading interface shear
stiffness under 500 kPa normal stress and check for
hysteresis, stiffness degradation and machine
compliance; Obtain interface shear strength under
500 kPa normal stress
2, 3 Repeat stage 1 for applied normal stresses 250
MPa and 750 MPa
Obtain the first- and cyclic-loading interface shear
stiffness and interface shear strength under 250 kPa
and 750 kPa normal stress; Evaluate impact of
normal stress on interface shear stiffness and
strength
4 Long-term relaxation tests on two samples under
500 kPa and 250 kPa normal stress respectively
Obtain the long-term shear relaxation ratios under
two normal stresses. Evaluate impact of normal
5.5 Post-processing and presentation of results
Three pure sprayed concrete cylinders of similar dimensions to the composite shell samples were
tested in compression to obtain a short-term concrete Young’s modulus of 20 GPa. This was used to
correct for deformation of the concrete in the composite compression and tension specimens, so that
the deformations reported are for the interface only.
In a trial long-term compressive test on a pure sprayed concrete cylinder sample, it was observed that
the load fluctuated over time during the test in a manner that correlated with the recorded temperature
adjacent to the machine. The load reduced by 1.5 MPa for each 1 °C temperature reduction. This
relationship was used to adjust the raw long-term compression and tension relaxation test data in
following sections.
The direct shear tests measured the shear displacements externally, which is affected by compliance of
the testing machine and rotation of the shear samples during the test, which was corrected using the
vertical LVDT’s as mentioned above. This paper reports only the adjusted values after correction for
these effects.
Test results are presented in terms of stress (direct or shear, applied load divided by gross loaded area)
against deformation across the interface in millimetres. Derived interface parameters are the interface
normal stiffness Kn and shear stiffness Ks obtained as the change in direct or shear stress respectively
divided by the corresponding deformation, with units of GPa/m. The influence of substrate roughness
and membrane thickness on Kn, Ks and failure stress is explored.
6
Results and discussion
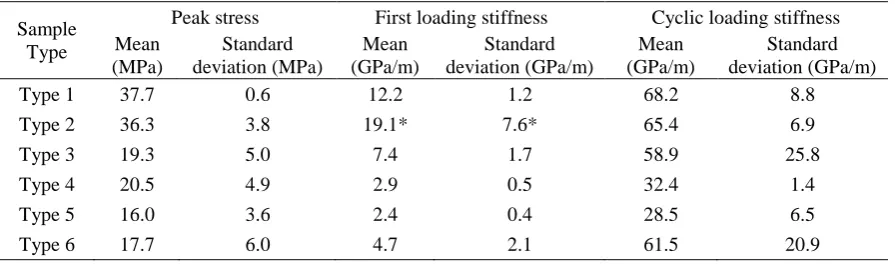
6.1 Short-term uniaxial compression
Typical interface stress-deformation graphs for selected samples with thin (Types 1 to 3) and thick
(Types 4 to 6) membranes are shown in Figures 8 and 9 respectively. All samples failed in a brittle manner after reaching peak stress. Peak stresses for Type 1 and 2 samples were distinctively higher
than for other types. There was no obvious increase in cyclic stiffness with increase in stress level.
Numerical data for all samples is given in the Appendix in Table A1, and statistical analysis in Table 9
below, which shows that mean peak stresses for Type 1 and Type 2 samples were very close, around
interface reduces compressive peak stress by approximately 50% for samples with thin membrane
(Type 3). A thick membrane also reduces the compressive peak stress by approximately 50%, and
influence of substrate roughness is less (Types 4 to 6).
First loading stiffness increases with reduced membrane thickness and reduced substrate roughness,
over the range 2 to 16 GPa/m approximately. Cyclic loading stiffness increases with reduced
membrane thickness, over the range 20 to 80 GPa/m, but is little affected by substrate roughness. Thus
[image:17.595.66.514.298.430.2]influences of interface characteristics on stiffness are similar to on compressive peak stress.
Table 9
Statistical analysis of uniaxial compression test results
Sample Type
Peak stress First loading stiffness Cyclic loading stiffness Mean (MPa) Standard deviation (MPa) Mean (GPa/m) Standard deviation (GPa/m) Mean (GPa/m) Standard deviation (GPa/m) Type 1 37.7 0.6 12.2 1.2 68.2 8.8 Type 2 36.3 3.8 19.1* 7.6* 65.4 6.9 Type 3 19.3 5.0 7.4 1.7 58.9 25.8 Type 4 20.5 4.9 2.9 0.5 32.4 1.4 Type 5 16.0 3.6 2.4 0.4 28.5 6.5 Type 6 17.7 6.0 4.7 2.1 61.5 20.9
*Mean and standard deviation of first loading stiffness become 14.7 GPa/m and 0.8 GPa/m respectively if Sample 2-1 is excluded
All compressive samples failed in transverse tension, with vertical cracks formed either side of the
membrane, as shown in Figure 10. For samples with thick membrane, a significant quantity of
membrane was squeezed out, pulling some of the surface concrete away with it (Figure 10(b)). This is
likely to have induced horizontal tensile strain at the interface and be the reason why Types 4, 5 and 6
samples failed at lower stress levels that were less dependent on stress level than thin membrane samples.
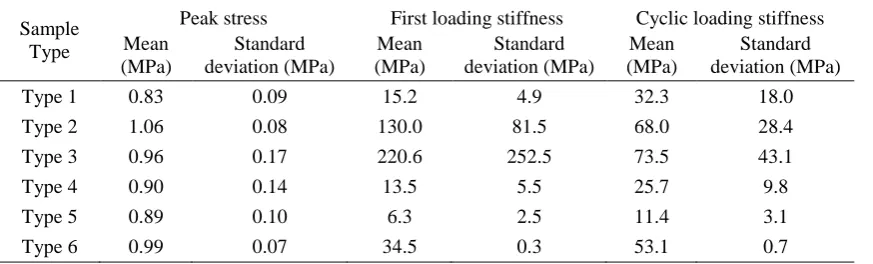
6.2 Short-term direct tension
Typical interface stress-deformation relationships for selected samples with thin and thick membranes
are shown in Figures 11 and 12 respectively. Numerical data is given in Table A2 and statistical
analysis presented in Table 10. Peak tensile stress for all samples is above 0.75 MPa, well above the
maximum pore water pressure a shallow SCL tunnel is likely to experience. Mean peak tensile stress
Type 2 regulated interface produces more consistent and higher quality interfaces. Table 10 also
shows that thick membrane and as-sprayed interface do not change interface peak tensile stress
significantly. Thin membrane samples, with the exception of 1-6, showed a ductile stress plateau
post-peak stress, able to maintain a stress of 0.4 MPa at 1.0 mm extension. Sample 1-6 failed in a brittle
manner, the reason for which is unclear. However, it still achieved a tensile strength of 0.8 MPa. Thick
membrane interfaces (Types 4 to 6) showed a more declining stress path (although still reasonable
ductility), with seven out of eight samples able to sustain 0.4 MPa at a 1.5 mm extension. This ductile
behaviour gives confidence to designers that the tunnel is able to response to sudden changes in
loading (e.g. adjacent construction) during construction or the structure’s life.
Table 10
Statistical analysis of direct tension test results
Sample Type
[image:18.595.66.503.350.482.2]Peak stress First loading stiffness Cyclic loading stiffness Mean (MPa) Standard deviation (MPa) Mean (MPa) Standard deviation (MPa) Mean (MPa) Standard deviation (MPa) Type 1 0.83 0.09 15.2 4.9 32.3 18.0 Type 2 1.06 0.08 130.0 81.5 68.0 28.4 Type 3 0.96 0.17 220.6 252.5 73.5 43.1 Type 4 0.90 0.14 13.5 5.5 25.7 9.8 Type 5 0.89 0.10 6.3 2.5 11.4 3.1 Type 6 0.99 0.07 34.5 0.3 53.1 0.7
Table A2 shows that with the exception of three outliers (samples 2-6, 2-7 and 3-5), first loading
stiffness for all samples was below 60 GPa/m, mostly between 10 – 40 GPa/m and reducing with increased membrane thickness. The very high first loading stiffness for the three outliers was probably
caused by imperfect vertical alignment of test samples and the very thin membrane thickness (between
1 – 3 mm). Table A2 also shows that except for two of the same outliers (2-6 and 3-5), cyclic loading
stiffness was below 60 GPa/m, very similar to first loading stiffness and again reducing with increased
membrane thickness.
For Type 2 and Type 5 samples with regulated interface finish, failure occurred by debonding of the
membrane at the interface with the secondary layer, suggesting higher bond strength exists between
membrane and regulating layer (Figure13(a)). Other sample types showed equal probability of
membrane debonding from primary or secondary linings (Figure 13(b)). Rupture was not observed
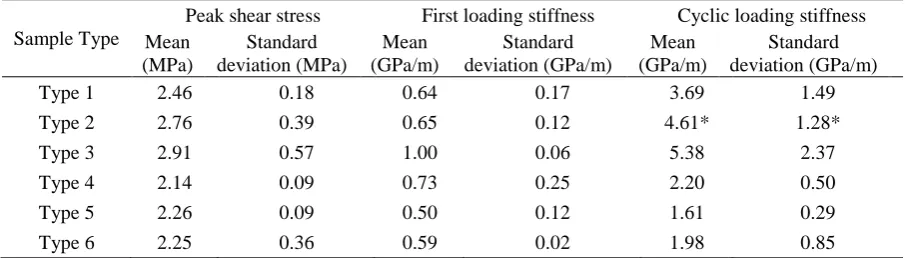
6.3 Short-term direct shear under 500 kPa normal pressure
Typical stress-deformation relationships for selected samples with thin and thick membranes are
shown in Figures 14 and 15 respectively. For thin membrane samples, peak shear stress occurred at a
displacement of 8 –10 mm and all samples failed in a ductile mode. For samples with thick membrane,
peak shear stress occurred at 10 – 15 mm displacement and samples also failed in a ductile way. This
high degree of shearing ductility for all samples is sufficient to accommodate potential deformation
experienced by a shallow SCL tunnel.
Numerical test results and statistical analysis are presented in Tables A3 and 11 respectively. With
only one exception, all samples withstood a 2 MPa shear stress which is an upper estimate on the
stress likely in an SCL tunnel suggested by Pickett & Thomas (2011). Amongst thin membrane
samples, peak stress for Type 3 is greater than for Type 2, in turn greater than for Type 1. Thick
membrane samples generally follow the same trend, albeit with lower peak shear stress, suggesting
that the greater the substrate roughness and the thinner the membrane, the higher the peak stress. For
thin membrane samples, mean first loading stiffnesses for Types 1 and 2 were smaller than for Type 3.
The same trend was observed for thick membrane samples but with greater first loading stiffness
values. This trend was also observed for cyclic loading stiffness values for samples with thick
[image:19.595.69.522.575.704.2]membrane, but not for samples with thin membrane, possibly due to the small number of samples.
Table 11
Statistical analysis of direct shear test results (under 500 kPa normal pressure)
Sample Type
Peak shear stress First loading stiffness Cyclic loading stiffness Mean (MPa) Standard deviation (MPa) Mean (GPa/m) Standard deviation (GPa/m) Mean (GPa/m) Standard deviation (GPa/m) Type 1 2.46 0.18 0.64 0.17 3.69 1.49 Type 2 2.76 0.39 0.65 0.12 4.61* 1.28* Type 3 2.91 0.57 1.00 0.06 5.38 2.37 Type 4 2.14 0.09 0.73 0.25 2.20 0.50 Type 5 2.26 0.09 0.50 0.12 1.61 0.29 Type 6 2.25 0.36 0.59 0.02 1.98 0.85
* Based on two test results
Observed failure mechanisms fell into categories of either interface shear failure or membrane
membrane usually slid along one interface (with no preference as to which one), as shown in Figure 16
(a) and (b). For samples with rough as-sprayed interface, the membrane usually failed in a mixed
mode, sliding over relatively smooth parts of the interfaces and shearing within the membrane at the
rougher parts, as shown in Figure 16(c) and (d). This suggests that the dominating failure mode is
that of the interface, with shearing within the membrane considered a consequence or by-product of
the interface failure.
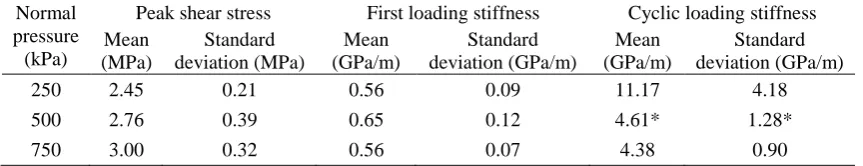
6.4 Type 2 samples in short-term direct shear under other normal pressures
Additional short-term direct shear tests were carried out for Type 2 samples under 250 kPa and 750
kPa normal pressures as described in Table 5. All samples failed in a ductile mode with similar
response in shear to samples under 500 kPa.
Statistical analysis of direct shear results for Type 2 samples under all three normal pressures are
presented in Table 12. It can be seen that peak shear stress increases with increasing normal pressure.
From this trend, effective cohesion and friction angle may be calculated for the sprayed
concrete-membrane interface, giving values of 2.2 MPa and 48⁰ respectively.
Table 12 also shows that normal pressure has little impact on the first loading shear stiffness for Type
2 interfaces, with an average value of approximately 0.6 GPa/m. Cyclic loading stiffness for samples
under 250 kPa normal pressure is greater than for those under 500 kPa and 750 kPa. This
counterintuitive result may be due to sample rotation, most pronounced for samples under the lowest normal pressure of 250 kPa, not having been fully corrected for.
Considering the 250 kPa values as outliers, it is concluded from the other results that normal pressure
has little impact on the cyclic loading stiffness, which has an average value of approximately 4.4
[image:20.595.69.501.678.761.2]GPa/m.
Table 12
Statistical analysis of direct shear test results for Type 2 samples under all normal pressures
Normal pressure
(kPa)
Peak shear stress First loading stiffness Cyclic loading stiffness Mean (MPa) Standard deviation (MPa) Mean (GPa/m) Standard deviation (GPa/m) Mean (GPa/m) Standard deviation (GPa/m) 250 2.45 0.21 0.56 0.09 11.17 4.18 500 2.76 0.39 0.65 0.12 4.61* 1.28* 750 3.00 0.32 0.56 0.07 4.38 0.90
6.5 Long-term tests
In the long-term compression tests, the load relaxed to around 70-80% of its initial value after one
week. A logarithmic trend of load reduction with time was obtained, from which a stress relaxation
ratio of approximately 0.5 is predicted at 120 years, the design life for most underground tunnels in
London.
The long-term tension test was analysed in a similar manner to the compression tests, and the stress
relaxation ratio calculated as 0.46 at 120 years.
Long-term direct shear tests were carried out on two Type 2 samples, under normal pressures of 250
and 500 kPa respectively and a shear stress of 1 MPa. It was seen that the shear stress for both samples
relaxed from 1 MPa to approximately 0.8 MPa over five days, at which there was a sudden drop of
stress to about 0.2 MPa. Shear stress then continued to relax after that, but at a much lower rate,
presumably because the normal stress had dropped. The stress drop was found to be an artefact of the
shear box test machine, which automatically cut its vertical stress after five days as a safety feature.
By combining the relaxation curves before and after the stress drop, two completed long-term stress
curves were obtained, one for each normal pressure. Extrapolation of the relaxation trend to 120 years
gave a stress relaxation ratio of around 0.6, very close to the compression and tension long-term ratios
of 0.5 and 0.46. Output from the long-term test under 500 kPa normal pressure with the logarithmic fit
to the load-time relationship is shown in Figure 17.
7
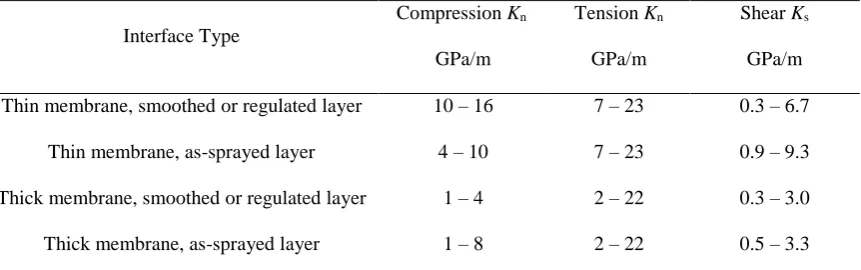
Interface parameters
Ranges of interface stiffness parameters Kn and Ks and peak strengths for design of composite SCL
tunnels where the membrane is at normal atmospheric humidity (believed to the most likely conditions
in soft ground) are proposed in this section. Upper and lower limits of each range are calculated from
the experimental data mean and standard deviation as ±95% percentiles assuming normal distributions
(i.e. mean ±1.64 standard deviations). Compressive and tensile normal stiffness Kn is estimated using
first loading stiffness, because local measurement was adopted for these two tests. In contrast, shear
stiffness Ks is estimated using cyclic loading stiffness, because global measurement was adopted for
shown to be independent of normal pressure, hence only one value is quoted for each specimen type,
and Ks is reported as a single value for both smoothed and regulated substrates because their test
results are very close. For numerical analysis of a long-term loading situation, it is suggested that a
relaxation ratio of 50% is applied to all stiffness values.
The ranges of Ks in Table 13 broadly coincide with the realistic range of 0.1 – 1.0 GPa/m suggested by
Pickett and Thomas (2011) for which partial slip of the secondary lining relative to the primary would
be expected, but is below the range for no slip (>10 GPa/m). Thus a composite SCL tunnel with these
interface properties should behave as a partially composite structure, with lining flexural stiffness from
two to four times (i.e. non-composite to fully composite lining respectively) the stiffness of an
individual lining layer if both linings are of the same thickness. The degree of composite action in
theory depends to a certain extent (as indicated in the Table) on the interface characteristics of
substrate roughness and membrane thickness, but its actual sensitivity in a real tunnel situation to value of Ks chosen from the ranges given in the Table requires confirmation in a numerical model,
[image:22.595.73.504.501.636.2]which is the subject of further research to be reported in a future paper.
Table 13
Suggested ranges of interface stiffness parameters (short-term*) for composite shell lining design,
assuming spray-applied waterproofing membrane (TamSeal 800)
Interface Type
Compression Kn
GPa/m
Tension Kn
GPa/m
Shear Ks
GPa/m
Thin membrane, smoothed or regulated layer 10 – 16 7 – 23 0.3 – 6.7
Thin membrane, as-sprayed layer 4 – 10 7 – 23 0.9 – 9.3
Thick membrane, smoothed or regulated layer 1 – 4 2 – 22 0.3 – 3.0
Thick membrane, as-sprayed layer 1 – 8 2 – 22 0.5 – 3.3
* A suggested relaxation ratio of 50% should be applied to all stiffness values for long term loading
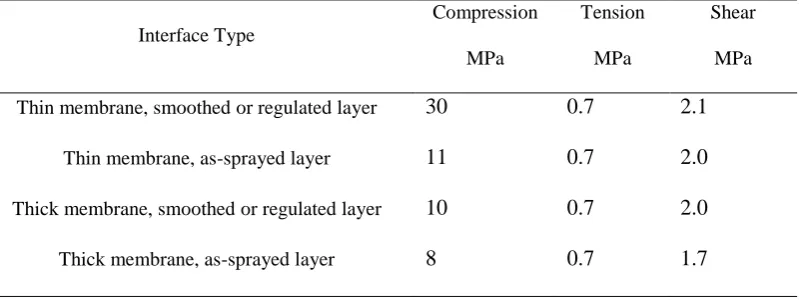
Suggested minimum (lower 95% percentile) interface peak strengths are given in Table 14. Tension
and shear values are sufficient to ensure bond is maintained between the concrete layers and
compressive stress seen is 8 MPa, which nevertheless is equivalent to 400 m of overburden – a
[image:23.595.76.476.223.373.2]situation never experienced by a shallow SCL tunnel in an urban environment.
Table 14
Interface minimum peak strengths for composite shell lining assuming spray-applied waterproofing
membrane (TamSeal 800)
Interface Type
Compression
MPa
Tension
MPa
Shear
MPa
Thin membrane, smoothed or regulated layer 30 0.7 2.1
Thin membrane, as-sprayed layer 11 0.7 2.0
Thick membrane, smoothed or regulated layer 10 0.7 2.0
Thick membrane, as-sprayed layer 8 0.7 1.7
Minimum peak tensile stress proposed is 0.7 MPa, 40% higher than the maximum water pressure on
an SCL tunnel 50 m below ground level. The post-peak tensile capacity of 0.4 MPa at a membrane
interface extension of 1.5 mm give confidence in the degree of ductility in the interface in tension.
The minimum shear strength in Table 14 is similar to the stress (2 MPa) suggested by Pickett and
Thomas (2011) to be potentially mobilised in a fully composite SCL tunnel under no-slip conditions.
As discussed above, the interface shear stiffness has been observed to lie within the range where a degree of slip is expected (ibid.), such that the actual interface stress will be significantly less than 2
MPa. Furthermore, peak shear strength usually occurs at interface shear displacements of the order of
10-15 mm, which is a highly unlikely scenario for a shallow SCL tunnel. Taken together, these factors
suggest the interface has sufficient shear strength to perform its function in providing partial
composite action.
8
Conclusions
This research has investigated properties of the interface between sprayed concrete primary and secondary linings when a spray-applied waterproofing layer is used and tested under conditions of
has been shown that neither of the key specified characteristics of the interface, namely membrane
thickness and substrate roughness, has major impact on the measured interface properties of stiffness
and strength, and their actual effect has been quantified in terms of proposed ranges of interface
stiffness parameters Kn and Ks for design. It has also been demonstrated that sufficient robustness
exists in the interface to resist any sudden loading changes. Consequently, the
concrete-membrane-concrete interface of specified membrane thickness and substrate roughness may be simulated in
numerical models by using interface elements, assigned with the interface parameters presented in this
paper. This will significantly simplify numerical modelling of a composite SCL tunnel.
Although these parameters were developed from relatively few tests on samples with only one
membrane type, the relative insensitivity of Kn and Ks to the interface characteristics and the wide
ranges proposed should adequately cover most situations in practical SCL tunnel construction. For
major tunnelling projects, these parameters could be used directly in an initial numerical investigation at feasibility study stage. Designers have the option to specify similar tests to the ones described in this
paper, either prior to and during construction, to verify parameter values appropriate to their chosen
membrane type and level of workmanship.
Further research is under way using the concrete-membrane-concrete interface parameter values
presented in this paper to (1) develop a numerical modelling approach for a composite SCL lining,
initially validated for a composite beam against laboratory test results, (2) apply the validated
modelling approach to a whole SCL tunnel to understand its performance under various combinations
of interface characteristics and loading, and (3) explore the degree of load sharing between the linings
and the potential for lining thickness reduction in a composite SCL tunnel. In addition, to verify the
appropriateness of the ‘dry’ humidity assumption for the membrane, in situ measurements of the membrane moisture content in a composite SCL tunnel in soft ground could be made. If the ‘dry’
condition was thought not to be representative of the field condition, element tests at the appropriate
Acknowledgements
The authors gratefully acknowledge the financial support from Mott MacDonald and TAM-Normet for
carrying out the investigation reported in this paper. The work was carried out at the University of
Southampton with facilities provided by the Faculty of Engineering and the Environment.
[image:25.595.69.495.247.541.2]Appendix
Table A1 Uniaxial compression test results
Sample designation Membrane thickness (mm) Peak Stress (MPa) First loading stiffness (GPa/m) Cyclic loading stiffness (GPa/m)
1-2 2.0 38 11.5 63.8
1-3 2.5 38 11.6 62.5
1-4 3.0 37 13.6 78.4
2-1 3.0 32 27.8 57.9
2-2 2.5 39 15.6 66.6
2-3 2.5 38 13.8 71.6
3-2 4.0 20 8.7 77.2
3-3 3.5 14 5.5 29.4
3-4 4.0 24 8.1 70.1
4-2 9.5 17 2.6 33.3
4-3 9.0 24 3.3 31.4
5-1 12.0 20 2.2 21.2
5-2 11.5 13 2.3 30.8
5-3 9.0 15 2.9 33.5
6-1 6.0 24 7.0 81.1
6-2 8.5 12 2.8 39.5
6-3 6.5 17 4.3 63.7
Table A2 Direct tension test results
Sample designation Membrane thickness (mm) Peak stress (MPa) First loading stiffness (GPa/m) Cyclic loading stiffness (GPa/m)
1-5 2.0 0.93 10.6 12.1
1-6 2.0 0.80 14.6 46.8
1-7 2.5 0.75 20.4 37.9
2-5 1.0 0.98 59.3 46.2
2-6 1.0 1.13 111.6 100.1
2-7 2.5 1.07 219.1 57.8
3-5 3.0 1.12 399.1 104.0
3-7 3.0 0.88 42.0 43.1
4-5 7.5 1.03 15.0 21.2
[image:25.595.74.489.593.781.2]4-7 8.0 0.93 18.2 37.0
5-5 10.0 0.86 3.4 7.9
5-6 8.0 1.00 7.6 13.1
5-7 9.0 0.80 7.8 13.3
6-6 4.5 0.94 34.7 53.6
[image:26.595.73.478.213.525.2]6-7 6.0 1.04 34.3 52.6
Table A3 Direct shear test results (under 500 kPa normal pressure)
Sample designation Membrane thickness (mm) Peak shear stress (MPa) Shear displacement at peak stress (mm)
First loading stiffness (GPa/m) Cyclic loading stiffness (GPa/m)
1-21 3.0 2.64 9.8 0.58 4.07
1-22 4.0 2.29 8.8 0.50 2.05
1-23 3.0 2.44 9.5 0.82 4.95
2-21 4.0 2.35 10.0 0.74 N/A
2-22 4.0 3.12 8.6 0.69 3.70
2-23 4.0 2.80 10.3 0.51 5.51
3-21 3.0 3.41 9.6 1.01 7.70
3-22 4.0 2.28 14.2 0.93 2.96
3-23 3.0 3.04 10.6 1.05 5.48
4-21 6.0 2.12 12.5 0.73 1.97
4-22 5.0 2.24 14.1 0.48 2.78
4-23 5.0 2.07 10.2 0.98 1.85
5-21 6.0 2.20 12.7 0.61 1.28
5-22 8.0 2.36 13.2 0.38 1.82
5-23 8.0 2.20 13.0 0.52 1.74
6-21 8.0 2.18 15.0 0.59 1.41
6-22 8.0 1.94 9.4 0.62 1.56
6-23 9.0 2.64 14.4 0.58 2.96
References
Ashby, M.F., Jones, D.R.H., 2005. Engineering Materials 2: An Introduction to Microstructures,
Processing and Design, third ed. Butterworth-Heinemann, UK.
BS-EN 12390-1, 2000. Testing Hardened Concrete – Part 1: Shape, dimensions and other
requirements for specimens and moulds. British Standards Institute, London.
BS-EN 14487-1, 2995.Sprayed Concrete – Part 1: Definitions, specifications and conformity. British
Standards Institute, London.
Crossrail, 2009. Crossrail SCL Tunnels – MDC2/3 Sprayed Secondary Lining Study. Unpublished
Dimmock, R.H., Haig, B., Su, J., 2011. Spray Applied Waterproofing Membranes – Key Success
Factors and Development of Efficient Sprayed Concrete Tunnel Linings. In: Beck T, Woldmo O &
Engen S, (Eds.), Sixth International Symposium on Sprayed Concrete, Tromso, Norway, pp.
110-124.
Duarte, P., Thomas, A.H., Cooke, M., 2012. Sustainability and the Tunnelling Industry. In: Kolic D,
(Eds.), Under City Colloquium on Using Underground Space in Urban Areas in South-East
Europe, Croatia, 2012. pp. 273-288.
Grose, W.J., Eddie, C.M., 1996. Geotechnical aspects of the construction of the Heathrow transfer
baggage system tunnel. In: Mair, R., Taylor, N., (Eds.), Geotechnical Aspects of of Underground
Construction in Soft Ground. Taylor & Francis, London, pp. 269-276.
Holter, K.G., Geving, S., 2015. Moisture transport through sprayed concrete tunnel linings. Rock
Mech Rock Eng. DOI 10.1007/s00603-015-0730-1
Holter, K.G., 2016. Performance of EVA-Based Membranes for SCL in Hard Rock. Rock Mechanics
and Rock Engineering, Volume 49, Issue 4, pp 1329-1358. DOI 10.1007/s00603-015-0844-5
Institution of Civil Engineers, 1996. Sprayed concrete linings (NATM) for tunnels in soft ground, ICE
design and practice guide. Thomas Telford., London.
ITAtech, 2013. Design Guidance for Sprayed Applied Waterproofing Membranes. Int Tunn Assoc.
Kovári, K., 2003a. History of the sprayed concrete lining method – Part I: milestones up to the 1960s.
Tunn. Undergr. Space Technol. 18, 57-69.
Kovári, K., 2003b. History of the sprayed concrete lining method – part II: milestones after the 1960s.
Tunn. Undergr. Space Technol. 18, 71-83.
Nakashima, M., Hammer, A.L., Thewes, M., Elshafie, M. and Soga, K., 2015. Mechanical behaviour
of a sprayed concrete lining isolated by a sprayed waterproofing membrane. Tunnelling and
Underground Space Technology, 47, pp.143-152. http://dx.doi.org/10.1016/j.tust.2015.01.004.
Neville, A.M., 2011. Properties of Concrete, 5th ed. Prentice Hall, US.
Normet, 2011. Method Statement for the Installation of TamSeal 800 Sprayed Applied Waterproofing
Membrane.
Pickett, A.P., Thomas, A.H., 2011. The design of composite shell linings. In: Beck T, Woldmo O &
Engen S, (Eds.), Sixth International Symposium on Sprayed Concrete, Tromso, Norway,
pp.402-413
Su, J., Thomas, A,. 2014. Design of Sprayed Concrete Lining in Soft Ground – A Crossrail
perspective. In: Black M, Dodge C & Laurence U, (Eds.), Crossrail Project: Infrastructure design
and construction, volume 1. London, GB, ICE Publishing. pp.123-136
Thomas, A.H., 2009. Sprayed Concrete Lined Tunnels. Taylor & Francis, London.
Verani, C.A., Aldrian, W., 2010. Composite linings: ground support and waterproofing through the
use of a fully bonded membrane. In: Bernard, E.S., (Eds.), Shotcrete: Element of a System. Taylor
& Francis, London, pp. 269-282.
Watson, P.C., Warren, C.D., Eddie, C.M., Jager, J., 1999. CTRL North Downs Tunnel. In: Tunnel
Figure 1 (a) idealised perfectly circular composite SCL tunnel with applied ground loading, and (b)
typical resulting lining deformation.
Figure 2 Spray operations at contractor’s yard
Figure 3 Left to Right: as-sprayed, smoothed and regulated surface finishes, Top to Bottom: before
and after application of TamSeal 800 spray applied waterproofing membrane
Figure 4 Typical (a) cylinder sample and (b) cube sample
Figure 5 Typical compression test setup
Figure 6 Typical direct tension test setup
Figure 7 Schematic of direct shear test
Figure 8 Thin membrane interface behaviour in uniaxial compression
Figure 9 Thick membrane interface behaviour in uniaxial compression
Figure 10 Typical compressive failure modes for (a) thin membrane interface (b) thick membrane interface
Figure 11 Thin membrane interface behaviour in direct tension
Figure 12 Thick membrane interface behaviour in direct tension
Figure 13 (a) membrane bonding to regulating layer and debonded from secondary lining (b) equal
probability of debonding from primary or secondary linings if no regulating layer present
Figure 14 Thin membrane interface behaviour in direct shear under 500 kPa normal pressure
Figure 15 Thick membrane interface behaviour in direct shear under 500 kPa normal pressure
Figure 16 Typical failure modes under direct shear test
Figure 17 Typical load relaxation-time relationship for a Type 2 interface under long-term shear
a
b
[image:33.720.198.453.156.297.2]100mm 100mm
Two aluminium rings Potentiometers clamped to the rings Steel plate
[image:34.720.233.488.186.354.2]Steel plate
Steel plate Potentiometers clamped to the rings
Two aluminium rings Rod clamped between machine grips
Steel plate
[image:35.720.216.503.144.396.2]Rod clamped between machine grips
Figure 8 Thin membrane interface behaviour in uniaxial compression
0 5 10 15 20 25 30 35 40 45
0 0.5 1 1.5 2 2.5
Co
m
p
re
ssi
ve
Str
e
ss (M
Pa)
Interface compressive displacement (mm)
1-3 2-3
Figure 9 Thick membrane interface behaviour in uniaxial compression
0 5 10 15 20 25 30
0 1 2 3 4 5
Co
m
p
re
ssi
ve
Str
e
ss (M
Pa)
Interface compressive displacement (mm)
5-2 4-4
a
b
Figure 11 Thin membrane interface behaviour in direct tension
0 0.2 0.4 0.6 0.8 1 1.2
0 0.2 0.4 0.6 0.8 1
Ten
si
le
str
e
ss (M
Pa)
Interface tensile displacement (mm)
2-6
3-7
Figure 12 Thick membrane interface behaviour in direct tension
0 0.2 0.4 0.6 0.8 1 1.2
0 0.5 1 1.5
Ten
si
le
str
e
ss (M
Pa)
Interface tensile displacement (mm)
6-7 5-6
a
Regulating layer Secondary lining
b
Primary lining
Secondary lining
Primary lining
[image:42.720.193.526.118.424.2]Figure 14 Thin membrane interface behaviour in direct shear under 500 kPa normal pressure
0 0.5 1 1.5 2 2.5 3 3.5 4
0 5 10 15 20
Sh
e
ar
st
re
ss (M
Pa)
Interface shear displacement (mm)
3-21
1-21
Figure 15 Thick membrane interface behaviour in direct shear under 500 kPa normal pressure
0 0.5 1 1.5 2 2.5 3
0 5 10 15 20
Sh
e
ar
st
re
ss (M
Pa)
Interface shear displacement (mm)
6-23 5-23
b (Sample No. 5-21)
c (Sample No. 5-23)
a (Sample No. 2-23)
[image:45.720.118.488.67.312.2]d (Sample No. 5-22)
Figure 17 Typical load relaxation-time relationship for a Type 2 interface under long-term shear loading
y = -0.025ln(x) + 0.861
0.6 0.7 0.8 0.9 1
0 2 4 6 8 10 12 14
R
e
m
an
in
g /
o
ri
gi
n
al
lo
ad
r
atio