A Thesis Submitted for the Degree of PhD at the University of Warwick
Permanent WRAP URL:
http://wrap.warwick.ac.uk/88301
Copyright and reuse:
This thesis is made available online and is protected by original copyright. Please scroll down to view the document itself.
Please refer to the repository record for this item for information to help you to cite it. Our policy information is available from the repository home page.
Developing and Extending the
Capabilities of the Scanning Ion
Conductance Microscope
by
David John Perry
Thesis
Submitted to the University of Warwick
for the degree of
Doctor of Philosophy
Supervisors: Prof Patrick R. Unwin and Prof Bruno G. Frenguelli MOAC Doctoral Training Centre
For
June and Arthur Perry
Betty and Jim Riley
Contents
List of Figures ... v
List of Tables ... vii
Abbreviations ... viii
Acknowledgements ... ix
Declaration ... x
Abstract ... xiii
Chapter 1. Introduction ... 1
1.1 Aims of Thesis ... 1
1.2 Scanning Probe Microscopy ... 2
1.3 Scanning Ion Conductance Microscopy ... 3
1.3.1 Principles of Operation ... 4
1.3.2 Feedback Types and Scanning Regimes ... 5
1.3.3 The SICM Probe ... 9
1.3.4 Morphological Studies of Live Cells ... 11
1.3.5 Other Applications ... 16
1.3.6 Hybrid/SICM Based Techniques ... 20
1.4 Prospects for SICM as a Tool for Surface Charge Mapping ... 25
1.4.1 Surface Charge and the Diffuse Double Layer ... 25
1.4.2 Techniques for Mapping Surface Charge ... 27
1.4.3 Ion Current Rectification in Nanopipettes and Nanopores ... 29
1.4.4 Surface Induced Rectification ... 31
1.5 FEM Modelling and Quantifying the SICM Response ... 33
1.6 Resistive Pulse Detection ... 36
1.7 References ... 37
Chapter 2. Surface Charge Mapping with a Nanopipette ... 50
2.1 Abstract ... 51
2.2 Introduction ... 52
2.3 Materials and Methods ... 54
2.3.1 Solutions ... 54
2.3.2 Nanopipettes ... 55
2.3.3 Substrates ... 55
2.3.4 Instrumentation ... 56
2.3.5 SICM Approach Curves ... 56
2.3.6 SICM Maps ... 57
2.3.7 Atomic Force Microscopy ... 57
2.3.8 Simulations ... 57
2.4 Results and Discussion ... 58
2.4.1 Approach Curves ... 58
2.4.2 Surface Charge Mapping ... 67
2.5 Conclusions ... 71
2.6 Supporting Information ... 72
2.6.1 FEM simulations ... 72
2.6.2 Current-voltage characteristics of 60 nm radius pipette probes ... 76
2.6.3 AC current magnitude approach curves ... 76
Chapter 3. Bias Modulated Scanning Ion Conductance Microscopy ... 81
3.1 Abstract ... 82
3.2 Introduction ... 83
3.3 Materials and Methods ... 86
3.3.1 Solutions ... 86
3.3.2 Nanopipettes ... 86
3.3.3 Substrates ... 86
3.3.4 Instrumentation ... 86
3.3.5 Bias Modulated SICM Procedure ... 87
3.3.6 Distance Modulated SICM ... 88
3.3.7 Impedance Measurements ... 88
3.4 Results and Discussion ... 88
3.4.1 Approach Curves ... 88
3.4.2 Impedance Measurements ... 91
3.4.3 Mapping Topography ... 96
3.5 Conclusions ... 98
3.6 References ... 99
Chapter 4. Simultaneous Nanoscale Surface Charge and Topographical Mapping 102 4.1 Abstract ... 103
4.2 Introduction ... 104
4.3 Materials and Methods ... 106
4.3.1 Solutions ... 106
4.3.2 Nanopipettes ... 107
4.3.3 Substrates ... 107
4.3.4 Instrumentation ... 107
4.3.5 Bias Modulated-Scanning Ion Conductance Microscopy Approaches ... 108
4.3.6 Bias Modulated-Scanning Ion Conductance Microscopy Imaging ... 108
4.3.7 FEM Simulations ... 109
4.3.8 Impedance Measurements ... 109
4.3.9 Atomic Force Microscopy ... 109
4.4 Results and Discussion ... 109
4.4.1 Bias Modulated-SICM as an Ion-Sensing Probe of Double Layers ... 109
4.4.2 Theory and Simulations ... 114
4.4.3 Probing Acid-Base Equilibria at Interfaces ... 119
4.4.4 Surface Charge Mapping ... 121
4.5 Conclusions ... 124
4.6 Supporting Information ... 125
4.6.1 FEM model details ... 125
4.6.2 Impedance measurements ... 127
4.6.3 Typical AC amplitude approach curves ... 127
4.6.4 Approach curves in electrolytes of high ionic strength ... 128
4.6.5 Theoretical DC approach curves ... 129
4.6.6 Approach curves at varying pH ... 130
4.6.7 Experimental phase-voltage curves ... 131
4.7 References ... 132
Chapter 5. Characterisation of Nanopipettes ... 136
5.2 Introduction ... 138
5.3 Materials and Methods ... 139
5.3.1 Nanopipette Probes ... 139
5.3.2 Solutions ... 140
5.3.3 Instrumentation ... 140
5.3.4 Nanopipette Voltammetry ... 140
5.3.5 Optical Microscopy ... 141
5.3.6 TEM Imaging of Nanopipettes ... 141
5.3.7 FEM Simulations of Nanopipettes in Bulk Solution ... 141
5.3.8 BM-SICM Surface Charge Mapping of Glass Substrate ... 142
5.3.9 Quantification of Surface Charge ... 142
5.4 Results and Discussion ... 143
5.4.1 Evaluation of Existing Methods for Nanopipette Characterisation ... 143
5.4.2 Characterisation of Nanopipettes in High Ionic Strength Media ... 145
5.4.3 Quantifying Nanopipette Surface Charge in Low Ionic Strength ... 150
5.4.4 Quantifiable Surface Charge Mapping of Extended Substrates ... 152
5.5 Conclusions ... 154
5.7 Supporting Information ... 155
5.7.1 FEM Model Equations and Boundary Conditions ... 155
5.7.2 Full Magnification Range of TEM ... 156
5.7.3 Table of Dimensions ... 157
5.7.4 Data from Tips 4, 6 and 8 ... 158
5.7.5 Circuit Diagram of BM-SICM Setup ... 158
5.7.6 AC Phase Approach Curve ... 159
5.8 References ... 160
Chapter 6. Surface Charge Visualisation at Viable Living Cells ... 165
6.1 Abstract ... 166
6.2 Introduction ... 167
6.3 Materials and Methods ... 169
6.3.1 Solutions ... 169
6.3.2 Cell Culturing and Preparation ... 169
6.3.3 Imaging Substrates ... 170
6.3.4 Nanopipette Fabrication ... 170
6.3.5 Instrumentation ... 170
6.3.6 Topographical and Surface Charge Mapping ... 171
6.3.7 FEM Simulations ... 171
6.4 Results and Discussion ... 172
6.4.1 Principles of Surface Charge Mapping with a Nanopipette ... 172
6.4.2 FEM Simulations ... 175
6.4.3 Mapping Charge at Root Hair Cells: Proof-of-Concept Measurements ... 176
6.4.4 Surface Charge Mapping in Physiological Conditions ... 180
6.5 Conclusions ... 183
6.6 Supporting Information ... 184
6.6.1 FEM Simulation Details ... 184
6.6.2. Working Curve for Quartz Nanopipette ... 186
6.6.3. Adipocyte Cell Line Profiles ... 186
Chapter 7. Fast Nanoscale Surface Charge Mapping with Pulsed-Potential Scanning
Ion Conductance Microscopy ... 192
7.1 Abstract ... 193
7.2 Introduction ... 194
7.3 Materials and Methods ... 195
7.3.1 Solutions ... 195
7.3.2 Nanopipettes and Electrodes ... 196
7.3.3 Substrates ... 196
7.3.4 Cell Culturing Procedure ... 196
7.3.5 Instrumentation ... 196
7.3.6 Fast Charge Mapping SICM ... 197
7.3.7 FEM Simulations ... 197
7.4 Results and Discussion ... 198
7.4.1 Scanning Regime for Interfacial Charge Mapping ... 198
7.4.2 Validation of the Technique with a Polystyrene Film on Glass ... 202
7.4.3 Surface Charge Mapping of Neuron-like PC12 Cells ... 204
7.5 Conclusions ... 206
7.6 Supporting Information ... 207
7.6.1 Dimensions of Nanopipettes ... 207
7.6.2 FEM simulations ... 209
7.6.3 More Complete Polystyrene Scan ... 210
7.6.4 Previous Polystyrene Scan Data ... 210
7.6.5 Raw PC12 Scan Data ... 211
7.7 References ... 211
Chapter 8. Electrochemical Control of Calcium Carbonate Crystallisation and Dissolution in Nanopipettes ... 214
8.1 Abstract ... 215
8.2 Introduction ... 216
8.3 Materials and Methods ... 217
8.3.1 Solutions ... 217
8.3.2 Nanopipettes ... 218
8.3.3 Instrumentation ... 218
8.3.4 Bias Driven Crystallisation Experiments ... 218
8.3.5 FEM Simulations ... 219
8.3.6 Raman Spectroscopy ... 220
8.4 Results and Discussion ... 220
8.4.1 Growth of Calcium Carbonate in a Nanopipette Under Electrochemical Control ... 220
8.4.2 Mixing of Ca2+ and CO32- in a Nanopipette ... 224
8.4.3 Quantifying Growth Rates in a Nanopipette ... 228
8.4.4 The Effect of Applied Bias on Blocking Rates ... 230
8.4.5 Effect of Additives ... 232
8.5 Conclusions ... 234
8.6 References ... 235
List of Figures
Figure 1.1. Schematic of SICM Setup and principles of operation ... 5
Figure 1.2. SICM feedback types ... 8
Figure 1.3. Micrographs of SICM probes ... 10
Figure 1.4. Example SICM topographical image of a PC12 cell ... 11
Figure 1.5. Principles of patch clamp SICM ... 15
Figure 1.6. SECM-SICM configuration ... 22
Figure 1.7. SICM-AFM configuration ... 23
Figure 1.8. SECCM Configuration ... 24
Figure 1.9. Structure of DDL ... 27
Figure 1.10. Ion current rectification ... 30
Figure 1.11. Principles of resitive pulse sensing ... 36
Figure 2.1. Schematic of an SICM Probe for surface charge measurements ... 52
Figure 2.2. DC approach curve to charged substrates at varying bias ... 59
Figure 2.3. FEM concentration profiles with nanopipette near charged interfaces ... 62
Figure 2.4. AC phase data from approach curves ... 65
Figure 2.5. Topographical and surface charge maps of polystyrene film ... 67
Figure 2.6. Topographical and surface charge maps of PLL spot ... 69
Figure 2.7. Simulation domain schematic and approach curves ... 73
Figure 2.8. Bulk simulated concentration profiles ... 74
Figure 2.9. Effect of electro-osmotic flow on simulations ... 75
Figure 2.10. Nanopipette bulk current-voltage response ... 76
Figure 2.11. AC amplitude approach curves ... 77
Figure 3.1. Schematic of BM-SICM ... 84
Figure 3.2. Experimental AC approach curves at a range of frequencies ... 89
Figure 3.3. Effect of electrolyte concentration on the AC response ... 90
Figure 3.4. Impedance measurements with varying tip-substrate separation ... 92
Figure 3.5. Theoretical approach curves at range of frequencies ... 95
Figure 3.6. Topographical maps of gold bands and calcite etch pit ... 97
Figure 4.1. Concepts for simultaneous topographical and surface charge mapping ... ... 111
Figure 4.2. Experimental BM-SICM approach curves to charged substrates ... 113
Figure 4.3. Simulated BM-SICM approach curves and concentration profiles ... 116
Figure 4.4. Experimental approach curves in different pH solutions ... 121
Figure 4.5. Simultaneous surface charge and topographical maps of polystyrene .. 123
Figure 4.6. Schematic of FEM simulation domain and SEM of nanopipette ... 126
Figure 4.7. Impedance response of nanopipette ... 127
Figure 4.8. AC amplitude approach curve at varying bias ... 128
Figure 4.9. Effect of concentration on BM-SICM approach curves ... 129
Figure 4.10. Simulated DC approach curves to different charged substrates ... 130
Figure 4.12. Experimental phase-voltage characteristics of s nanopipette in bulk and
near charged substrates ... 132
Figure 5.1. Typical TEM micrographs of nanopipettes ... 146
Figure 5.2. I-V characteristics in high electrolyte conditions ... 148
Figure 5.3. Theoretical nanopipette responses ... 150
Figure 5.4. I-V characteristics in low electrolyte conditions ... 151
Figure 5.5. Quantitative surface charge mapping ... 153
Figure 5.6. Schematic of the FEM simulation boundary conditions ... 156
Figure 5.7. Full sequence of TEM Images for a used nanopipette ... 157
Figure 5.8. I-V characteristics of duplicate nanopipettes ... 158
Figure 5.9. Circuit diagram of the BM-SICM setup ... 159
Figure 5.10. AC phase shift approach curve ... 160
Figure 6.1. Schematic of BM-SICM for non-convoluted surface charge/topographical mapping of cells ... 172
Figure 6.2. Cartoons of principles of surface charge mapping ... 174
Figure 6.3. Simulated working curve of normalised current versus surface charge for a borosilicate nanopipette ... 175
Figure 6.4. BM-SICM surface charge and topographical mapping of root hair cell .. 176
Figure 6.5. High-resolution surface charge mapping of root hair cell ... 179
Figure 6.6. BM-SICM imaging of adipocyte cells in physiological conditions ... 182
Figure 6.7. FEM simulation domain and TEM images of nanopipettes ... 185
Figure 6.8. Simulated working curve of normalised current versus surface charge for a quartz nanopipette ... 186
Figure 6.9. Line profiles across charge heterogeneity on adipocyte cell ... 187
Figure 7.1. Principles of fast charge mapping with SICM ... 200
Figure 7.2. Surface charge mapping of polystyrene ... 203
Figure 7.3. Surface charge mapping of PC12 cells ... 205
Figure 7.4. TEM of nanopipette used in experiments ... 208
Figure 7.5. Schematic of FEM simulation domain ... 209
Figure 7.6. Fast charge mapping of more complete polystyrene region ... 210
Figure 7.7. Comparative data collected with previous scan regime ... 211
Figure 7.8. Normalised current map of PC12 cell ... 211
Figure 8.1. Principles of induced crystallisation in a nanopipette ... 221
Figure 8.2. Effect of concentration on blocking time ... 224
Figure 8.3. Mixing in a nanopipette - concentration profiles ... 225
Figure 8.4. Time dependent FEM simulation Results ... 227
Figure 8.5. Quantifying crystal growth rates ... 229
Figure 8.6. Effect of driving bias on crystallisation time ... 231
List of Tables
Table 3.1. Parameters used to fit the impedance data in Figures 3.4 a-c. ... 95
Table 4.1. Summarised boundary conditions for the FEM model. ... 126
Table 5.1. Dimensions of quartz and borosilicate nanopipettes characterised ... 157
Table 6.1. Summarised boundary conditions for the FEM model. ... 185
Table 7.1. Dimensions of nanopipettes used for polystyrene and PC12 scans ... 208
Abbreviations
SICM Scanning Ion Conductance Microscopy
BM-SICM Bias Modulated Scanning Ion Conductance Microscopy DM-SICM Distance Modulated Scanning Ion Conductance Microscopy P-SICM Potentiometric Scanning Ion Conductance Microscopy FEM Finite Element Method
I-V Current-Voltage
SIR Surface Induced Rectification ICR Ion Current Rectification
SECM Scanning Electrochemical Microscopy SECCM Scanning Electrochemical Cell Microscopy SPM Scanning Probe Microscopy
SPR Scanning Plasmon Resonance SEM Scanning Electron Microscopy
FE-SEM Field Emission Scanning Electron Microscopy TEM Transmission Electron Microscopy
AFM Atomic Force Microscopy
QRCE Quasi Reference Counter Electrode FPGA Field Programmable Graphics Array DDL Diffuse Double Layer
AC Alternating Current
DC Direct Current
CV Cyclic Voltammogram
UME Ultra-microelectrode PLL Poly-L-Lysine
APTES (3-Aminopropyl) triethoxysilane DTC Doctoral Training Centre
Acknowledgements
Firstly, I would like to thank my supervisor Prof Patrick R. Unwin for all of his support, encouragement and enthusiasm throughout my PhD. I also would like to thank Prof Bruno G. Frenguelli and Dr Phil Young for their help with cell culturing and advice in the latter stages of my project.
Thank you to all of the people who have helped to establish the Warwick Electrochemical Platform without which my project would not have been as successful.
Next, thank you for everyone in the Warwick Electrochemistry and Interfaces Group who make it such a great place to work day to day and for all the help, expertise and advice that they have been able to provide. Thanks to Dmitry and Rehab for all of their advice and help and special thanks in the group to ‘Team Cell’ as Binoy, Ashley and honorary member Minkyung have been fantastic to work with over the last few years and have provided huge amounts of help.
My two hockey clubs, helped keep me sane throughout my many years at Warwick and were one of the biggest parts of my time here, thank you for all the friends I have made throughout my time and their support, especially to Toby and Bates for all the steak nights!
Without the love and support of my parents I would not have been able to achieve any of what I have done so far and I will always be grateful for all that you have done for me. Thank you also to my brother, Chris, whose constant calling me an idiot has spurred me on to this! Also to my Nanny, who has provided me with chocolate and beer throughout my student years, which has been much needed!
Declaration
The work presented in this thesis is entirely original and my own work, except where acknowledged in the text. I confirm that this thesis has not been submitted for a degree at another University. This work is being submitted for thesis by publication.
Chapter 2 was published as:
Surface Charge Mapping with a Nanopipette. Kim McKelvey, Sophie L. Kinnear, David Perry, Dmitry Momotenko, and Patrick R. Unwin, J. Am. Chem. Soc. 2014, 136, 13735–13744. This manuscript also provided the basis of a chapter in Sophie L. Kinnear’s thesis who jointly performed the experiments.
Chapter 3 was published as:
Bias modulated scanning ion conductance microscopy
Kim McKelvey, David Perry, Joshua C. Byers, Alexander W. Colburn, Patrick R. Unwin,
Anal. Chem. 2014, 86, 3639-3646 Chapter 4 was published as:
Simultaneous Nanoscale Surface Charge and Topographical Mapping
David Perry, Rehab Al Botros, Dmitry Momotenko, Sophie L. Kinnear, and Patrick R. Unwin, ACS Nano 2015, 9, 7266–7276. Some sections also feature in the thesis of Rehab Al Botros, who performed much of the simulation work.
Chapter 5 was published as: Characterization of Nanopipettes
David Perry, Dmitry Momotenko, Robert A. Lazenby, Minkyung Kang, and Patrick R. Unwin, Anal. Chem. 2016, 88, 5523–5530
Chapter 6 was published as:
Surface Charge Visualization at Viable Living Cells
David Perry, Binoy Paulose Nadappuram, Dmitry Momotenko, Philip D. Voyias, Ashley Page, Gyanendra Tripathi, Bruno G. Frenguelli, and Patrick R. Unwin,
Chapter 7 was published as:
Fast Nanoscale Surface Charge Mapping with Pulsed-Potential Scanning Ion Conductance Microscopy
Ashley Page, David Perry, Philip Young, Daniel A Mitchell, Bruno G Frenguelli, and Patrick R Unwin, Anal. Chem. 2016, 88, 10854–10859
Chapter 8 was published as:
Electrochemical Control of Calcium Carbonate Crystallization and Dissolution in Nanopipettes
David Perry, Alexander S. Parker, Ashley Page, and Patrick R. Unwin,
ChemElectroChem 2016, 10.1002/celc.201600547
Additionally, I have contributed to the following papers whose results are not presented in this thesis:
Time-Resolved Detection and Analysis of Single Nanoparticle Electrocatalytic Impacts
Minkyung Kang, David Perry, Yang-Rae Kim, Alex W. Colburn, Robert A. Lazenby, and Patrick R. Unwin, J. Am. Chem. Soc., 2015, 137, 10902–10905
Single Molecule Electrochemical Detection in Aqueous Solutions and Ionic Liquids Joshua C. Byers, Binoy Paulose Nadappuram, David Perry, Kim McKelvey, Alex W. Colburn, and Patrick R. Unwin, Anal. Chem., 2015, 87, 10450–10456
Nucleation and Aggregative Growth of Palladium Nanoparticles on Carbon Electrodes: Experiment and Kinetic Model
Yang-Rae Kim, Stanley C. S. Lai, Kim McKelvey, Guohui Zhang, David Perry, Thomas S. Miller, and Patrick R. Unwin, J. Phys. Chem. C, 2015, 119, 17389–17397
Frontiers in Nanoscale Electrochemical Imaging: Faster, Multifunctional, and Ultrasensitive
Minkyung Kang, Dmitry Momotenko, Ashley Page, David Perry, and Patrick R. Unwin,
Abstract
This thesis presents advances made to the scanning ion conductance microscope (SICM), a tool predominantly used to date for topographical imaging of biological samples. This technique is demonstrated to be a powerful tool for non-invasive surface charge mapping as well, through probing of the diffuse double layer formed at charged interfaces. Surface charge mapping with SICM is demonstrated for a range of samples, including biological systems, and it is shown that through the use of a novel feedback technique, also introduced herein, and newly implemented scanning regimes, that the surface charge information can be elucidated unambiguously, together with topography.
Through adopting a characterisation protocol presented in this work, which helps provide a fuller understanding of the used nanopipette probe, the SICM response to charged interfaces and also in bulk solution can become quantitative, allowing for surface charge values for cell membranes and other substrates to be determined. This combination of: SICM experiments, complete probe characterisation and FEM simulations serves as a robust platform for investigating biological and other charged interfaces. The surface charge mapping protocols used allow for unseen surface charge heterogeneities, presented on cell membranes, to be identified and are amenable to future studies, performed in combination with other microscopy techniques, that could help correlate charged domains with physiological function.
Chapter 1. Introduction
1.1 Aims of ThesisThis thesis is concerned with the development of scanning ion conductance microscopy (SICM), a scanning probe microscope technique (SPM), first introduced in 1989,1 and how its capabilities can be developed, and its function extended to applications beyond topographical mapping, becoming in the process a more powerful tool for probing the structure and function of both living and non-living systems. The presented developments include the introduction of an improved feedback approach for positioning of the SICM probe above the substrate of interest. As a consequence of this new feedback approach, it also becomes possible to extract more functional information about the system being probed, specifically information about the presented surface charge which, when combined with a robust theoretical model of the probe and surface, becomes quantitative in nature.
Each chapter of this thesis contains the manuscript together with supporting information, where relevant, from work that has been published in peer reviewed journal articles. Chapter 2 describes initial work that demonstrates that the SICM response, used for feedback in a host of topographical studies of living systems, is inherently sensitive to the surface charge of a sample.2 The implications of this, with regards to the accuracy of probe positioning, and the possible capabilities of the technique for mapping surface charge heterogeneities, are discussed. In light of these issues with probe positioning, chapter 3 introduces a new feedback type to the SICM.3 Termed bias modulated (BM-) SICM, this approach generates an alternating current (AC) signal, through applying a small oscillation around 0 V between the two SICM quasi reference counter electrodes (QRCEs), which can then be used for feedback.
switched in order to obtain surface charge information. In all of these initial studies, the FEM simulations performed have served to validate, and inform, the technique, but failed to provide quantitative information about the surface charge of samples. This task requires a complete knowledge of the probe’s geometric and surface charge properties, as these also affect the SICM response. Chapter 5 considers how best to characterise nanopipettes in order to overcome this problem.5 Previous work has focussed on using scanning electron microscopy (SEM) or analytical approaches to characterise pipettes but this is shown to be insufficient and instead transmission electron microscopy (TEM) characterisation is shown to be necessary for providing a sufficient understanding of the nanopipette when combined with FEM simulations and voltammetric experiments.
Chapter 6 moves on to consider the limits of SICM as a tool for surface charge mapping and it is shown that these observations, and the ability to map heterogeneous surface charge, are not limited to low ionic strengths and inert samples. It is demonstrated that it is possible to observe surface charge heterogeneities, not previously seen or accessible with other techniques, on the surface of living cells in physiological electrolyte conditions.6 Chapter 7 discusses some ways in which the resolution of this technique can be improved resulting in surface charge maps collected at much higher rates and with greater fidelity. Finally, using the same configuration as SICM experiments, chapter 8 considers the nanopipette itself and how it can be used as a reaction centre for forming crystal nuclei, growing crystals in the nanopipette. This methodology is then used as a tool for screening growth additives with high control and time resolution, allowing for their efficacy to be ranked. The final chapter will summarise and consider the implications of these studies and how SICM could be developed further still and the possible applications of these proof of concept studies going forward for the consideration of living and non-living systems.
1.2 Scanning Probe Microscopy
SPM technique takes advantage of a specific type of interaction between the probe, which also varies between each SPM technique, and the interface in order to provide morphological or functional information about it. Some of the primary examples of SPM techniques include: atomic force microscopy (AFM),8-9 scanning tunnelling microscopy (STM),10-11 Scanning electrochemical microscopy (SECM)12-14 and SICM1, 15, which is the focus of this work. Each of these techniques finds application in
different areas and each has their own merits and disadvantages. SECM, for example, has been used extensively for electrochemical mapping of electrodes and other interfaces14, 16-20 as well as for detection of various ions and pH using functionalised electrodes,21-24 but miniaturising the SECM probes is challenging and the topographical information that can be obtained from SECM experiments is often of poorer resolution than that possible with other SPM techniques.25 Consequently, hybrid techniques such as SICM-SECM25-28 and AFM-SECM29-31 have become more common in recent years, combining the high-resolution topographical information that can be attained with SICM or AFM, with the electrochemical information provided by SECM. In doing so, this allows for a correlation of structure and function to be attained.
The resolution of SPM techniques is a key consideration in their usage as it determines the level of information that they can attain and is usually related to the type and size of the probe employed. Typically, SPM techniques span from the microscale, in the case of SECM, which use ultra-microelectrode (UME) probes,25 down to the nanoscale for SICM, which uses a nanopipette probe,15, 32-34 and can even obtain atomistic level information when STM35-36 and AFM37-38 are employed. SPMs can provide a wealth of information not accessible with other microscopic techniques and they are becoming increasingly valuable for answering key questions about a host of different interfaces.
1.3 Scanning Ion Conductance Microscopy
predominantly been used as a tool for topographical mapping of samples33-34, 39-41 as well as some studies where it has been used to measure ionic conductance through porous substrates1, 42-44 and for local delivery from, or patterning with, the nanopipette probe.45-46
1.3.1 Principles of Operation
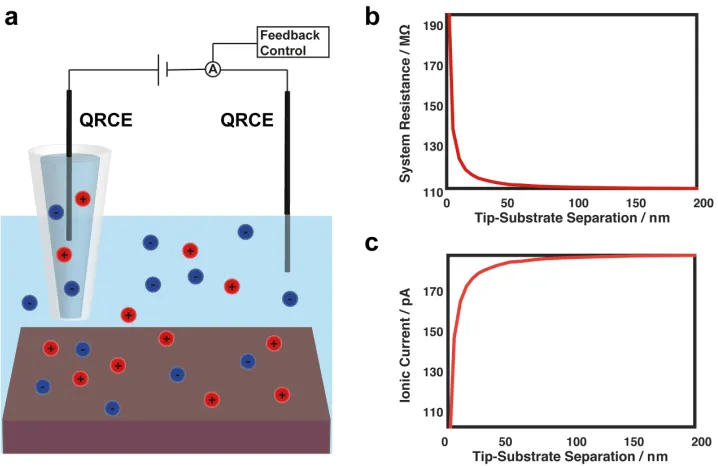
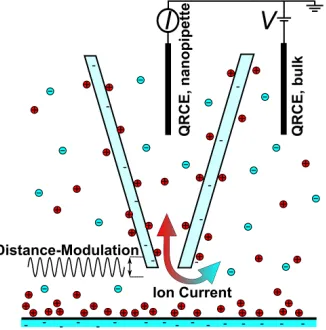
SICM is used for probing an interface that is bathed in a conducting electrolyte solution. A single channel nanopipette probe is usually filled with a similar electrolyte solution along with a QRCE, with a second QRCE placed in bulk solution. Typically, a bias is applied between the two QRCEs to drive a current through the end of the nanopipette, which can be recorded, as depicted in Figure 1.1a. In bulk solution, with the probe positioned away from the substrate, the resistance of the nanopipette, together with the conductivity of the electrolyte solution, are what contribute most to determine the ionic current that flows. The majority of this resistance is accounted for by the narrowest region of the nanopipette, near the nanopipette opening. As the inner lumen of the pipette gets wider, the contribution to the overall pipette resistance goes down.15
Figure 1.1. a) Schematic of the SICM setup with a nanopipette filled and bathed in electrolyte solution above the substrate of interest. A bias is applied between a QRCE in the nanopipette and one in bulk solution in order to generate an ionic current, which can sense the surface. b) Upon approaching within one tip diameter (100 nm) of the surface, an increase in the resistance is observed as a result of the reduced access of ions to the probe opening. c) A drop off in the recorded ionic current is observed as a consequence of the increased resistance.
1.3.2 Feedback Types and Scanning Regimes
The probe position is often controlled by piezo electric positioners, which allow for sub-nm precision in moving the pipette vertically or laterally across the surface. These piezo electric positioners are controlled by applying a voltage, usually controlled via a computer interface, which leads to an expansion or contraction of the piezo material. A feedback loop can be setup such that the piezo electric positioners move the nanopipette probe towards the surface until the current drops below a certain value. The expansion of the piezo, in the z direction, at this point can then be extracted to infer on the nanopipette position and used to generate a topographical map of the sample. At this point, the probe can be scanned across the surface, with the piezo positioners adjusting the height of the nanopipette above the sample, aiming to maintain a constant current value. This current value should correspond to the same tip-substrate separation distance and this scanning mode is termed constant distant scanning and often is performed in a raster scan pattern.1, 15, 33, 48 Alternatively, pixel wise measurements can be made, whereby once the set
point current value is reached upon approach, the probe is then retracted away, moved laterally to a new location before repeating. This has advantages for mapping samples that have large height gradients, where a constant distance scan mode may not be able to track the steep changes accurately or quickly enough. This scan regime is known as a hopping or standing approach mode.39, 41, 49-50 Whilst the constant distance mode has advantages in terms of being able to perform scans at a faster rate, hopping mode holds key advantages such as being able to make self-referencing measurements to bulk values at each pixel. This becomes particularly beneficial, as will be discussed in later chapters, for trying to elucidate surface properties other than topography using SICM, whereby the bulk properties of the nanopipette need to be subtracted to reveal the effects of the surface.
from a bulk value at each pixel. Even In hopping mode scans, if the ionic current is drifting too much, false approaches may occur whereby the SICM has not actually sensed the surface at all and so the produced topographical map may contain false height information. To avoid these affects, modulation techniques can be employed in order to generate an AC signal. Usually this is achieved through oscillating the nanopipette position up and down at an applied frequency, typically in the 100 Hz – 1000 Hz range. A lock-in amplifier can then be used to extract the ionic current response at the same frequency. This provides a signal that is much less noisy than the raw ionic current and is less susceptible to drift effects.51-54
Using this distance modulated (DM-) approach (Figure 1.2b), when the nanopipette is in bulk solution, more than one tip diameter away, no AC signal is expected because there would be little difference in the conductance state between when the nanopipette is furthest and closest to the surface, across an oscillation cycle. However, as the ionic current begins to respond to changes in the resistance, as the nanopipette approaches the substrate, there will subsequently be a variation in the conductance state throughout the oscillation period and as such there will be a resulting AC signal. This AC signal can be described by both its amplitude and a phase angle component, with respect to the applied modulation signal. Typically, in DM-SICM experiments, for example those presented in chapter 2 of this thesis, an increase in the AC amplitude is used for feedback. A threshold value of the AC amplitude can be set and upon reaching this value, the piezo electric positioners will cease to move the nanopipette further towards the substrate and the substrate height can be extracted.15
information can be obtained about the total system resistance and capacitance. The relative contribution of these two components to the SICM response can be explored through considering how the AC phase signal changes in an SICM experiment. In BM-SICM, where there is a measurable AC signal even when the probe is positioned far from the substrate, the bulk capacitive properties of the nanopipette can also be determined.
Figure 1.2. Schematic depiction of three SICM feedback types. a) In the DC approach a drop off in the ionic current is used to sense the substrate. b) In DM-SICM an oscillation is applied to the nanopipette probes z position generating an AC current, which is only significant when the nanopipette approaches the substrate. c) In BM-SICM an oscillation is instead applied to the bias between the QRCE in the nanopipette and outside generating an AC signal which is sensitive to the substrate even when no net bias is applied.
signal and this time constant is chosen relative to the oscillation frequency applied.55 For higher oscillation frequencies, where the oscillation period is less, a smaller time constant is required to extract the AC signal over. Typically, in order to get a clean AC signal, the time constant should be approximately 3-4 times the period of oscillation. If the time constant is smaller, the AC signal may be too noisy, but if the time constant is too great the response time will be too long. In unmodulated SICM approaches, the ionic current responds near instantaneously to changes in the conductance, depending on the current follower used, and so faster approach speeds can often be achieved, which is part of the focus of chapter 7 where a trade-off between faster imaging and more accurate surface charge and topographical information is explored.
1.3.3 The SICM Probe
SICM employs a single barrelled micropipette or nanopipette as its probe, which is usually fabricated from either a glass or quartz capillary. The capillary is heated in the centre using a laser puller, whilst a simultaneous pulling force is applied to each end of the capillary. Where the laser heats the capillary, it is melted and the pulling force distorts the glass, pulling it finer until the two halves of the capillary separate, yielding two similar halves, which have a fine taper at the end. The parameters used in the production of these nanopipettes can be varied to give a variety of geometries, depending on the desired application. Depending on the heat used, pulling force and material chosen it is possible for pipettes spanning the nanometre to micrometre scale to be fabricated.
important task and is the subject of chapter 5.5 It is common practice to take one of several approaches to characterise the nanopipette used in SICM experiments. In order to get geometrical parameters of nanopipettes, scanning electron microscopy (SEM) is commonly used.58, 60-62 SEM can provide some information useful for characterising nanopipettes allowing for estimates of the nanopipette opening size, as shown in Figure 1.3a as well as how the overall diameter of the nanopipette varies up its length. As chapter 5 explores, this is insufficient knowledge to interpret and capture the nanopipette response fully and techniques that provide information about the nanopipette lumen up the length of the nanopipette become necessary, which is only possible through using transmission electron microscopy (TEM), as exemplified in Figure 1.3b. An alternative strategy that is used, and is evaluated in chapter 5, is the use of analytical equations for estimating the nanopipette geometric parameters from the recorded SICM signal in bulk. Commonly used in other SPM techniques, this approach fails when the nanopipette deviates significantly from the assumed geometry, which is usually approximated as being conical in the most significant region for determining resistance. As will be discussed later, these approaches also suffer when the nanopipettes are operated in conditions where the surface chemistry of the nanopipette material also begins to influence its response.
1.3.4 Morphological Studies of Live Cells
To date the majority of the applications of SICM have primarily been focussed around mapping the surface topography of conducting samples. The non-contact method of SICM feedback, established by either the DC or modulation based approach, makes SICM a comparably non-invasive technique in contrast to force/contact based probe techniques. This, combined with the wide range of possible imaging media available for use in SICM experiments, makes it particularly suitable for the consideration of living cells. As such, a large number of SICM studies have been carried out studying the morphology of a variety of living cells and biological systems, both in their natural state and also to observe their response to varying stimuli, which may be chemical or mechanical. Figure 1.4 shows an example topographical image obtained using DC mode SICM of a group of PC12 cells.
Figure 1.4. SICM topographical image of three PC12 pheochromocytoma cells in close proximity showing processes extending from the cell bodies.
The first studies of cell morphology using the SICM were conducted in 199733, 63 in work that demonstrated the benefits of its non-invasive nature, showing there
substrate so that damage, or perturbations to the cell’s natural state, could occur. This means that SICM, which can probe a substrate from a distance of tens-hundreds of nanometres away is much less invasive, reducing the risk of perturbing cellular processes or damaging the cell.59 Another advantage of the SICM over other techniques, for the study of cells, is that there is a minimal preparation required. They can be imaged in physiological buffers because of the high electrolyte composition present in them. Although not in the scope of the initial SICM study, the possibility of being able to simultaneously deliver drugs or other stimuli to the cell surface, using the SICM, were already proposed, as well as options for micromanipulation with the probe and using it for electrophysiological studies. Since its inception, there have been many more studies focussed on using SICM for probing and mapping other living systems, many of which are discussed below.
Through the acquisition of several topographical maps, it is possible to see how the volume and morphology of a cell varies over time.48, 62, 63 Regulation of the cell volume is an important homeostatic mechanism, as there is a constant flux of material across the cell membrane, and studies using SICM have provided insights into how the volume of cells is controlled and varies in response to changes in osmolality.48, 64 Because of the high spatial resolution achievable with SICM, it is then possible to see where the changes in volume are taking place across the cell from where the height maps differ between scans.
scans performed over a long time period become possible thanks to the robustness of the SICM feedback, particularly when employed in a DM mode, and can help to identify the morphological changes that occur throughout the cell cycle and during cell division.66 Other cellular processes, such as exocytosis, can also be studied, providing quantitative information about the subsequent changes in cell surface area that occur.68
SICM can allow for imaging on the single protein level, as has been demonstrated for immobilised proteins on a substrate, as well as for proteins presented on the surface of living cells.58 As well as allowing for topographical imaging of processes and proteins present on the cell membrane, it is also possible to locally manipulate cells with the SICM, where in one study the probe could be used to guide and promote the development of neuronal growth cones protruding from them, changes which could be subsequently tracked with topographical scans.69
Whilst much of the early work studying living cells utilised a constant distance scanning approach, maintaining the SICM set point as the probe is scanned laterally across the surface, more recent work has focussed on the use of a hopping, or standing approach, protocol, whereby pixel-by-pixel maps of surface topography are built up through a repeated approach-extract height-retract-move laterally regime.39, 41, 70 This mode introduced a more stable method for scanning living cells, where changes in surface height can be quite steep and hence there would be the risk of the probe and cell colliding with constant distance scanning. Additionally, hopping mode SICM allows for a self-referencing approach to be taken where at each pixel the SICM response can be considered relative to its bulk value. This makes the technique more robust to drifts in the ionic current caused by changes in the ionic composition, thus facilitating longer scan times.70 Using this approach, finer cellular structure could be revealed with the SICM and it became possible, for example, to image and track the motion of stereocillia on murine hair cells and also to map neurites from neuronal type cells.39 The total scan area and hopping distance can be tuned to achieve the desired resolution and scan time.
differences between neighbouring cells. Through identifying morphological variations between individual cells it is possible to distinguish, and categorise, the different types present in a group of cells, or to identify abnormal, possibly diseased, cells. As an example, three different types of neuroblastoma cells studied were each seen to exhibit a characteristic height, width and length and from measurements, obtained using the SICM, they could be quickly screened and categorised.71 SICM used in the study of cardiac tissue, could quickly identify damaged cells from the loss of T-tubules on the cell surface and a flattening process, where the Z-groove present on the cell membrane disappears.72-73 From such phenotypic variations, it is thus possible to use SICM to identify unhealthy tissue from healthy tissue.
The response of the cell membrane to stimuli can also be observed using SICM; treatment of cardiac cells with formamide, for example, also results in a similar loss of T-tubules and reduction in the Z-groove dimensions.72 Studies of cardiac tissue have considered the use of SICM for the study of other forms of cardio vascular diseases as well, considering how morphological changes in the cell and structural properties relate to arrhythmias, heart failure, atherosclerosis, hypertrophy and mechanical dysfunction of the heart.74 It is even possible with SICM to track the contractions of cardiac cells, which can help distinguish cardiomyocytes amongst other cell types as well as to help identify anomalies with contractions.75
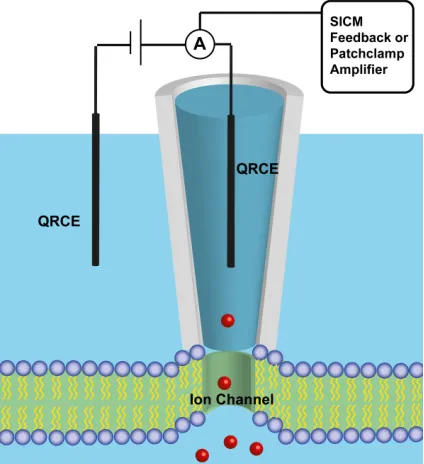
Electrophysiological studies are also possible with the SICM probe employed in a smart patch clamp mode, where the nanopipette is used for both topographical measurements as well as patch clamp recordings.50, 66, 79-81 The patch clamp is a technique that allows for the dynamics and mechanism of individual or small clusters of ion channels present on a cell membrane to be studied.82-83 A glass nano- or micropipette is used to seal the area around an ion channel, as depicted in Figure 1.5, and, together with the application of suction, forms a high resistance seal of the order of gigaohms.84 Subsequently the ion channels can be studied through recording the current that passes through them. The ion channels can also be stimulated from the nanopipette with ions or toxins, for example, and the response of the ion channels to these can be monitored.80-81 Whereas in traditional patch clamp measurements, where optical microscopy is used to position the patch clamp probe near the region of the cell membrane to be studied, the combined SICM/patch clamp allows for SICM feedback to be used instead, allowing for a more automated procedure that also enables correlative topographical information to be extracted to guide and relate to the patch clamp measurements.85 A host of different ion channels can be explored in this technique including K+, Na+, Cl-, and Ca2+ selective channels.84
Other studies of living cells using SICM have involved applying the technique for assessing the stiffness of living cells and measuring the elasticity of the cell membrane.59, 62 Two approaches have been taken for this task. The first combines results from both AFM and SICM measurements, using the difference between the force based scan and non-contact measurement to inform on the stiffness.59, 86 The second approach involves inducing a small pressure driven flow through the end of the nanopipette to perturb the cell membrane surface. Through measuring the height differences between SICM measurements with, and without, the flow present, information about the cell elasticity can be obtained.62 These approaches are not limited to single measurements but can spatially resolve regions of the cell membrane that are more or less rigid, thus allowing for a correlation with other known cell function. As well as being used to measure stiffness of cells, pressure driven flow through a nanopipette has also been utilised as a tool for applying mechanical stimuli to neuronal cells over a small area. This approach is highly localised as it acts only over the footprint of the nanopipette probe, and thus can locally stimulate without perturbing the whole cell.80 Using this approach, the response of mechanosensitive ion channels for example has been observed.80
1.3.5 Other Applications
SICM has been used in a similar manor for locating ion channels or pores on membranes and other surfaces. Using a DM-SICM approach for probe positioning, it has been demonstrated that the ionic current can detect changes in the ionic atmosphere present around a nanopore where an ion current has been induced through establishing a concentration gradient across it.42, 87 The conductance information can be correlated to the topographical information of the SICM scan and the ionic transport through the nanopore can be well modelled.43 The obtained information can provide diagnostic information about the nanopore itself with it being shown that the SICM can distinguish between conical and cylindrical nanopores from the measured resistance across the membrane.88
Further studies have explored the capabilities of SICM for imaging biological nanopores. Through imaging a membrane bathed in potassium free media and using the scanning nanopipette as a source of potassium ions, the location of ATP regulated potassium channels can be identified and their response observed using a second nanopipette, when the potassium containing probe is positioned above it.79
high precision could find great applications in the manufacturing of electronic components.
Using nanopipettes, it becomes possible to deliver, with high accuracy, to very specific regions of the target substrate. This use of nanopipettes as “nanopens” has been demonstrated for the IgG antibody on both a functionalised glass substrate95 as well as performing more targeted deposition where the antibody was deposited in nanoholes that were fabricated in a gold surface using a focussed ion beam.96 In these cases, the nanopipette could subsequently be used to deliver anti-IgG molecules to the same areas, which had been targeted previously, and the selective deposition could be confirmed through using confocal microscopy as the IgG and anti-IgG were tagged with different fluorophores.
Controlled delivery from nanopipettes allows for specifically targeting of individual cells with a particular stimuli or drug and can be used to study complex cellular processes such as inter cellular communication. This has been demonstrated for α-toxin, which is produced by a bacterium infection linked to the onset of cardiac arrests, where it was delivered specifically to one of a cluster of cardiac myocyte cells.97 This led to the formation of large non-selective ion channels in the cell membrane. Before being targeted with the toxin, the observed contractions of the targeted, and nearby, cells, were synchronised and regular with baseline calcium levels present in all of the cells. However, as a result of the toxin, the perturbed cell exhibited much higher levels of intracellular calcium, that it could not recover, and this caused increased cellular contraction rates, which were seen to spread to surrounding cells. The contractions in the cluster lost all synchronicity and eventually they stopped contracting. This type of study could help unravel information with regards to how signals propagate, and how perturbing one cell can influence the neighbouring cells.
can be targeted for extraction and this allows for correlation of the biopsy results with SICM topographical information. Very small volumes of cellular material can be extracted, minimising any damage to the cell and maintaining its viability.
Nanopipettes also can find great application as tools for electrospray analysis, where it has been shown that they function at much lower potentials than traditional electrospray methods, whilst exhibiting a high signal to noise.99 Furthermore, these principles have been exploited in a novel scanning electrospray microscopy technique, where a distance dependence of the electrospray probe to a substrate is observed, allowing for it to be used for tracking surface topography.61
Local manipulation of substrates is also possible using the nanopipette in an SICM configuration. It has been demonstrated that the technique can be used to puncture targeted regions of a membrane suspended above a pore array at will. In doing so the nanopipette can produce lithographic patterns on the membrane at desired, targeted locations.100 These membranes can subsequently be imaged using the SICM with feedback to validate the technique and to map the produced pattern.
SICM is not confined for the study of solid-aqueous interfaces and there have been studies of using SICM to track and probe liquid-liquid interfaces as well. SICM has been used to probe the interface between water and nitrobenzene allowing for new information about the interface, including a precise measurement of its thickness to be obtained.102 Information about the presented double layer at this interface was obtained through varying the electrolyte concentration and observing changes to the shape of the approach curves generated from moving the probe travelled through the solution.
1.3.6 Hybrid/SICM Based Techniques
SICM is capable of performing many important, fundamental and nanoscale tasks including being a powerful tool for generating high-resolution 3D topographical maps of living cells.33-34, 48-49, 59, 70, 103 However, as some of the studies outlined above have alluded to, when SICM is employed in combination with other techniques, in a multi-microscopy approach, the capabilities and versatility can be extended further. Such an approach could, for example, combine the ability of SICM for local delivering or topographical mapping together with fluorescence based confocal microscopy. The laser source of the confocal microscope can be focussed on the region below the nanopipette tip, causing any species that are fluorescently active at the applied wavelength, to emit a fluorescence signal. This signal can provide additional functional and specific chemical information about where the labelled probe species or nanoparticle diffuses to and where it resides. As an example, this approach has been used to monitor calcium concentrations around contracting myocytes and allowed for correlation with the structural information obtained from SICM.53
In the same way that nanopipettes can be used to deliver material to a substrate, they also provide a means of trapping molecules such as DNA and proteins in the electric field present at the end of the nanopipette, localising and concentrating the species. These effects can be observed for fluorescently tagged molecules, using confocal microscopy to observe their location.104
pit formations and closure.105-106 Clathrin can be tagged with Green Fluorescent Protein, which can be excited and detected using confocal microscopy, whilst other proteins involved in the process could also be tagged and identified.105 Endocytosis can also be studied through observing the interaction between fluorescently labelled nanoparticles, delivered from the nanopipette probe to targeted locations on the cell surface as demonstrated for lung epithelial cells in one study.107 To summarise, confocal microscopy provides a means of confirming what has been released from the probe and also to provide information with regards to the dynamics of release from the nanopipette and the behaviour of the fluorescent species whilst in the nanopipette.46, 91, 95, 108-109
Similarly, there has been some effort to combine SICM with scanning near field optical microscopy (SNOM) through the insertion of an optical fibre into the SICM probe. The SICM response can be used to provide accurate topographical information, whilst SNOM can provide optical images taken under the same conditions the SICM scan was obtained. Using this technique on rabbit cardio myocytes, SICM topographical data was combined with optical images and it was shown that it was possible to identify features such as sarcomeric striations.110
resolved electrochemical maps, which can be correlated with the topographical maps generated by the SICM channel.
Figure 1.6. Schematic of SICM-SECM with a dual barrelled pipette, one barrel for SICM topographical measurements whilst the other barrel is filled with carbon (for example) and used to monitor electrochemical processes.
The SECM electrode can be functionalised to provide sensitivity and specificity to a wide range of analytes whilst the SICM channel can independently position the probe. SICM-SECM has been employed for pH sensing,111-112 where the carbon or metal electrode is coated with iridium oxide or a polyalanine film for example, allowing potentiometric pH measurements to be undertaken. Functionalisation of a carbon electrode in the SICM-SECM setup with platinum also permits measurements of O2113-114 and H2O2115 by amperometry. SICM-SECM has facilitated the studies of the electrochemical properties of a wide range of different substrates ranging from dissolving crystals111 and single living cells114 to electrocatalytic nanoparticles28, 115 and electrode surfaces.27
has successfully mapped nanopores in a synthetic membrane in both a tapping mode and contact mode of feedback, providing maps of the pore structure, as well as making measurements of their ionic conductance.116 However, since the introduction of modulated feedback types in SICM and the introduction of hopping self-referencing scan regimes, which facilitate mapping of topographic and conductance measurements concurrently, the use of SICM-AFM has been limited, although there have been some applications for performing force and topography measurements simultaneously.69, 117
Figure 1.7. Representation of combined SICM-AFM with a bent nanopipette serving as both a cantilever for force measurements and an open channel containing an electrode for conductance measurements.
significant difference in conductance between the cell bodies and cell junctions of renal cells.119
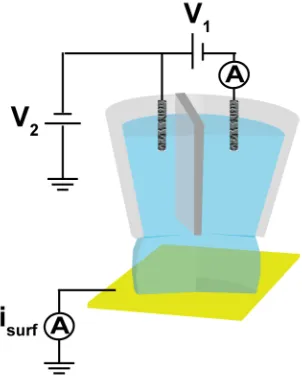
Figure 1.8. Schematic of the SECCM setup with a dual barrelled nanopipette filled with electrolyte solution. A bias is applied between the two QRCEs, one in each barrel to produce an ion conductance signal through the meniscus that can be used for feedback.
through variations in the faradaic current at the working electrode. SECCM has been used extensively in the study of carbon electrodes including: graphene,120, 124-125 carbon nanotubes126-127 and boron doped diamond128 as well as for studying other electrode materials129 and individual catalytic nanoparticles.130-132 As with SICM, SECCM can allow for controlled deposition and delivery of material to a substrate allowing for complex patterning and formation of microstructures on an electrode or other substrate.133-135
1.4 Prospects for SICM as a Tool for Surface Charge Mapping
Whilst there are great advantages and potential applications for multifunctional imaging platforms that combine SICM with optical, or other SPM, techniques, the SICM can provide further functional information in its own right. Much of this thesis is concerned with first showing the potential of SICM for sensing surface charge heterogeneities of extended substrates, through sensing variation in the surrounding DDL. These concepts are then developed further, allowing SICM to be a robust and quantitative tool for unambiguous mapping of both surface topography and surface charge for a range of systems, both inert and living. Surface charge plays an important role in a diverse range of complex interfacial systems and so being able to probe the surface charge in a non-invasive way could find a great range of applications spanning the study of crystals and minerals,136-140 colloidal science,141-143 nanoscale analytical devices144-146 and perhaps most significantly in living systems, where surface charge is known to play a key role in a range of living processes such as cellular growth and division,147-148 adherence,149-151 cellular uptake,152-157 and communication.158-160
1.4.1 Surface Charge and the Diffuse Double Layer
solution, a DDL forms as ions are either attracted to the oppositely charged surface (Figure 1.9a, b), or repelled if they are the same charge, resulting in a depleted concentration (Figure 1.9c). The DDL can freely move and its structure, length and composition strongly depend on the magnitude of the surface charge, the ionic composition and concentration of the bulk fluid.
Understanding the structure of the DDL is of great importance in a range of systems including colloidal systems and plays a role in the electrochemical behaviour of electrodes. Much work has gone into developing a model for the structure and characteristics of the DDL at electrodes and other interfaces. Helmholtz was the first to attempt to describe the solid-solution interface, approximating it as a dielectric that stores charge linearly with applied voltage so that it could be described by a fixed capacitance. Gouy and Chapman independently showed that the capacitance was not constant, scaling instead with voltage and ionic concentration and proposed an electric potential that decays exponentially from the charged surface. In their description the relationship between surface charge and the surface potential was:161
σ! =(8RTεε!c× 10!)!/!sinh(!!!!
!"#) (1.1)
where R is the molar gas constant, T the absolute temperature, ε the relative dielectric constant of water, ε0 the permittivity of free space, c the molar concentration and Z the ionic charge of the symmetrical electrolyte. With low potentials, this equation yields the Debye parameter:161
κ= !!!"!!×!!!"!
!
! !
(1.2)
The Gouy-Chapman model fails when the surface charge is too great and hence the surface potential is too high, resulting in unrealistic concentrations of ions present near the charged surface and so Stern proposed a new model that combined the Gouy-Chapman and Helmholtz models, proposing a fixed Helmholtz layer of ions adhered to the charged substrate with a surrounding Gouy-Chapman like diffuse layer.161-162
Further elaborations include those proposed by Grahame, who proposed the Helmholtz layer be split into two layers, one of ions adsorbed to the substrate with the other being a compact layer of fully solvated ions,161-162 the BMD model proposed by Bockris, Müller and Devanthan163 and a triple layer model, which expands the model of Sterne and Grahame, modified how adsorbed ions were viewed and included additional capacitances.161
Figure 1.9. FEM simulations of a negatively charged interface (-25 mC m-2) in KCl solution showing the K+ concentration profiles in (a) 0.1 mM and (b) 1000 mM as well as the (c) Cl- concentration in 0.1 mM. The concentrations of K+ and Cl -normalised to their bulk values are presented in d and e respectively with varying concentration.
1.4.2 Techniques for Mapping Surface Charge
studies. However, currently there do not exist many robust techniques that are capable of doing so.
One of the most promising techniques that has found limited success is using force microscopy to provide some information about surface charge.164-168 Surface charge mapping with force microscopy utilises a charged cantilever tip in order to probe the electrostatic interactions between the probe and the substrate. Whilst there have been studies that have used this technique to provide qualitative information about relative surface charges present on an extended substrate,165 this technique has several drawbacks that limit its applicability, particularly in the study of living systems, where some of the most exciting uses of this technique might be found. Firstly, the technique relies on a charged cantilever to generate an electrostatic interaction that can be used to probe the substrate charge. This charge itself is usually unknown and may change throughout a scan depending on interaction between the tip and surface, wear and fouling. In order to provide quantitative information about the substrate charge, there first needs to be a way of knowing the charge present on the probe. Secondly, AFM force curves are complex and understanding the relative contributions of all of the various interactions that act on the AFM tip is a difficult task169-170 and this means that quantifying the surface charge is unfeasible. Finally, under the magnitude of concentrations at which many living cells are maintained and viable, the range at which AFM is sensitive to surface charge is compressed to the order of one nm and this would make charge measurements without perturbing or damaging the sample particularly challenging.
there is a strong electrostatic attraction, the particle will have an equilibrium height closer to the film whereas a repulsive force will increase the equilibrium distance. This technique can therefore be used in two ways. Either using particles of known charge and using them to probe the surface charge of the film on the metal or if the charge of the film is known, the technique could be used to give information about the particle surface charge. The technique does have some limitations though. The spatial resolution of the technique is limited by the size of the charged particles but can give submicron measurements. Additionally, in order to get a good SPR signal, a high surface coverage of particles is needed. In terms of quantifying the response, knowledge of either the particle surface charge or substrate surface charge is needed, which could therefore rely on other techniques. Other techniques include zeta potential measurements,173-174 that are more focussed on colloidal systems in solution and also potentiometric titration methods175-177 but these lack spatial resolution and instead provide information about the average surface charge of a substrate/entity as a whole.
1.4.3 Ion Current Rectification in Nanopipettes and Nanopores
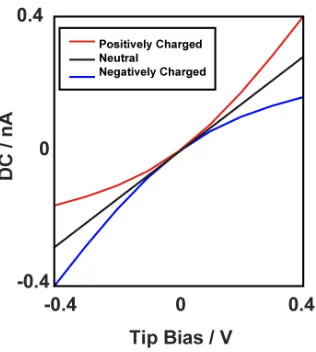
electrolyte present in the nanopipette and bulk solution, as well as the nanopipette size and shape, an enhanced current is observed at one bias polarity and a diminished current at the other, when compared with what would be expected if the nanopipette were uncharged.180-181, 184 This deviation from the linear current-voltage behaviour can be explained by considering the region at the charged interface as being perm-selective,184 where the ability for the ions present in the solution to pass through the selective region depends on their polarity. In nanopipettes, where the lumen size is comparable to the size of the extending DDL, the negative charge at the walls of the nanopipette create a region where the positively charged cations can pass but the anions are hindered. When a negative bias is applied in the nanopipette with respect to outside, a build-up of cations is observed, as the diffusion of cations to the nanopipette is greater than the movement up the nanopipette because of the geometry. This results in an enhanced conductance in the nanopipette and a greater ionic current. When the polarity of the bias is reversed, a depletion zone is formed because movement of cations away from the nanopipette is greater than they can be replaced from further up the nanopipette.5-6, 184 In the case of a positively charged nanopipette (possible where the nanopipette material is functionalised) these effects would reverse and the shape of a current-voltage curve would be reversed, as shown in Figure 1.10.
The level of ICR observed in nanopipette or nanopore systems is dependent on the shape and size of the nanopipette, for larger nanopipettes, the effects would be much less pronounced and a rectification ratio, the ratio between the currents at the equivalent magnitude but opposite polarity potentials, would be closer to unity. ICR is also more prominently seen when the concentration of the electrolyte in bulk solution and in the nanopipette decreases. At higher concentrations, the surface charge of the walls would be screened to a greater extent by the ions in solution, compressing the DDL, and resulting in a smaller influence of the charge. Electro-osmotic flow arising from the passage of current at charged interfaces can also contribute to this effect but several studies have shown that its effect is not as significant in the generally accepted perm-selective model for ICR.184
1.4.4 Surface Induced Rectification