Journal of Engineering and Applied Sciences 15 (6): 1311-1321, 2020 ISSN: 1816-949X
© Medwell Journals, 2020
An Improvement of Shunt Active Power Filter using Effective Controller for
Different Load Condition
Rosli Omar, Tan Zi Hao, Mohammed Rasheed and Marizan Sulaiman
Faculty of Electrical Engineering and Industrial Power, Universiti Teknikal Malaysia Melaka,
Hang Tuah Jaya, Durian Tunggal, 76100 Melaka, Malaysia
Abstract: The distorted waveforms due to highly uses of the non-linear load, especially, the current that is
considered the main issues need to be addressed seriously. The issues of the distorted waveforms for the current have attracted many researchers to recover them in the electrical system. There are so, many electronic devices that have been used in order to protect the waveform of the current from distorted as it is very dangerous and may cause the main supply to shut down or burnt. The main aims of this project is to design and develop a shunt active power filter for the purposes to mitigate the distorted of current waveform produced by the different types of non-linear loads using the controller of the SRF. The software MATLAB/Simulink will be used to design and develop shunt active power filter and its controller. Finally, the performance of the shunt active power filter and its controller at different types of non-linear loads will be evaluated through the waveforms of the currents produced by different types of non-linear loads and the Total Harmonic Distortion (THD) will be monitored and observed whether meets to the International Electrical Committee (IEC) standard or not.
Key words: Controller, harmonics, non-linear load, shunt active power filter, SRF theory, attracted
INTRODUCTION
In the modern era electricity is indispensable to everyone. Human use electronic devices in their daily life. Therefore, power quality is important as it will affect the electronic devices. However, the power quality is not perfect all the time. There are nine common power quality problems which include voltage sag, short interruptions, long interruptions, voltage spike, voltage swell, harmonic distortion, voltage fluctuation, noise and unbalance voltage. Each of these power quality problems will bring damage to the power system. For harmonic distortion, the consequences are shortening the life span of equipment. Harmonic distortion will cause excessive heat and leads to malfunction in electronic devices (Blooming and Carnovale, 2006; RFWW., 2012; Shah and Vaghela, 2014; Kmail, 2012; Afonso et al., 2001; Bhadra and Meena, 2015; Patel and Bhavsar, 2015; Srinath et al., 2010; Jarupula et al., 2015).
In order to prevent the damage lead by harmonic distortion, standards has been set both internationally and nationally. According to IEEE-519, harmonic voltage distortion on power system 69 kV and below is limited to 5.0% Total Harmonic Distortion (THD) with each individual harmonic limited to 3%. Another standard set by IEC declared that for 400 V power system, the total harmonic distortion is limited to 5%. For 6.6, 11 and
20 kV power system, the THD is limited to 4%. In Malaysia, TNB declared that the THD in 400 V power system is limited to 5, 4% for 11-22 kV power system and 3% for 33 and 132 kV power system.
To overcome the power quality problem, passive power filters were introduced. Passive power filter is used to minimize the harmonic distortion in power system. However, there were many disadvantages such as the size of passive power filter is large, it will cause resonance with the power system and its fixed compensation characteristics (Jacob et al., 2014; Jarupula et al., 2012; Kiran et al., 2011; Sakthivel et al., 2013; Rani et al., 2017). To improve the power quality, Active Power Filters (APF) was introduced to overcome the disadvantages of passive power filters. Active power filters can be classified into shunt active power filter and series active power filter (Dubey and Singh, 2014). The function of shunt active power filter and series power filter are different. Shunt active power filter is used to reduce the current harmonics in power system (Belaidi et al., 2012; Kumar et al., 2011).
Shunt active power filter: The function of shunt active
power filter is to reduce the current harmonic in power system. To reduce the current harmonic, the shunt active power filter produces a same amplitude but 180° opposite phase current. The current produced by shunt active
Distorted waveform
Fundamental
3rd harmonic AC voltage
source Is
I compensate
Nonlinear laod
[image:2.612.80.281.92.233.2]Shunt active power f ilter
Fig. 1: Basic scheme of shunt active power filter power filter will cancel out the current harmonic (Msigwa et al., 2009; Sreenubabu and Ranganaik, 2013; Routhu and Arun, 2013; Mazari and Mekri, 2005; Dugan et al., 2002) (Fig. 1).
Over the years, many control strategies were introduced to control shunt active power filter to generate current that responsible for reducing the current harmonic in power system. The performance of shunt active power filter varies with different control strategy (Boukadoum and Bahi, 2014; PFL., 2019; Bayindir et al., 2006).
Harmonics: Harmonics are undesired AC voltages and
currents in a power system that contain non-linear loads. The frequency of harmonics are integer multiples of the fundamental frequency of normal AC voltages and currents. The power conversion method employed to non-linear load caused the existence of harmonics. The basic calculation of harmonics in power system is depends on the fundamental frequency of the distribution system. For example, the 2nd harmonic in a 50 Hz system can be calculate by 50 times 2 which is 100 Hz. However, for a 60 Hz power system, the 2nd harmonic will be 120 Hz which is 60 times 2. In a three-phase power system, there is only odd-order harmonics (3rd, 5th, 7th, 9th) but no even-order harmonics is presented. Electronics equipment with non-linear load such as computer are consuming current in abrupt short pulses. The short pulses created will misshape the fundamental sinusoidal wave of the AC power system. The non-sinusoidal wave which is harmonic will flow back into the power system source and flow to other parts of the power system. Harmonic distortion is more common in a power system that connected to many electronic devices such as computer, fluorescent light and variable speed drives (WWG., 2019) (Fig. 2).
Total Harmonic Distortion (THD) is a measure of the effective value of the distorted sinusoidal waveform’s harmonic components. Normally, total harmonic distortion is used to relate with voltage
Fig. 2: Waveform of harmonics
harmonic distortion. However, total harmonic distortion is also used to calculate current harmonic distortion in a power system (Abdelaal et al., 2017). The following equation is used to measure and calculate THD in a power system:
(1) 2
h h 2
1 M THD
M
Where:
Mh : Individual harmonic component M1 : Fundamental component
M : Be either current or voltage
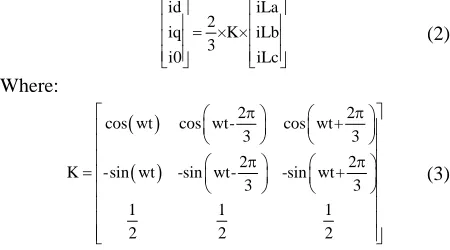
Synchronous reference frame thoery: Synchronous
reference frame theory also called d-q theory. This theory needs only simple calculation and only algebraic calculation is involved. Therefore, synchronous reference frame theory is applied extensively in shunt active power filter (Kumari and Awashthi, 2013). This theory is developed in time domain based reference current generation. The basic concept of synchronous reference frame is it transform load current to the d-q synchronous reference coordinate. Only d and q is considered in this theory. In SRF, a high pass filter is needed. ASRF based controller do not required voltage info. However, the SRF based filtering is not going to work when the load is imbalanced. The park transform method is used to transform the load current. The following equation shows park transform:
(2) id iLa
2 iq ×K× iLb
3 i0 iLc
Where:
(3)
2 2
cos wt cos wt- cos wt+
3 3
2 2
K -sin wt -sin wt- -sin wt+
3 3
1 1 1
2 2 2
[image:2.612.315.540.557.682.2]J. Eng. Applied Sci., 15 (6): 1311-1321, 2020
+
+
+ Va
4 Lsa
ILa1
Lsb ILb1
Vc Vb
4
Lsc ILc1
+ i
-+ i
-+ i
lload 1
Discrete 5e-05 s powergui
Aa
Bb
Cc +i
-+i
-+-i ILa
ILb
ILb2 Line V-I measurement
ILoad
R C A
B
C
+ +
Bridge clode harmonic source
+
-4
+
+
+ +
+
i-+ - i
Va Negative Vb Vc
ea_p eb_p ec_p
ea_p eb_p ec_p
1
3
3
-k-vcf
ilf A a
B b C c Continuous
+ + i-+ i
-A B C
+
-Pulses Uref d_6
g A B C
+
-1 2 AVS
+ + +
+ + +
+ + +
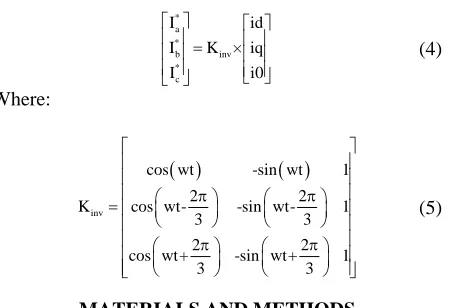
-(4) *
a * b inv * c
I id
I K × iq
I i0
Where:
(5)
inv
cos wt -sin wt 1
2 2
K cos wt- -sin wt- 1
3 3
2 2
cos wt+ -sin wt+ 1
3 3
MATERIALS AND METHODS
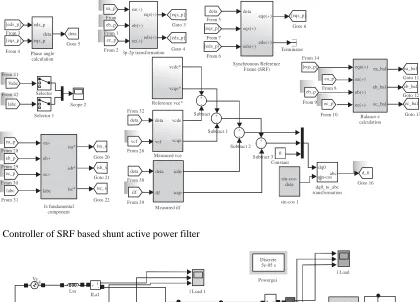
[image:3.612.76.301.93.247.2]The proposed system comprising three phase voltage supply, diode rectifier, 5th and 7th harmonic filter and SRF based shunt active power filter are shown in Fig 3-5. The parameters of the system are shown in Table 1-3.
[image:3.612.93.542.125.710.2]Figure 5 show the Simulink block used in the controller to transform Iabc to Idq. The transformation process is summarized as:
Table 1: Parameters of proposed system
Parameters Values
Vpeak 339.463 V
Frequency 50 Hz
Lfabc 1 mH
Cfabc 2.5 μF
PWM carrier frequency 20 kHz
R load 10 kΩ
C load 10 μF
Table 2: Parameters of 5th harmonic filter
Parameters Values
L 2.02 mH
C 200 μF
Table 3: Parameters of 7th harmonic filter
Parameters Values
L 2.07 mH
[image:3.612.103.483.492.702.2]C 100 μF
Fig. 3: Three phase voltage supply with diode rectifier
[eds_p] [eqs_p] eds_p eqs_p deta Goto 5 deta Phase angle calculation From 41 Vabc From 42 labc Selector Selector 1 Scope 2 ea_p eb_p ec_p labc From 28 From 29 From 30 From 31 ea+ eb+ ec+ labc isa_s isb_s isc_s From 32 deta vcf From 26 deta ilf From 38 From 39 ea_p eb_p ec_p From From 1 From 2 ea(+) eb(+) ec(+) eqs(+) eds(+) [eds_p] [eqs_p] 3p-2p transformation vcde* vcqe* deta vcf vcqe vcde deta ilf icde icqe deta [eds_p] [eqs_p] [eqs_p] Goto 6 Reference vce* Measured vce Measured ilf Subtract Subtract 1 Subtract 2 Subtract 3 Constant 0 + -+ -+ -+ -deta eqs(+) eds(+) eqe(+) ede(+) From 14 [eqs_p] ea_p ec_p From 9 eb_p From 10 From 8 ea(+) eb(+) ec(+) Balance e calculation eqe(+) ea_bal eb_bal ec_bal ea_bal eb_bal ec_bal Terminator Goto 13 sin-cos-deta sin-cos dq0 abc Goto 16 d_6 sin-cos 1 From 6 From 7 From 5 Goto 3 Goto 4 From 4 From 3 Is fundamental component Goto 20 Goto 21 Goto 22 Goto 12 Goto 11 Synchronous Reference Frame (SRF) dq0_to_abc transformation isa* isb* isc* + Va Vb Vc 4 4 4 Lsa ILa1
+ i
ILb1
+ - i
+ - i
Lsc +
+
l Load 1
Discrete 5e-05 s
5a 5b 5c 7a 7b 7c
5th harmonics f
7th harmonics f
A a
B b
C c
+ i
-+ i
-+ i
1Lb2 Powergui l Load A B C Bridge diode harmonic source C + + + + + + + + R ILc1 Lsb + ILb ILa Line V-I measurement ilter ilter sin_cos_deta sin_cos 1 ilf 2 abc_to_dq0 transformation abc n-cos dq0 1e-12 Constant deta 1 + + ic_s Selector 1 Math function 1/deta icds icqs icde icqe 1 2 icde icqe 1 Synchronous Reference Frame (SRF) 1
Fig. 5: Controller of SRF based shunt active power filter
Fig. 6: Three phase voltage system with diode rectifier and 5 and 7th harmonic filter
Fig. 7: Simulink block of Iabc to Idq transformation
Id 2/3 Ia * sin t+Ib*sin t-2 /3 +Ic*sin t+2 /3
Iq 2/3 Ia * cos t+Ib*cos t-2 /3 Ic*cos t+2 /3
10 1/3 Ia+Ib+Ic
J. Eng. Applied Sci., 15 (6): 1311-1321, 2020
1 eds_p
2 eqs-p
1e-12
Constant
+ +
×
-1 atan
deta Gain trigonometric
function 1
-vha*
vhb*
vhc* vha*
vhb* vva* vhc* vvb* vvc*
vcd*-vcq*
From 33 deta
Selector deta
vcd
vcq
References signal of vcq_vcd vva*
vvb*
vvc* 0
Constant Synchronous Reference
Frame (SRF) 2 vcde*
vcqe*
-+
-+ PI Discrete PI controller 1
Discrete PI controller 1
PI
vcde*
vcqe* 1
2
V unbalance compensation references Ih compensation reference
vcde*
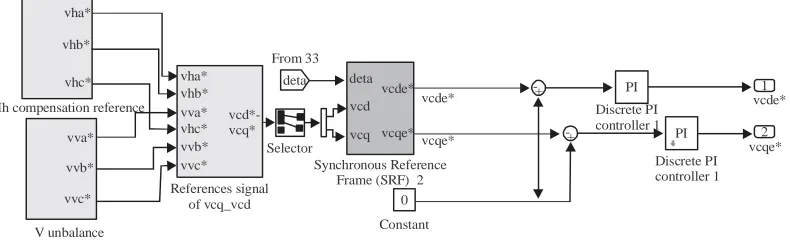
[image:5.612.118.506.92.207.2]vcqe* Fig. 8: Simulink block for phase angle calculation
Fig. 9: Simulink block of Vabc to Vdq transformation
Vd 2/3 Va*sin t+Vb*sin t-2 /3 +Vc*sin t+2 /3
Vq 2/3 Va*cos t+Vb*cos t-2 /3 +Vc*cos t+2 /3
V0 1/3 Va+Vb+Vc
RESULTS AND DISCUSSION
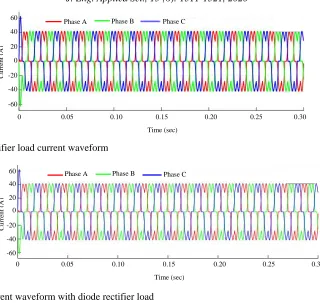
[image:5.612.109.515.99.370.2]The proposed system consists of three phase power supply is connected to a diode rectifier which is a type of non-linear load as presented in Fig. 3. The waveform of the current is measured at the both sides of the load and the source of the proposed system. The waveforms of the current at the load and source sides as shown in Fig. 10 and 11 and can be observed that the waveforms are distorted and their THD value for the current of source and load side are considerably high at around 24.9% as displayed in Fig. 12 and 13.
Filtering scheme is used to minimize the highly content of harmonic in the system. The three phases of the proposed system are installed with a passive filter in parallel which can be seen in Fig. 6. The passive filter is tuned at 5th and 7th harmonic order as exhibited in Table 2 and 3.
In the next simulation, the proposed system is connected parallel to both 5th and 7th harmonic filter at each phase of the system as displayed in Fig. 6.
The current waveform for load side and source side is obtained and shown in Fig. 14 and 15. It can be observed that the current waveform is greatly distorted in Fig. 14 because of the diode rectifier load and the THD value of the current waveform is 31.1% as displayed in Fig. 16. The waveform of the source current is clearly less distorted as observed in Fig. 15 and the THD value of the source current is 6.58% as presented in Fig. 17. It can be concluded that the 5th and 7th harmonic filter can lower the THD value in the system but unable to comply with the IEC standard which is 5%.
[image:5.612.119.514.249.370.2]25
20
15
10
5
0
Ma
g
(
F
un
da
m
en
ta
l %
)
0 5 10 15 20 25 30 35 40 Harmonic order
25
20
15
10
5
0
Ma
g
(
F
un
da
m
en
tal %
)
[image:6.612.149.469.80.383.2]0 5 10 15 20 25 30 35 40 Harmonic order
[image:6.612.147.459.81.238.2]Fig. 10: Diode rectifier load current waveform
[image:6.612.139.462.391.521.2]Fig.11: Source current waveform with diode rectifier load
Fig. 12: THD value of diode rectifier load current (Fundamental (50 Hz) = 39.58, THD = 24.92%)
Fig. 13: THD value of source current with diode rectifier load (Fundamental (50 Hz) = 39.58, THD = 24.92%)
0 0.05 0.10 0.15 0.20 0.25 0.30
Time (sec) 60
40
20
0
-20
-40
-60
Curre
nt
(A)
Phase C Phase A Phase B
0 0.05 0.10 0.15 0.20 0.25 0.30
Time (sec) 60
40
20
0
-20
-40
-60
Curre
nt
(A)
[image:6.612.141.465.555.703.2]J. Eng. Applied Sci., 15 (6): 1311-1321, 2020
20 18 16 14 12 10 8 6 4 2 0
Ma
g
(
F
un
da
m
ental %
)
0 5 10 15 20 25 30 35 40 Harmonic order
5.0 4.5 4.0 3.5 3.0 2.5 2.0 1.5 1.0 0.5 0
0 5 10 15 20 25 30 35 40 Harmonic order
Ma
g
(
F
u
n
d
a
m
en
ta
l %
[image:7.612.131.457.82.208.2])
[image:7.612.136.454.245.356.2]Fig. 14: Load current waveform of diode rectifier load with 5th and 7th harmonic filter
Fig. 15: Source current waveform of diode rectifier load with 5th and 7th harmonic filter
Fig. 16: THD value of load current for diode rectifier load with 5 and 7th harmonic filter (Fundamental (50 Hz) = 46.12, THD = 31.10%)
Fig. 17: THD value of source current for diode rectifier with 5th and 7th harmonic filter (Fundamental (50 Hz) = 46.12, THD = 31.10%)
100 80 60 40 20 0 -20 -40 -60 -80 -100
0 0.05 0.10 0.15 0.20 0.25 0.30
Time (sec)
Curre
nt
(A)
Phase C Phase A Phase B
80
60
40 20
0
-20 -40
-60 -80
0 0.05 0.10 0.15 0.20 0.25 0.30
Time (sec)
Curre
nt
(A)
[image:7.612.142.451.394.519.2] [image:7.612.151.476.557.690.2]30
25
20
15
10
5
0
Ma
g
(
F
un
d
am
en
ta
l %
)
0 5 10 15 20 25 30 35 40 Harmonic order
100 90 80 70 60 50 40 30 20 10
Mag
(
F
un
da
m
en
ta
l %
)
[image:8.612.136.448.98.205.2]0 5 10 15 20 25 30 35 40 Harmonic order
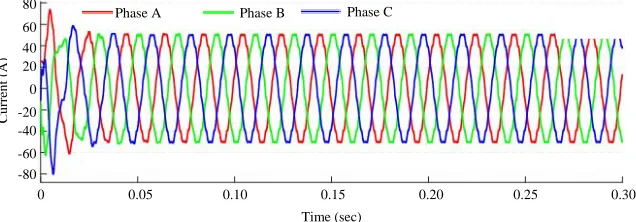
[image:8.612.139.462.239.357.2]Fig. 18: Load current waveform of diode rectifier load with SRF based SAPF
Fig. 19: Source current waveform of diode rectifier load with SRF based SAPF
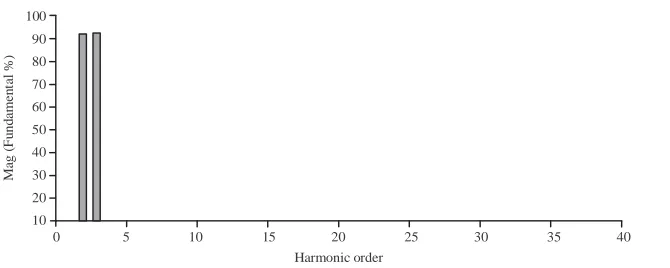
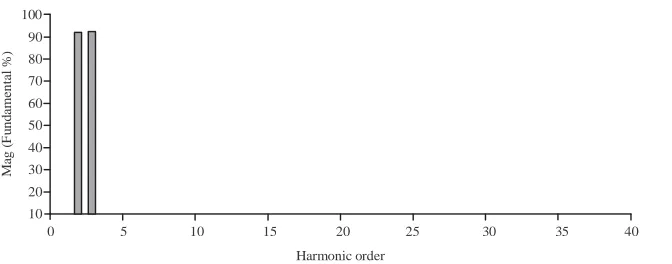
Fig. 20: THD value of load current for diode rectifier load with SRF based SAPF (Fundamental (50 Hz) = 11.08, THD = 33.39%)
Fig. 21: THD value of source current for diode rectifier with SRF based SAPF (Fundamental (50 Hz) = 201.4, THD = 0.49%)
0 0.05 0.10 0.15 0.20 0.25 0.30
Time (sec)
Curre
nt
(A)
Phase C Phase A Phase B
40 30
20
10
0
-10 -20
-30 -40
400
300
200
100
0
-100
-200
-300
0 0.05 0.1 0.15 0.20 0.25 0.30 Time (sec)
Phase C Phase A Phase B
Curre
nt
[image:8.612.153.466.391.520.2] [image:8.612.150.485.559.693.2]J. Eng. Applied Sci., 15 (6): 1311-1321, 2020
20 18 16 14 12 10 8 6 4 2 0
Mag
(
F
un
da
m
ental
%
)
0 5 10 15 20 25 30 35 40 Harmonic order
100 90 80 70 60 50 40 30 20 10
Ma
g
(
F
un
da
m
en
ta
l %
)
[image:9.612.143.458.99.207.2]0 5 10 15 20 25 30 35 40 Harmonic order
[image:9.612.135.449.243.357.2]Fig. 22: Load current waveform of diode rectifier load with SRF based SAPF
Fig. 23: Source current waveform of diode rectifier load with SRF based SAPF
Fig. 24: THD value of load current for diode rectifier load with SRF based SAPF (Fundamental (50 Hz) = 6.873e-05, THD = 257.73%)
Fig. 25: THD value of source current for diode rectifier with SRF based SAPF (Fundamental (50 Hz) = 284.3, THD = 0.13%)
0.0395 0.0396 0.0397 0.0398 0.0399 0.040 0.401 0.0402
Time (sec) 0.08
0.06
0.04
0.02
0
-0.02
-0.04
-0.06
Curre
nt
(A)
Phase C Phase A Phase B
0 0.05 0.10 0.15 0.20 0.25 0.30
Time (sec) Phase C Phase A Phase B
Curre
nt
(A)
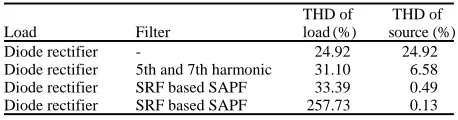
[image:9.612.146.467.393.520.2] [image:9.612.143.479.561.693.2]Table 4: THD value of load and source current with diode rectifier load and different filter
THD of THD of
Load Filter load (%) source (%)
Diode rectifier - 24.92 24.92
Diode rectifier 5th and 7th harmonic 31.10 6.58
Diode rectifier SRF based SAPF 33.39 0.49
Diode rectifier SRF based SAPF 257.73 0.13
value of the load current is 257.73% as displayed in Fig. 24. The source current waveform is close to perfect sine wave and the THD value of the source waveform is 0.13% as shown in Fig. 23 and 25. The THD value of the proposed system fulfil the IEC standard which the THD value in the system must not more than 5%. Therefore, we can conclude that the SRF based shunt active power filter can mitigate the harmonic in the power system (Table 4).
CONCLUSION
In conclusion, the SRF based shunt active power filter is able to reduce the harmonics distortion caused by non-linear load in a system. The proposed SRF based shunt active power filter successfully reduced the THD value in the system to as low as 0.13% which comply with IEC standard. The proposed SRF based shunt active power filter can protect the system from harmonics distortion.
ACKNOWLEDGEMENT
The researcher wishes to thank for the Company of Switchgear Mutiara and UTeM for supporting this research under collaboration the industrial matching grant funds which No. GLuar/SWITCHGEAR/2017/FKE CERIA/00019. The researchers would also like to thank Center for Robotics and Industrial Automation (CeRIA), Faculty of Electrical Engineering (FKE), Universiti Teknikal Malaysia Melaka (UTeM) and Ministry of Higher Education (MOHE) and government of Malaysia. The researchers would also like to thank Centre for Research and Innovation Management Universiti Teknikal Malaysia Melaka (CRIM-UTeM).
REFERENCES
Abdelaal, M.A.M., M.A. Sayed, E.E.M. Mohamed and M.M. Hamada, 2017. Comparison of shunt active power filter control strategies for harmonic compensation in a paper industrial factory. Am. J. Manage. Sci. Eng., 2: 41-51.
Afonso, J.L., M. Aredes, E. Watanabe and J.S. Martins, 2001. Shunt active filter for power quality improvement. Proceedings of the International Conference on UIE Electricity for a Sustainable Urban Development, November 1, 2001, Lisboa, Portugal, pp: 683-691.
Bayindir, K.C., M.U. Cuma and M. Tumay, 2006. Hierarchical neuro-fuzzy current control for a shunt active power filter. Neural Comput. Appl., 15: 223-238.
Belaidi, R., A. Haddouche and H. Guendouz, 2012. Fuzzy logic controller based three-phase shunt active power filter for compensating harmonics and reactive power under unbalanced mains voltages. Energy Procedia, 18: 560-570.
Bhadra, D. and R.K. Meena, 2015. Power quality improvement by harmonic reduction using three phase shunt active power filter with p-q & d-q current control strategy. B.Tech Thesis, National Institute of Technology, Rourkela, Rourkela, India. Blooming, T.M. and D.J. Carnovale, 2006. Application of
IEEE Std 519-1992 harmonic limits. Proceedings of the Conference Record of 2006 on Annual Pulp and Paper Industry Technical, June 18-23, 2006, IEEE, Appleton, Wisconsin, USA., pp: 1-9.
Boukadoum, A. and T. Bahi, 2014. Fuzzy logic controlled shunt active power filter for harmonic compensation and power quality improvement. J. Eng. Sci. Technol. Rev., 7: 143-149.
Dubey, S. and A. Singh, 2014. Implementation of matlab-simulink approach in shunt active power filters to minimize the harmonics. Int. J. Adv. Eng. Res. Stud., 2014: 28-35.
Dugan, R.C., S. Santoso, M.F. McGranaghan and H.W. Beaty, 2002. Electrical Power Systems Quality. 2nd Edn., McGraw-Hill Professional, Pennsylvania Plaza, ISBN-13: 978-0071386227, Pages: 528.
Jacob, A., B.T. Abraham, N. Prakash and R. Philip, 2014. A review of active power filters in power system applications. Int. J. Adv. Res. Electr. Electron. Instrum. Eng., 3: 10253-10261.
Jarupula, S., V.G.R. Mannam and N.R. Vutlapalli, 2015. Power quality improvement in distribution system using ANN based shunt active power filter. Int. J. Power Electron. Drive Syst., 5: 568-575.
Jarupula, S., V.G.R. Mannam and R. Matta, 2012. Power quality improvement in distribution systems using fuzzy based hybrid active power filter. Int. J. Adv. Sci. Res. Technol., 3: 637-648.
Kiran, C.N., S.S. Dash and S.P. Latha, 2011. A few aspects of power quality improvement using shunt active power filter. Int. J. Sci. Eng. Res., 2: 23-31. Kmail, M., 2012. Investigation of shunt active power
filter for power quality improvment. M.Sc. Thesis, Near East University, Nicosia.
Kumar, B.S., K.R. Reddy and V. Lalitha, 2011. Pi, fuzzy logic controlled shunt active power filter for three-phase four-wire systems with balanced, unbalanced and variable loads. J. Theoret. Applied Inf. Technol., 23: 1466-1470.
J. Eng. Applied Sci., 15 (6): 1311-1321, 2020
Mazari, B. and F. Mekri, 2005. Fuzzy hysteresis control and parameter optimization of a shunt active power filter. J. Inf. Sci. Eng., 21: 1139-1156.
Msigwa, C.J., B.J. Kundy and B.M. Mwinyiwiwa, 2009. Improving the shunt active power filter performance using synchronous reference frame PI based controller with anti-windup scheme. World Acad. Sci. Eng. Technol., 33: 413-418.
PFL., 2019. 29-761-5-Switch accessory, locking ring, 15/32 bushing mounted toggle switches. Premier Farnell Limited, Leeds, UK. https://www. newark.com/eaton/29-761-5/locking-ring/dp/27K3 506
Patel, K.V. and P.R. Bhavsar, 2015. Simulation & analysis of shunt active filter for power quality improvement. Int. J. Curr. Eng. Sci. Res. (IJCESR), 2: 84-90.
RFWW., 2012. Active filter vs passive filter-difference between active filter and passive filter. RF W ir e l e s s - W o r l d . C o m, B a n g a l o r e , Ind i a . https://www.rfwireless-world.com/Terminology/Ac tive-Filter-vs-Passive-Filter.html
Rani, R.S., C.S. Rao and M.V. Kumar, 2017. PSPWM based five-level shunt active filter for power quality improvement in power system network. Energy Procedia, 117: 794-801.
Routhu, B. and N. Arun, 2013. PI, FUZZY and ANFIS control of 3-phase shunt active power filter. Int. J. Eng. Technol. (IJET), 5: 2163-2171.
Sakthivel, A., P. Vijayakumar, L. Lakshminarasimman and D. Gnanaprakasam, 2013. Simulation and design of SRF based control algorithm for three phase shunt active power filter. Proceedings of International Conference on Advances in Control System and Electricals Engineering, September 2013, ACEEE, Washington, D.C., USA., pp: 39-42.
Shah, A. and N. Vaghela, 2014. Shunt active power filter for power quality improvement in distribution systems. Int. J. Eng. Dev. Res., 1: 22-26.
Sreenubabu, K. and M.B. Ranganaik, 2013. A novel fuzzy logic controller based shunt active power filter for power system harmonic mitigation. Int. J. Res. Advent Technol., 1: 100-114.
Srinath, S., S. Prabakaran, K. Mohan and M.P. Selvan, 2010. Implementation of single phase shunt active filter for low voltage distribution system. Proceedings of the 16th International Power Systems Conference (NPSC’10), December, 15-17, 2010, Hyderabad, India, pp: 295-300.