RESEARCH ARTICLE
Differences in motor cortical control of the soleus and tibialis anterior
Benedikt Lauber1,2,*, Albert Gollhofer1and Wolfgang Taube2ABSTRACT
The tibialis anterior (TA) and the soleus (SOL) are ankle joint muscles with functionally very different tasks. Thus, differences in motor cortical control between the TA and the SOL have been debated. This study compared the activity of the primary motor cortex during dynamic plantarflexions and dorsiflexions and compared this with measures obtained during rest. Single- and paired-pulse transcranial magnetic stimulations known as short-interval intracortical inhibition (SICI) were applied to the cortical representation of either the SOL or the TA muscle. The results show that the range of SICI from rest to activity is significantly greater in the TA than in the SOL. Furthermore, when the TA acts as the agonist during dorsiflexions of the ankle, SICI is almost absent (2.9%). When acting as the antagonist during plantarflexions, intracortical inhibition is significantly increased (28.7%). This task-specific modulation is far less pronounced in the SOL, which displayed higher levels of SICI when acting as the agonist (10.9%) during plantarflexion, but there was no significant inhibition (6.5%) as the antagonist during dorsiflexion. Furthermore, the cortical silent period (CSP) during plantarflexions was significantly longer in the SOL than in the TA during dorsiflexions, accompanied by a greater corticospinal excitability in the TA. Thus, cortical control considerably differs between the SOL and the TA in a way that inhibitory cortical control (SICI and CSP) of the TA is task-specifically adapted in a broader range of movements, whereas inhibition in the SOL muscle is less specific and more limited in its magnitude of modulation.
KEY WORDS: Dorsiflexion, Plantarflexion, Motor cortex, Transcranial magnetic stimulation, TMS, Inhibition
INTRODUCTION
From a functional perspective, both the soleus (SOL) and the tibialis anterior (TA) muscles are crucial for ankle joint motions, but they differ in their function: while the SOL has the potential to produce high forces (e.g. during walking), forces generated by the TA seem to be considerably lower (Lieber and Friden, 2000). During walking, the precision when lifting the foot over ground during the swing phase was previously assumed to require very fine motor (cortical) control of the TA (Petersen et al., 2003), whereas the control of the SOL muscle may rather be reactive and therefore less defined (Capaday et al., 1999). Thus, it seems likely that the specific functional roles of the two muscles require distinctive motor cortical control, but it is still unclear whether there are differences in motor cortical control between the dorsiflexor TA and the plantarflexor SOL. The first studies comparing the TA with the SOL by applying transcranial
magnetic stimulation (TMS) over the primary motor cortex (M1) proposed that there exist considerable differences in the responses following cortical stimulation. For example, it was shown that in the SOL, TMS resulted in less clear responses than when the TA was stimulated. It was argued that this is because the SOL motoneurons receive weaker or less meaningful corticomotoneuronal input (Brouwer and Qiao, 1995; Brouwer et al., 1992) even though it has been shown that the motoneurons of the plantarflexor (SOL) and the dorsiflexor (TA) receive monosynaptic (direct) corticospinal input (Matthews, 1991; Valls-Solé et al., 1994). Nielsen and Petersen (1995) reported poorly defined peaks in post-stimulation time histograms (PSTHs) in the SOL, while the TA motor units showed clear responses. Later evidence, however, did not support the notion that there is a lack of systematic corticomotoneuronal connections on SOL motoneurons compared with the TA. First, de Noordhout et al. (1999) showed a similar projection of corticomotoneuronal synapses onto the two pools by determining the rise time of monosynaptic excitatory postsynaptic potentials in the TA (1.13 ms) and SOL (1.14 ms). Subsequently, Bawa et al. (2002) applied TMS to the leg area of the left motor cortex and measured responses using surface electromyography (EMG) together with single motor unit recordings. While they demonstrated differences in the onset of the motor-evoked potentials (MEPs) during rest, they failed to identify significant differences during isometric contractions or when the TA tendon was vibrated. Thus, Bawa et al. (2002) concluded that there is no systematic difference in the presence of corticomotoneuronal connections even though they admit that the strength of these connections might be higher in the TA. However, apart from the corticomotoneural connections, the cortical representations of TA and SOL may also differ. For example, a study using functional magnetic resonance imaging (fMRI) showed that dorsiflexions of the ankle resulted in much higher levels of activity in motor cortical areas compared with plantarflexions (Trinastic et al., 2010). Furthermore, Papegaaij et al. (2016) demonstrated that during upright stance, short-interval intracortical inhibition (SICI) was smaller in the SOL (∼50% inhibition) than in the TA (∼70% inhibition). However, as the study of Papegaaij et al. (2016) specifically focused on the SOL but not the TA, it is difficult to make direct assumptions about differences between the two muscles with respect to cortical inhibitory control.
Accordingly, the aim of the present study was to systematically investigate differences in motor cortical control of the SOL and TA. For this purpose, TMS was applied to the cortical representations of the SOL and the TA during activity (plantarflexions, dorsiflexions) and at rest. A paired-pulse TMS protocol, where the first stimulus is subthreshold and the second one is suprathreshold, was chosen to assess SICI. There is strong evidence from studies in which descending corticospinal activity was recorded directly from the spinal cord that SICI is a cortical phenomenon (Di Lazzaro and Rothwell, 2014; Di Lazzaro et al., 1998; Ni et al., 2011; Weise et al., 2013). These studies showed a suppression of later I-waves (synaptically evoked corticospinal volleys) by the conditioning pulse when the primary motor cortex was stimulated by subthreshold intensities (Di Lazzaro et al., 1998; Nakamura et al., Received 20 November 2017; Accepted 20 August 2018
1Department of Sport and Sport Science, University of Freiburg, 79117 Freiburg,
Germany.2Department of Medicine Movement and Sport Science, University of
Fribourg, 1700 Fribourg, Switzerland.
*Author for correspondence (benedikt.lauber@unifr.ch)
B.L., 0000-0001-9684-3675
Journal
of
Experimental
1997), while there were no changes occurring for D-waves (direct corticospinal volleys). From a functional perspective, it is assumed that high levels of SICI prior to the start of a movement are important to supress corticospinal excitability and prevent unwanted or premature movements (Levin et al., 2014). In contrast, the release of SICI before and during the actual movement allows for a rapid facilitation of corticospinal excitability in the target muscle(s), probably leading to a more synchronous activation (Beck and Hallett, 2011). We tested SICI during dynamic contractions where low levels of inhibition are important in the agonist to provide high levels of cortical drive, while inhibition in the antagonist should be high to prevent counterproductive co-activation of muscles. Importantly, stimulation intensities were muscle- and task-specifically adjusted in the present study. Furthermore, TMS stimulation was triggered on the background EMG, guaranteeing comparable background EMG levels so that direct comparisons between muscles and conditions could be made. Brain stimulation was applied not only during activity but also at rest in order to assess a baseline level of inhibition. This made it possible to determine the range of inhibitory modulation from the resting condition (sitting) to the active condition in the same posture (plantarflexions and dorsiflexions). Furthermore, the range of inhibitory modulation was measured by comparing the amount of inhibition when the muscle acted as agonist and as antagonist. Furthermore, additional measures such as cortical silent period and corticospinal excitability were collected in order to evaluate a greater spectrum of differences in cortical control between the TA and the SOL. Based on the above-mentioned results obtained with double-pulse TMS (e.g. Papegaaij et al., 2016), it was hypothesized that the TA has a greater potential to modulate inhibition in a task-specific manner than the SOL.
MATERIALS AND METHODS Study participants
A total of 27 subjects (23.2±2.9 years, 14 male, 13 female) volunteered for this study. Statistical power was assured bya priori power analyses using G*power software (Faul et al., 2007). Before the actual experiment, subjects read the information sheet about the content of the study and then gave written informed consent. The study was approved by the ethics committee of the University of Freiburg (418/16) and was in accordance with the latest version of the Declaration of Helsinki.
EMG
After the skin had been shaved and cleaned with disinfectant, surface EMG was taken from the m. soleus (SOL) and the m. tibialis anterior (TA). Surface electrodes (Blue sensor P, AmbuH, Bad Nauheim, Germany) were attached to the muscles according to SENIAM guidelines with an interelectrode distance of 2 cm. The reference electrode was placed on the tibial plateau. The EMG recordings were amplified (×500), bandpass filtered (10–1000 Hz) and sampled at 4 kHz.
TMS
TMS was applied over the left hemisphere motor cortex using a 95 mm focal butterfly-shaped coil (D-B80) and a MagPro X100 with MagOption magnetic stimulator (both MagVenture A/S, Farum, Denmark). The coil was attached to a custom-made helmet (Petzl, Garmisch-Partenkirchen, Germany) that could be adjusted to different head sizes. The coil could be moved relative to the head via a pin-jointed system made of lightweight but rigid plastic. The helmet and the coil were additionally secured by straps to the chin and the back of the head (Taube et al., 2008). To
minimize the forces acting on the helmet via the cable of the coil, the cable was separately fixed via a pulley system attached to the ceiling above the subjects. For every subject, the initial stimulation point was set approximately 0.5 cm anterior to the vertex and over the midline. Then, the final position of the coil was established by moving the coil anterior and left from the vertex while constantly monitoring the size of the MEP ( posterior–anterior current flow in the motor cortex, with the handle pointing backwards).
Intracortical inhibition
For the present study, intracortical inhibition was tested using a paired-pulse TMS protocol in which the suprathreshold single TMS pulse at 1.2× motor threshold (1.2 MT) was preceded by the subthreshold (0.8 MT) TMS pulse by 2.5 ms (Kuhn et al., 2017; Papegaaij et al., 2016). While the first pulse acts as a conditioning pulse, being delivered at intensities below the threshold to induce a MEP (subthreshold TMS), the second pulse actually induces a clearly visible MEP (suprathreshold TMS). The first pulse activates intracortical inhibitory interneurons that then reduce the MEP amplitude of the second impulse, and this phenomenon is known as short-interval intracortical inhibition (SICI). The peak-to-peak amplitude of the conditioned MEP is then compared with that of the unconditioned MEP. In the present study, SICI was tested during rest as well as during activity. Because of the changes in the level of muscle activation from rest to activity, the stimulation intensity was adjusted for each condition and muscle (see below). This procedure ensured that there was no visible MEP following the subthreshold TMS during the rest (control) or during the active conditions. In contrast, the suprathreshold TMS resulted in a clear visible MEP in the SOL and in the TA.
Resting motor threshold (RMT)
The RMT was defined as the lowest possible stimulation intensity to evoke MEPs greater than 50 µV in three out of five consecutive trials obtained during rest (Rossini et al., 1994). The optimal position of the coil was marked on the subject’s head using a felt tip pen and monitored throughout the entire experiment. The RMT was individually established for the SOL and the TA.
Active motor threshold (AMT)
AMT was defined as the stimulation intensity to evoke MEPs greater than 100 µV in three out of five consecutive trials (Papegaaij et al., 2014) during dynamic plantarflexions (SOL) and dorsiflexions (TA). The AMT was individually established for the SOL and the TA while subjects performed plantarflexions or dorsiflexions. To establish the AMT, a value corresponding to 70% of the maximal force was represented on a computer screen in front of the subjects as a red target line that had to be matched by a black line representing the force exerted by the subjects. Subjects were instructed to contract as fast as possible (Maffiuletti et al., 2016) and match the target line as closely as possible. The TMS stimulation was triggered on the rising EMG corresponding to 50% of the maximal rectified EMG obtained during the submaximal contractions. This level for triggering the EMG has been successfully used previously to study the influence of SICI during cycling (Sidhu et al., 2013), and we therefore adopted this paradigm. This trigger level was kept constant throughout the entire experiment to ensure the same level of muscle activation at the time of stimulation.
SICI during plantarflexion and dorsiflexion
After establishing the AMT for the SOL and the TA, subjects performed 30 submaximal isometric ballistic contractions (see below)
Journal
of
Experimental
during which 15 paired-pulse stimulations (SICI) and 15 single-pulse MEPs were applied in a randomized order with the subthreshold TMS pulse at 0.8 AMT followed by the suprathreshold stimulus at 1.2 AMT. Importantly, stimulation intensity was individually adjusted for each muscle and condition (0.8 and 1.2 AMT) depending on whether the subjects performed plantarflexions (SOL) or dorsiflexions (TA). Although the primary aim was to elicit MEPs and SICI in the agonist (subscript ago), MEPs were simultaneously recorded in the antagonist (subscript ant). Thus, data from the SOLant and the TAant are also
reported, but they need to be interpreted with caution as TMS intensity was adjusted for the agonists, not the antagonists.
SICI in control conditions (rest)
To test the amount of intracortical inhibition during rest, 15 single-and 15 paired-pulse TMS stimulations around RMT were applied in the same posture as in the active condition (sitting) in the SOL as well as in the TA. We included the rest condition because it allowed us to measure the baseline level of inhibition so that it was possible to calculate the range of SICI modulation between rest and activity for each condition.
Plantarflexion and dorsiflexion
For the isometric plantarflexion and dorsiflexion, subjects were seated in a comfortable but rigid chair with the hip at 90 deg and the knee at 180 deg (fully extended). The foot was at an ankle angle of 100 deg and attached to the footplate of a custom-made device measuring ankle torque (Ritzmann et al., 2013). The foot was strapped to the footplate to exclude movements of the ankle. The hip and the trunk of the subjects were strapped to the backrest of the chair to avoid trunk movements. The seating area of the chair was large enough to provide some support for the thigh, while the shank was unsupported. For familiarization, subjects were allowed to perform a set of 5–7 submaximal contractions. Subsequently, subjects performed 5 contractions and were instructed to contract as fast and as hard as possible for approximately 1 s and were allowed to rest for 30 s between the contractions (Maffiuletti et al., 2016). The actual force and the target level were visually displayed on a computer screen placed 2 m in front of the subjects, and the subjects were instructed to initiate the contractions according to the beat of a metronome indicating the start of a new contraction every 20 s. In addition, subjects were instructed to contract as fast as possible. Data were sampled at 4 kHz.
Control experiment for the antagonistic muscles
In order to test whether the differences in SICI in the antagonists were biased, a control experiment was conducted in six subjects (27.3±4.2 years, all male). During this control experiment, subjects performed dynamic plantarflexions or dorsiflexions, while SICI was measured in the agonist as well as the antagonist. This time, however, the coil position and stimulation intensity were adjusted specifically to the task and muscle. This means that when the SOL acted as the antagonist, TMS was applied during the dynamic dorsiflexion, but the coil position and stimulation intensity were adjusted to evoke MEPs in the SOL but not in the TA. When the TA acted as the antagonist, TMS was applied during dynamic plantarflexions, and the coil position and stimulation intensity were muscle specifically adapted to the TA. When the SOL and TA acted as agonists, TMS measurements were carried out in the same way as in the main experiment (described in‘SICI during plantarflexion and dorsiflexion’, above), i.e. the coil position and stimulation intensity were adjusted to the respective agonist. RMT and AMT were established as described above.
Data analyses and statistics
Motor cortical inhibition
The size of the MEP was quantified by peak-to-peak analyses of the conditioned MEP ( paired-pulse stimulation) compared with the unconditioned MEP during the active ( plantarflexion, dorsiflexion) and the control conditions at rest (sitting). SICI was expressed as percentage inhibition of the conditioned in relation to the unconditioned MEP using the formula: 100−(conditioned MEP/ unconditioned MEP×100), which has been used previously (Kuhn et al., 2017; Papegaaij et al., 2014).
Corticospinal excitability
Corticospinal excitability (CSE) was quantified by the peak-to-peak amplitude of the MEP resulting from the unconditioned (single-pulse) TMS stimulation measured during the control and active conditions.
Cortical silent period
The cortical silent period (SP) was obtained in the trials with single-pulse stimulation. The duration of the SP was measured from the onset of the MEP, and the end point coincided with the reoccurrence of EMG activity in individual trials via visual inspection (Kimiskidis et al., 2005).
Background EMG activity (bEMG)
Muscle activation at the time of TMS stimulation was calculated in a time window of 50 ms prior to each stimulation. EMG signals were rectified, and root mean square values were calculated, averaged and normalized to the maximal EMG activity recorded during the maximal rate of torque development (RTD) trials.
Statistical comparison
Normal distribution of the data was confirmed using the Kolmogorov–Smirnov test. Then, a repeated-measures ANOVA with the factors muscle (SOL, TA) and condition (rest, active) was calculated when the SOL and the TA acted as agonists. A repeated-measures ANOVA with the factors condition ( plantarflexion, dorsiflexion, rest) and muscle (SO, TA) was calculated to detect differences in SICI when the muscles acted as agonists. When the SOL and the TA were antagonists, a one-way ANOVA was computed to highlight differences in SICI. Differences in the RMT, AMT, unconditioned MEP, SP and bEMG were calculated with individual one-way ANOVA. Differences between the RTD during dorsiflexions and plantarflexions were compared using a one-way ANOVA. In the case of significant effects, Bonferroni-corrected Student’s t-tests were performed. Pearson’s r was computed to assess the associations between the RTD and the SICI as well as between the unconditioned MEP amplitude and the SICI. For the control experiment, paired Student’s t-test was carried out to highlight differences in the muscles when acting as agonists or antagonists.
All data are reported as means±s.e.m., and SPSS 24 (Chicago, IL, USA) software was used for all statistical comparisons.
RESULTS RMT
For the control conditions (rest), one-way ANOVA showed significant differences in RMT (expressed as a percentage of the maximum stimulator output) between the muscles (F1,26=45.91,
η2=0. 03, P=0.41,P<0.001) with a lower RMT in the TA (57.2±
7.2%) than in the SOL (63.5±8.2%).
Journal
of
Experimental
AMT
For the AMT, there was also a significant difference (expressed as a percentage of the maximum stimulator output) between the SOL and the TA (F1,26=9.16,η2=0.25,P=0.41,P=0.005) as the AMT
during dorsiflexion (45.3%±7.2) was significantly lower than the AMT for the SOL during plantarflexion (58.2±7.0%).
Corticospinal excitability
During the active conditions, one-way ANOVA showed that CSE was significantly greater in the TA than in the SOL (F1,26=12.67,
η2=0.32,P=0.001; see below) despite similar levels of background
activation (see below). Corticospinal excitability was not significantly different between the SOL and the TA (F1,26=2.61,
η2=0.09,P=0.12) during control conditions (rest).
During the resting condition, one-way ANOVA showed no significant difference in the size of the unconditioned MEP between the TA (0.87±0.24 mV) and the SOL (1.44±0.92 mV,F1,26=2.61,
η2=0.09,P=0.12).
SICI in the SOL versus the TA
Repeated-measures ANOVA showed no interaction effect of muscle×condition (F1,26=0.99, η2=0.08, P=0.33). There was,
however, a significant difference in SICI between the muscles (F1,26=9.85, η2=0.28, P=0.004) and conditions (F1,26=68.58,
η2=7.25,P=0.004).Post hoccomparisons showed that, compared
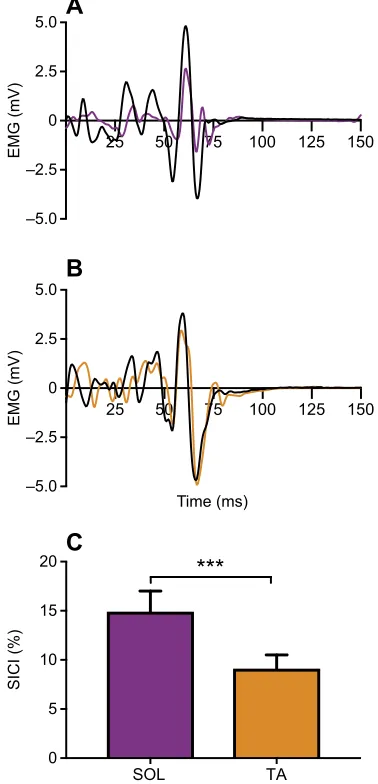
with SICI in the TA during dorsiflexion (9.1±1.4%), inhibition was significantly greater in the SOL during plantarflexion (14.9±2.1%, P=0.026; Fig. 1C). In contrast, during the control conditions (rest), SICI was significantly greater in the TA (55.2±4.8%) than in the SOL (44.4±4.8%,P=0.028; Fig. 2A).
SICI in the control condition at rest versus activity
Repeated-measures ANOVA showed a significant interaction between condition (rest versus active) and muscle (TA versus SOL;F3,104=15.98,η2=0.38,P<0.001). Post hoctesting showed
that SICI in the SOL was significantly greater during rest than with plantarflexion (P<0.001). For the TA, SICI was also higher during rest than with dorsiflexion (P<0.001, Fig. 1C). To compare the differences between rest and activity between the two muscles, we also calculated the percentage change in SICI from the control to the active condition and compared these changes between the SOL and the TA. This analysis revealed a significant difference between the two muscles (one-way ANOVA,F1,26=15.00,η2=0.36,P=0.001)
with greater modulation from rest to activity in the TA (59.98± 4.9%) compared with the SOL (33.23±5.2%; Fig. 2B).
Effect of MEP on SICI
To determine whether differences in the size of the unconditioned MEP affected the amount of SICI, correlation analyses of the SICI and MEP amplitudes were computed in the active and control conditions at rest (in accordance with Papegaaij et al., 2016). During the active condition, there was no significant correlation during plantarflexion (SOL,r=0.21,P=0.28) and dorsiflexion (TA, r=−0.15, P=0.46). During the control condition (rest), there was also no significant relationship in the level of SICI and the size of the MEPs in the SOL (r=−0.13,P=0.53) and the TA during sitting (r=−0.01,P=0.96).
SOL and TA acting as antagonists
Even though we aimed to measure the SOL and TA when they acted as agonistic muscles, it was also possible to record MEPs in the two muscles when they acted as antagonists. It should be noted,
however, that these results need to be interpreted with caution as the TMS intensity and the background EMG were adjusted for the agonistic muscles.
SICI measures in the SOL and TA acting as antagonists A significant difference between the SOL and the TA was observed when they acted as antagonists (one-way ANOVA, F1,26=15.21,
η2=0.36, P=0.01) as SICI was significantly greater in the TA ant
(28.7±4.6%) than in the SOLant(6.5±3.6,P=0.001; Fig. 3).
Control experiment
The results from the control experiment follow the same pattern as the results of the main experiment (see‘SICI measures in the SOL
25 50 75 100 125 150
–5.0 –2.5 0 2.5 5.0
EMG (mV)
25 50 75 100 125 150
–5.0 –2.5 0 2.5 5.0
EMG (mV)
A
B
SOL TA
0 5 10 15 20
SICI (%)
C
***
[image:4.612.343.532.62.454.2]Time (ms)
Fig. 1. Representative responses to transcranial magnetic stimulation (TMS) in one subject when the soleus (SOL) and tibialis anterior (TA) were acting as agonists.(A) TMS in the soleus (SOL) during plantarflexion of the ankle. (B) TMS in the tibialis anterior (TA) during dorsiflexion of the ankle. The waveforms in A and B display the motor-evoked potentials (MEPs) after the unconditioned control pulse (black line) and the conditioned pulse (coloured line). It can be seen that when both muscles act as agonists, the SOL shows a considerably greater amount of inhibition. (C) The group mean of short-interval intracortical inhibition (SICI) when the SOL and TA were acting as agonists, i.e. the amount of SICI in the SOL was assessed during plantarflexions, whereas SICI in the TA was measured during dorsiflexions. It can be seen that SICI was significantly lower in the TA (***P=0.001) than in the SOL.
Journal
of
Experimental
and TA acting as antagonists’, above). When the SOL acted as the antagonist, SICI was much lower (14.4±4.7%) than when the TA (38.7±6.1%) was acting as the antagonist (Fig. 4A). When the SOL acted as the agonist, SICI was higher (27.0±6.1%) than when the TA was the agonist (13.6±4.6%, Fig. 4B). Paired Student’s t-test shows that there was no significant difference in the SOL when it acted as the agonist or antagonist (P=0.17), while the difference in the TA was significant (P=0.005), supporting the notion of a greater range of how SICI can be modulated in the TA compared with the SOL.
CSP
In the active condition, there was a significant difference in the CSP (mean±s.d.; F1,26=5.00, η2=0.16, P=0.03), with a longer
CSP duration in the SOLago (91.7±2.8 ms) during plantarflexions
compared with that in the TAago(77.1±2.6 ms) during dorsiflexions
(Fig. 2C).
bEMG
The normalized bEMG in the period before TMS stimulation was significantly different between the conditions (one-way ANOVA plantarflexion versus dorsiflexion,F1,26=30.69,η2=0.60,P<0.001).
There was, however, no significant difference between the normalized EMG values of the SOL (10.3±1.5%) and the TA (11.5±2.0%) when they acted as agonists (P>0.90) or when they acted as antagonists (P>0.90, SOL 4.3±0.9, TA 3.4±0.6%).
A significantly greater activation was observed in the SOL when acting as the agonist versus antagonist (P=0.006), which was also the case for the TA (P=0.008, Fig. 2E).
RTD
The RTD during plantarflexions (670±38.91 N m s−1) was
significantly greater (one-way ANOVA, F1,26=203.69, η2=0.89,
P=0.41,P<0.001) compared with that during dorsiflexions (214± 15.87 N m s−1; Fig. 2F).
DISCUSSION
The aim of the present study was to systematically investigate differences in cortical control of the SOL and the TA muscles during dynamic plantarflexion and dorsiflexion. For this purpose, motor cortical inhibition and corticospinal excitability were tested both during active conditions and during control conditions (rest). This allowed us to investigate the muscle-specific range of modulation in cortical inhibition between rest and activity. Overall, the results demonstrate that the task-specific modulation of SICI is more pronounced for the TA. More specifically, in situations in which the TA acts as the agonist, intracortical inhibition is almost absent, while when the TA functions as the antagonist, SICI is drastically increased. In contrast, although the modulation of intracortical inhibition in the SOL follows the same pattern, the task-specific adaptations are less evident. Furthermore, the CSP was significantly longer and CSE was reduced in the SOL during plantarflexions compared with those in the
SOL TA
0 20 30 40 50 60 70
SICI (%)
***
SOL TA
0 60 70 80 90 100
CSP
duration (ms)
***
SOL TA
0 40 50 60 70 80 90 100
Dif
ference (%)
***
SOL TA
0 2.0 4.0 6.0 8.0
MEP
amplitude (mV)
***
A
B
C
D
SOLago TAago SOLant TAant
0 5 10 15 20
Normalized EMG (%)
***
E
Plantarflexion Dorsiflexion 0
200 400 600 800
R
T
D (N m s
–1
)
[image:5.612.49.400.57.434.2]***
F
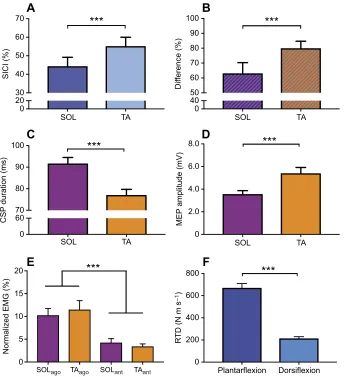
Fig. 2. Overview of the electrophysiological results.(A) Amount of intracortical inhibition during rest. SICI was significantly higher in the TA (***P=0.001) than in the SOL. (B) Differences in SICI between the rest and active condition. To estimate the range of how SICI can be modulated from the active to the resting condition, the percentage difference between these two conditions was calculated. The range in SICI modulation was significantly higher (***P=0.001) in the TA than in the SOL. (C) Cortical silent periods (CSPs) of the SOL and the TA. The duration of the CSP during the active condition was significantly (***P=0.001) longer in the SOL during
plantarflexions than in the TA during dorsiflexions. (D) Peak-to-peak MEP amplitude. The peak-to-peak amplitude of the control MEP (single-pulse stimulation) during plantarflexions (SOL) was significantly smaller than that of the MEP during dorsiflexions (TA). (E) Background
electromyography (bEMG). There was no difference between the bEMG of the SOL and TA when they were acting as agonists or as antagonists, but there was a significant difference between the agonist (subscript ago) and antagonist (subscript ant) bEMG, with higher levels of activation when being ago (***P=0.005). (F) Differences in the rate of torque development (RTD) between the SOL and the TA. The RTD measured during isometric contractions was significantly greater for plantarflexions than for dorsiflexions (***P=0.001).
Journal
of
Experimental
TA during dorsiflexions, providing new evidence for differences in the motor cortical control of the SOL and TA.
Difference in active conditions between the SOL and TA For ballistic types of movements such as those investigated in the present study, it was demonstrated that the cortical inhibition is released prior to the generation of the movement (Levin et al., 2014), most likely to allow synchronized high levels of cortical drive. In a study investigating the modulation of SICI in hand muscles, Beck et al. (2008) showed that when subjects pushed against a force transducer, SICI in the agonistic muscle was significantly decreased prior to movement onset and remained low during the phasic part of the finger movement. This seems to be a general pattern, as it was shown for hand as well as for leg muscles (Chen et al., 1998; Di Lazzaro et al., 2001; Kujirai et al., 1993; Stokic et al., 1997). However, these studies did not compare the
modulation of SICI in different muscles. The results of the present study are important, as they demonstrate that the modulation of SICI is changed depending on whether the subjects are required to rapidly activate their SOL or their TA (Fig. 1). For the SOL, we observed significant levels of SICI during plantarflexion, whereas SICI was absent in the TA during dorsiflexion. Thus, it seems that the cortical inhibitory control of the TA is better tuned to regulated inhibition depending on the role of the TA. This is further supported by observing how SICI was modulated when the SOL and TA acted as antagonists (Fig. 3). During plantarflexions, where TA functions as the antagonist, SICI in the TAantwas significantly greater than SICI
in the SOLantduring dorsiflexions. Importantly, the results from the
control experiment during which the coil position and the stimulation intensity were adjusted to the antagonistic muscles show the same pattern of SICI modulation. This supports the notion of a more refined inhibitory control of the TA compared with the SOL. Considering that it is beneficial to have low levels of SICI when the agonistic muscle is expected to produce rapid forces and to have high levels of inhibition to the antagonistic muscle to avoid a counterproductive co-contraction, the task-specific modulation in SICI of the TA was better tuned to the functional needs. Importantly, this seems to be the case in both directions, meaning that SICI was absent when the TA was required to produce rapid forces (dorsiflexion) functioning as the agonistic muscle, but SICI could also be very high and even above the levels of SICI in the SOL when activity in the TA was unwanted, as during plantarflexions. By comparing the activity of the SOL and the TA during walking with the activity during tonic contractions, Capaday et al. (1999) showed that MEPs in the SOL were lower during the stance phase than during tonic contractions despite matched background EMG levels. Interestingly, the TA displayed larger MEPs during stance than during the plantarflexion condition, even though the muscle was not very active. It was therefore concluded that during walking, the influence of the motor cortex on the SOL is weaker than for the TA, supporting the notion of a presumed greater cortical control of the dorsiflexors compared with the plantarflexors (Petersen et al., 2003). The present results of higher MEPs in the TA compared with the SOL are congruent with the findings of Petersen et al. (2003), indicating that compared with that of the SOL, cortical control of the TA might be higher not only during walking but also during dynamic voluntarily initiated plantarflexions and dorsiflexions. However, other factors such as the level of muscle activity and TMS intensity could have affected the results, as both have been shown to influence the size of the MEP and also the amount of SICI (Capaday, 1997; Devanne et al., 1997). To exclude this, we correlated the size of the unconditioned MEP with the size of the conditioned MEP during the control and the active conditions. As there was no significant correlation, it seems unlikely that differences in MEP size might have biased the SICI results.
Resting inhibitory activity versus inhibitory activity during dynamic movements
In order to quantify baseline values of inhibition for each muscle and to assess the relative range of inhibitory modulation from the resting condition to the active condition, we also measured SICI during rest. With respect to the TA, the results from our study differ greatly from values described by Soto et al. (2006), who did not exemplify differences in SICI between the rest and the active condition in this muscle. One reason might be that in contrast to the study of Soto et al. (2006), we established the RMT and AMT for each muscle (SOL and TA) and for each task (rest and active conditions) individually, while Soto and co-workers (2006) only
A
B
25 50 75 100 125 150
–3.0 –2.0 –1.0 0 1.0 2.0
EMG (mV)
25 50 75 100 125 150
–3.0 –2.0 –1.0 0 1.0 2.0
Time (ms)
EMG (mV)
SOLant TAant
0 10 20 30 40
SICI (%)
[image:6.612.83.267.58.456.2]***
C
Fig. 3. Representative responses to TMS stimulation in one subject when the SOL and TA were acting as antagonists.(A) TMS in the SOL during dorsiflexion of the ankle. (B) TMS in the TA during plantarflexion of the ankle. The waveforms in A and B display the MEPs after the unconditioned control pulse (black line) and the conditioned pulse (coloured line). (C) Group mean of SICI when the SOL and TA were acting as antagonists, i.e. the amount of SICI in the SOL was assessed during dorsiflexions, whereas SICI in the TA was measured during plantarflexions. It can be seen that SICI was significantly greater in the TA (***P=0.001) than in the SOL.
Journal
of
Experimental
concentrated on the SOL. Furthermore, measuring SICI during rest made it possible to calculate the entire range of modulation in SICI between the control and the active condition. The greatest range could be observed in the TA, with 59.98% difference in SICI, while in the SOL, modulation was only 33.23%. It therefore seems that for the TA, the motor cortex has the potential to regulate SICI from almost no inhibition when acting as the agonist (dorsiflexion) to very high levels of intracortical inhibition when it is acting as the antagonist (i.e. plantarflexion; Figs 2A and 4). In contrast, there always remains a certain level of intracortical inhibition in the SOL even when this muscle acts as the agonist. Thus, for the TA, the motor cortex can adjust its activation very precisely when acting as the agonist or antagonist, while for the SOL, the modulation of inhibition is much weaker (see also results from the control experiment in the antagonistic muscles, Fig. 4). This is further supported by the difference in the duration of the silent period between the two muscles. During plantarflexions, the CSP was significantly longer in the SOL than in the TA during dorsiflexions. It is commonly believed that SICI (for review, see Di Lazzaro and Rothwell, 2014) as well as the CSP (Di Lazzaro et al., 2002; Fuhr et al., 1991; Inghilleri et al., 1993) are cortical mechanisms but that they are mediated by different classes of GABAergic interneurons. While SICI is believed to involve GABAA receptor-mediated
activity, the CSP depends on the activity of GABABinterneurons
(Di Lazzaro et al., 2006; Teo et al., 2009; Ziemann, 2013). As SICI was greater and the CSP duration longer in the SOL than in the TA when both muscles acted as agonists, it seems that there exists a rather general difference in inhibitory control of the two muscles involving the activity of GABAAas well as GABABinterneurons. Thus,
task-specific modulation of inhibition seems to be less well adapted in the SOL than in the TA, as both SICI and SP are less reduced when the SOL acts as the agonist. Nevertheless, we cannot rule out spinal contributions to the CSP, as it was shown that spinal inhibitory networks can contribute to the CSP (Yacyshyn et al., 2016).
Limitations
In the present study, the unconditioned test MEP size differed significantly between the active and the resting conditions. While there is research showing that the size of SICI can be affected by the size of the unconditioned test MEP (Daskalakis et al., 2002; Sanger et al., 2001; Wagle-Shukla et al., 2009), there is also evidence that the stimulation intensity rather than the size of the unconditioned test MEP affects SICI (Garry and Thomson, 2009; Zoghi and Nordstrom, 2007). Therefore, it was decided that the best solution was to determine the active and resting thresholds for each condition and to adjust the stimulation intensity for each muscle and each condition individually, as we believe that this is the best compromise that can be achieved. Thus, we believe that the
comparison between the rest and the active condition is a valid claim, even though it cannot be ruled out that the differences in the size of the unconditioned test MEP affected the size of the SICI. Furthermore, the data reported for the antagonist muscles of the main experiment were not collected under ideal conditions, as the position of the coil was established for the agonist and not for the antagonist. In order to counteract this limitation, the control experiment was performed where the coil position and the TMS intensity were adjusted for each muscle (SOL, TA) and condition ( plantarflexion, dorsiflexion), and also for whether the two muscles were acting as agonists or antagonists. The results of the control experiment show the same pattern of how SICI was modulated in the SOL and TA when acting as the agonist or antagonist as reported in the main experiment (Fig. 4). Thus, all experiments point to the fact that the range of how SICI can be regulated in the TA is much greater and more task specific (i.e. low levels of SICI when functioning as the agonist versus high levels of SICI when being the antagonist) than in the SOL.
Finally, it is important to note that during plantarflexion as well as dorsiflexion, muscles other than the SOL and the TA very likely contributed to the generation of torque. For example, the triceps surae, the main actuator during plantarflexion, is composed of the monoarticular SOL and the biarticular heads of the medial gastrocnemius (MG) and lateral gastrocnemius (LG). Even though these muscles are classically referred to as synergists, their activation profile can differ substantially. For example, it was shown during ramp and hold contractions that the recruitment threshold for LG motor neurons was 20–35 times higher than that in the SOL, while the MG motor units displayed higher recruitment thresholds and a more variable firing behaviour than the SOL (Héroux et al., 2014). Even though these findings indicate differences in neural drive during isometric contractions, the role of the motor cortex remains elusive. Furthermore, whether a similar pattern holds true for ballistic types is unclear and should be the subject of future studies. It might be the case that, even though speculative, the cortical control of these muscles differs from that observed in the present study.
Acknowledgements
We would like to thank Janice Waldvogel, Simon Järger, Robert Seifried, Marc Dorer and Tim Sohnius for their help with data collection.
Competing interests
The authors declare no competing or financial interests.
Author contributions
Conceptualization: B.L., A.G., W.T.; Methodology: B.L., W.T.; Formal analysis: B.L.; Data curation: B.L.; Writing - original draft: B.L.; Writing - review & editing: B.L., A.G., W.T.; Supervision: A.G., W.T.
0 10 20 30
SICI (%)
SOLant TAant SOLago TAago
40 50
A
B
[image:7.612.48.418.56.191.2]0 10 20 30 40 50
Fig. 4. Results from the control experiment.
(A) Amount of SICI when the SOL and TA acted as antagonists, showing higher SICI values in the TA than in the SOL. (B) Levels of SICI in the SOL and TA when acting as agonists. There was a much higher level of SICI in the SOL than in the TA. Thus, the results of the control experiment resemble the ones from the main experiment. There was a significant difference in SICI in the TA between being agonist versus antagonist, which was not the case for the SOL.
Journal
of
Experimental
Funding
This research received no specific grant from any funding agency in the public, commercial, or not-for-profit sectors.
References
Bawa, P., Chalmers, G. R., Stewart, H. and Eisen, A. A.(2002). Responses of ankle extensor and flexor motoneurons to transcranial magnetic stimulation.
J. Neurophysiol.88, 124-132.
Beck, S. and Hallett, M.(2011). Surround inhibition in the motor system.Exp. Brain Res.210, 165-172.
Beck, S., Richardson, S. P., Shamim, E. A., Dang, N., Schubert, M. and Hallett, M. (2008). Short intracortical and surround inhibition are selectively reduced during movement initiation in focal hand dystonia.J. Neurosci.28, 10363-10369. Brouwer, B. and Qiao, J.(1995). Characteristics and variability of lower limb motoneuron responses to transcranial magnetic stimulation.Electroencephalogr. Clin. Neurophysiol.97, 49-54.
Brouwer, B., Bugaresti, J. and Ashby, P. (1992). Changes in corticospinal facilitation of lower limb spinal motor neurons after spinal cord lesions.J. Neurol. Neurosurg. Psychiatry55, 20-24.
Capaday, C.(1997). Neurophysiological methods for studies of the motor system in freely moving human subjects.J. Neurosci. Methods74, 201-218.
Capaday, C., Lavoie, B. A., Barbeau, H., Schneider, C. and Bonnard, M.(1999). Studies on the corticospinal control of human walking. I. Responses to focal transcranial magnetic stimulation of the motor cortex. J. Neurophysiol. 81, 129-139.
Chen, R., Tam, A., Bütefisch, C., Corwell, B., Ziemann, U., Rothwell, J. C. and Cohen, L. G. (1998). Intracortical inhibition and facilitation in different representations of the human motor cortex.J. Neurophysiol.80, 2870-2881. Daskalakis, Z. J., Christensen, B. K., Fitzgerald, P. B., Roshan, L. and Chen, R.
(2002). The mechanisms of interhemispheric inhibition in the human motor cortex.
J. Physiol.543, 317-326.
de Noordhout, A. M., Rapisarda, G., Bogacz, D., Gérard, P., De Pasqua, V., Pennisi, G. and Delwaide, P. J. (1999). Corticomotoneuronal synaptic connections in normal man: an electrophysiological study.Brain122, 1327-1340. Devanne, H., Lavoie, B. A. and Capaday, C.(1997). Input-output properties and gain changes in the human corticospinal pathway.Exp. Brain Res.114, 329-338. Di Lazzaro, V. and Rothwell, J. C. (2014). Corticospinal activity evoked and modulated by non-invasive stimulation of the intact human motor cortex.
J. Physiol.592, 4115-4128.
Di Lazzaro, V., Oliviero, D. R. A., Ferrara, P. P. L., Mazzone, A. I. P. and Rothwell, P. T. J. C.(1998). Magnetic transcranial stimulation at intensities below active motor threshold activates intracortical inhibitory circuits. Exp. Brain Res.119, 265-268.
Di Lazzaro, V., Oliviero, A., Profice, P., Meglio, M., Cioni, B., Tonali, P. and Rothwell, J. C.(2001). Descending spinal cord volleys evoked by transcranial magnetic and electrical stimulation of the motor cortex leg area in conscious humans.J. Physiol.537, 1047-1058.
Di Lazzaro, V., Oliviero, A., Pilato, F., Saturno, E., Insola, A., Mazzone, P., Tonali, P. A. and Rothwell, J. C. (2002). Descending volleys evoked by transcranial magnetic stimulation of the brain in conscious humans: effects of coil shape.Clin. Neurophysiol.113, 114-119.
Di Lazzaro, V., Pilato, F., Oliviero, A., Dileone, M., Saturno, E., Mazzone, P., Insola, A., Profice, P., Ranieri, F., Capone, F. et al.(2006). Origin of facilitation of motor-evoked potentials after paired magnetic stimulation: direct recording of epidural activity in conscious humans.J. Neurophysiol.96, 1765-1771. Faul, F., Erdfelder, E., Lang, A.-G. and Buchner, A.(2007). G*Power 3: a flexible
statistical power analysis program for the social, behavioral, and biomedical sciences.Behav. Res. Methods39, 175-191.
Fuhr, P., Agostino, R. and Hallett, M.(1991). Spinal motor neuron excitability during the silent period after cortical stimulation. Electroencephalogr. Clin. Neurophysiol.81, 257-262.
Garry, M. I. and Thomson, R. H. S.(2009). The effect of test TMS intensity on short-interval intracortical inhibition in different excitability states.Exp. Brain Res.193, 267-274.
Héroux, M. E., Dakin, C. J., Luu, B. L., Inglis, J. T. and Blouin, J.-S.(2014). Absence of lateral gastrocnemius activity and differential motor unit behavior in soleus and medial gastrocnemius during standing balance.J. Appl. Physiol.116, 140-148.
Inghilleri, M., Berardelli, A., Cruccu, G. and Manfredi, M.(1993). Silent period evoked by transcranial stimulation of the human cortex and cervicomedullary junction.J. Physiol.466, 521-534.
Kimiskidis, V. K., Papagiannopoulos, S., Sotirakoglou, K., Kazis, D. A., Kazis, A. and Mills, K. R.(2005). Silent period to transcranial magnetic stimulation: construction and properties of stimulus-response curves in healthy volunteers.
Exp. Brain Res.163, 21-31.
Kuhn, Y.-A., Keller, M., Ruffieux, J. and Taube, W.(2017). Adopting an external focus of attention alters intracortical inhibition within the primary motor cortex.Acta Physiol.220, 289-299.
Kujirai, T., Caramia, M. D., Rothwell, J. C., Day, B. L., Thompson, P. D., Ferbert, A., Wroe, S., Asselman, P. and Marsden, C. D.(1993). Corticocortical inhibition in human motor cortex.J. Physiol.471, 501-519.
Levin, O., Fujiyama, H., Boisgontier, M. P., Swinnen, S. P. and Summers, J. J. (2014). Aging and motor inhibition: a converging perspective provided by brain stimulation and imaging approaches.Neurosci. Biobehav. Rev.43, 100-117. Lieber, R. L. and Friden, J.(2000). Functional and clinical significance of skeletal
muscle architecture.Muscle Nerve23, 1647-1666.
Maffiuletti, N. A., Aagaard, P., Blazevich, A. J., Folland, J., Tillin, N. and Duchateau, J. (2016). Rate of force development: physiological and methodological considerations.Eur. J. Appl. Physiol.116, 1091-1116. Matthews, P. B. C.(1991). The human stretch reflex and the motor cortex.Trends
Neurosci.14, 87-91.
Nakamura, H., Kitagawa, H., Kawaguchi, Y. and Tsuji, H.(1997). Intracortical facilitation and inhibition after transcranial magnetic stimulation in conscious humans.J. Physiol.498, 817-823.
Ni, Z., Gunraj, C., Wagle-Shukla, A., Udupa, K., Mazzella, F., Lozano, A. M. and Chen, R.(2011). Direct demonstration of inhibitory interactions between long interval intracortical inhibition and short interval intracortical inhibition.J. Physiol.
589, 2955-2962.
Nielsen, J. and Petersen, N.(1995). Evidence favouring different descending pathways to soleus motoneurones activated by magnetic brain stimulation in man.
J. Physiol.486, 779-788.
Papegaaij, S., Taube, W., Hogenhout, M., Baudry, S. and Hortobagyi, T.(2014). Age-related decrease in motor cortical inhibition during standing under different sensory conditions.Front. Aging Neurosci.6, 126.
Papegaaij, S., Baudry, S., Négyesi, J., Taube, W. and Hortobágyi, T.(2016). Intracortical inhibition in the soleus muscle is reduced during the control of upright standing in both young and old adults.Eur. J. Appl. Physiol.116, 959-967. Petersen, N. T., Pyndt, H. S. and Nielsen, J. B.(2003). Investigating human motor
control by transcranial magnetic stimulation.Exp. Brain Res.152, 1-16. Ritzmann, R., Kramer, A., Gollhofer, A. and Taube, W.(2013). The effect of whole
body vibration on the H-reflex, the stretch reflex, and the short-latency response during hopping.Scand. J. Med. Sci. Sports23, 331-339.
Rossini, P. M., Barker, A. T., Berardelli, A., Caramia, M. D., Caruso, G., Cracco, R. Q., Dimitrijevic, M. R., Hallett, M., Katayama, Y., Lucking, C. H. et al.(1994). Non-invasive electrical and magnetic stimulation of the brain, spinal cord and roots: basic principles and procedures for routine clinical application. Report of an IFCN committee.Electroencephalogr. Clin. Neurophysiol.91, 79-92.
Sanger, T. D., Garg, R. R. and Chen, R.(2001). Interactions between two different inhibitory systems in the human motor cortex.J. Physiol.530, 307-317. Sidhu, S. K., Cresswell, A. G. and Carroll, T. J.(2013). Short-interval intracortical
inhibition in knee extensors during locomotor cycling.Acta Physiol.207, 194-201. Soto, O., Valls-Solé, J., Shanahan, P. and Rothwell, J.(2006). Reduction of intracortical inhibition in soleus muscle during postural activity.J. Neurophysiol.
96, 1711-1717.
Stokic, D. S., McKay, W. B., Scott, L., Sherwood, A. M. and Dimitrijevic, M. R. (1997). Intracortical inhibition of lower limb motor-evoked potentials after paired transcranial magnetic stimulation.Exp. Brain Res.117, 437-443.
Taube, W., Leukel, C., Schubert, M., Gruber, M., Rantalainen, T. and Gollhofer, A.(2008). Differential modulation of spinal and corticospinal excitability during drop jumps.J. Neurophysiol.99, 1243-1252.
Teo, J. T. H., Terranova, C., Swayne, O., Greenwood, R. J. and Rothwell, J. C. (2009). Differing effects of intracortical circuits on plasticity.Exp. Brain Res.193, 555-563.
Trinastic, J. P., Kautz, S. A., McGregor, K., Gregory, C., Bowden, M., Benjamin, M. B., Kurtzman, M., Chang, Y. L., Conway, T. and Crosson, B.(2010). An fMRI study of the differences in brain activity during active ankle dorsiflexion and plantarflexion.Brain Imaging Behav.4, 121-131.
Valls-Solé, J., Alvarez, R. and Tolosa, E. S.(1994). Responses of the soleus muscle to transcranial magnetic stimulation. Electroencephalogr. Clin. Neurophysiol.93, 421-427.
Wagle-Shukla, A., Ni, Z., Gunraj, C. A., Bahl, N. and Chen, R.(2009). Effects of short interval intracortical inhibition and intracortical facilitation on short interval intracortical facilitation in human primary motor cortex.J. Physiol.587, 5665-5678. Weise, D., Mann, J., Ridding, M., Eskandar, K., Huss, M., Rumpf, J.-J., Di Lazzaro, V., Mazzone, P., Ranieri, F. and Classen, J.(2013). Microcircuit mechanisms involved in paired associative stimulation-induced depression of corticospinal excitability.J. Physiol.591, 4903-4920.
Yacyshyn, A. F., Woo, E. J., Price, M. C. and McNeil, C. J.(2016). Motoneuron responsiveness to corticospinal tract stimulation during the silent period induced by transcranial magnetic stimulation.Exp. Brain Res.234, 3457-3463. Ziemann, U.(2013). Pharmaco-transcranial magnetic stimulation studies of motor
excitability.Handbook Clin. Neurol.116, 387-397.
Zoghi, M. and Nordstrom, M. A.(2007). Progressive suppression of intracortical inhibition during graded isometric contraction of a hand muscle is not influenced by hand preference.Exp. Brain Res.177, 266-274.