University of Warwick institutional repository:
http://go.warwick.ac.uk/wrap
A Thesis Submitted for the Degree of PhD at the University of Warwick
http://go.warwick.ac.uk/wrap/70988
This thesis is made available online and is protected by original copyright.
Please scroll down to view the document itself.
Modelling, Implementation and Validation of
Polymeric Planar Spring Mechanisms
by
Haroon-Ur-Rashid
MPhil., M.Sc., M.Sc.
Submitted to the University of Warwick
in partial fulfilment of the requirements
for the degree of
Doctor of Philosophy
School of Engineering
c
Copyright by Haroon-Ur-Rashid, November 2014.
Abstract
This thesis explores, by means of modelling and physical experiments, variant designs for triskelion
devices, a type of planar flexure mechanism widely considered for use in micro-probe suspensions
and, more recently, force transfer artefacts. The accurate measurement of low force is challenging
problem that has wide range of force related applications. A lot of attention has been paid worldwide
during last decade within and beyond the National Metrology Institutes (NMIs) to measuring low
forces. A major concern is how to provide traceability for micro- to nanonewton level forces that
is highly reliable and could be used for real machine calibration. The current consensus is that
this process requires special secondary standards and novel artefacts to transfer such standards to
working systems. The latter provides the motivation for this thesis, which makes the following main
contributions.
A published linear elastic model has been considerably enhanced and generalised to enable the
study of a wide range of variants from the one widely-used design of triskelion device. Triskelion
and tetraskelion software programs implement this new model, providing a new tool for
comput-ing forces, moments, stress, strain, axial stiffness and torsional stiffness for devices before their
fabrication. It has been used to explore widely the sensitivity of the devices to changes in design
parameters such as suspension leg geometry and ’elbow’ angles.
To provide essential physical verification of the practicality of a linear model, a low-cost
technique has been developed for making small triskelion test samples. This was used with a new
test-rig configuration to measure polymeric triskelion devices under loads in the 1 mN to 1N region
with deflections up to around 1 mm. Experiments have determined the onset and characteristics
of non-linear spring behaviour in typical devices and have verified the general predictions from the
new model.
The overall conclusion to be drawn is that at large deflection the spring characteristics follow a
cubic law (stiffening). However, during the initial stages of the deflection the linear term dominates
over a range that is quite sufficiently wide for practical use as force test artefacts. The polymeric
test devices performed well, behaving reasonably closely to predicted values in the linear (model)
Acknowledgements
I would like to take this opportunity to thank to my supervisor Professor Derek Chetwynd for his support and encouragement during my period of research. The suggestions and com-mitment to this challenging research work have been highly valuable in perfecting the thesis.
I am very grateful for discussions I had especially related to nano-force secondary standards with Professor Richard Leach and Dr Christopher Jones of National Physical Laboratory (NPL).
I would also like express my gratitude to Dr Xiaping Liu and Dr Ken Mao for their encouragements and discussions.
A special thanks to Dave Robinson for fabricating the samples of triskelion and tetraskelion force artefacts and his help with the progress of my experimental work. I am also grateful to Graham Canham for taking the pictures of these samples.
This work was funded by the Engineering and Physical Sciences Research Council
(EPSRC) CASE Studentship Program (Ref: 08002602) in conjunction with NPL.
Declaration
Statement of Originality
I declare that this thesis is presented in accordance with the regulations for the degree of Doctor of Philosophy. It has been written and composed by myself. The work presented in this thesis is my own research work, except where noted. Information derived from the published or unpublished work of others has been acknowledged in the text and a list of references is given.
No part of the research work presented in this thesis has previously been published by the author. This thesis has not been submitted for a degree at any other university.
Haroon-Ur-Rashid PhD Candidate
List of Abbreviations
AFM atomic microscope
AM additive manufacturing
BIMP Bureau International des Poids et Mesures
C-MAR cantilever microfabricated array of reference springs
CMS-ITR centre for measurement standards-industrial technology research insti-tute
CMM coordinate measuring machine
CNC computer numerical code
CS centre symmetric
CGPM General Conference on Weights and Measures
CIMP Committee for Weights and Measures
DAFM dynamic atomic microscopy
DoF degree of freedom
DS diagonal symmetric
ECB electromagnetic compensated balance
FSM force standard machine
IPK International Prototype of Kilogram
KRISS Korean Research Institute of standard and science
LFB low force balance
MEMS microelectromechanical systems
MSL microstereolithography
NMIs National Metrology Institutes
NIST National Institute of Standards and Technology
NPL National Physical Laboratory
NFC nano-force calibrator
PTB Technische Bundesanstalt
RP rapid prototyping
SL stereolithography
TSFA triskelion force artefact
Symbols used in numerical experiments
b beam length [m]
w beam width [m]
t beam thickness [m]
a` arm length [m]
hr arm radius [m]
αi angle between the arm and x-axis of triskelion suspension ( i = 1, 2, 3) and tetraskelion ( i = 1, 2, 3, 4) force artefacts in the local frame of reference [radian]
βi outer angle between the x-axis and beam of triskelion ( i = 1, 2, 3) and tetraskelion ( i = 1, 2, 3, 4) suspension in the global frame of reference [radian]
θx rotation about x-axis of hub of the triskelion and tetraskelion force artefacts [radian]
θy rotation about y-axis of hub of the triskelion and tetraskelion force artefacts
Fz force along z-axis [N/m]
Mx moment along x-axis [Nm]
My moment along y-axis [Nm]
kz axial stiffness along z-axis [m]
λx torsional stiffness along x-axis [Nm/rad]
Terminology used in chapters 4 to 9
TSFA-60 triskelion force artefact with elbow 60◦
TSFA-90 triskelion force artefact with elbow 90◦
TSFA-120 triskelion force artefact with elbow 120◦
TSFA-180 triskelion force artefact with elbow 180◦
TTSFA-CS-90 tetraskelion force artefact, centre symmetric with elbow 90◦
TTSFA-DS-90 tetraskelion force artefact, diagonal symmetric with elbow 90◦
TTSFA-CS-135 tetraskelion force artefact, centre symmetric with elbow 135◦
TTSFA-DS-135 tetraskelion force artefact, diagonal symmetric with elbow 135◦
TTSFA-CS-180 tetraskelion force artefact, centre symmetric with elbow 180◦
TTSFA-DS-180 tetraskelion force artefact, diagonal symmetric with elbow 180◦
CS1-60 classic triskelion sample with elbow angle with elbow 60◦
CS2-60 classic triskelion sample with elbow angle with elbow 60◦
CS1-90 classic triskelion sample with elbow angle with elbow 90◦
CS2-90 classic triskelion sample with elbow angle with elbow 90◦
CS1-120 classic triskelion sample with elbow angle with elbow 120◦
CS2-120 classic triskelion sample with elbow angle with elbow 120◦
ABS1-60 angle-beam sample with elbow angle with elbow 60◦
ABS2-90 angle-beam sample with elbow angle with elbow 90◦
ABS1-120 angle-beam sample with elbow angle with elbow 120◦
ABS1-120 angle-beam sample with elbow angle with elbow 120◦
CS1-CS-90 classic tetraskelion sample, centre symmetric with elbow angle 90◦
CS2-CS-90 classic tetraskelion sample, centre symmetric with elbow angle 90◦
CS1-DS-90 classic tetraskelion sample, diagonal symmetric with elbow angle 90◦
CS2-DS-90 classic tetraskelion sample, diagonal symmetric with elbow angle 90◦
ABS1-CS-90 angle-beam tetraskelion sample, centre symmetric with elbow angle 90◦
Dedication
This thesis is dedicated to my father Raja Muhammad Azam Khan Kayani (Late), mother Surya Begum, Uncle Raja Amir Alam Kayani, aunt Taj Begum, and my son
Contents
Abstract . . . iii
Acknowledgements . . . iv
List of Tables . . . xix
List of Figures . . . xxiii
1 Introduction 1 1.1 Background: General need in force metrology . . . 1
1.2 Scope of the thesis . . . 3
1.3 Aims and objectives of the research work . . . 4
1.4 Layout of the thesis . . . 5
2 Needs and capabilities in low-force metrology 8 2.1 Introduction . . . 8
2.2 Scope of low force measurement . . . 9
2.2.1 Traceability and fundamental force concepts in metrology . . . 10
2.2.2 Low force traceability in metrology . . . 12
2.3 Standards and capabilities for small force metrology . . . 13
2.3.1 Low force measurement at NPL . . . 14
2.3.2 Electrical Nanobalnce . . . 16
2.3.3 Low force measurement at NIST . . . 16
2.3.4 The low force measurement at PTB . . . 20
2.3.5 The low force measurement at KRISS . . . 27
2.3.6 The low force measurement at CMS-ITRI . . . 30
2.4 Current challenges for the base units of SI . . . 32
2.4.2 Proposed changes to base unit of SI system . . . 34
2.4.3 Redefinition of base units of SI system . . . 34
2.4.4 Proposed new definition of base units of SI system . . . 34
2.4.5 Low force artefacts . . . 37
2.4.6 3D micro probe system . . . 41
2.5 Force sensing methods . . . 44
2.5.1 Dead wight forces production . . . 44
2.5.2 Resonance method: nanoguitar . . . 45
2.5.3 Resonance method: tuning fork . . . 47
2.5.4 Casimir forces . . . 47
2.5.5 Radiation pressure and momentum . . . 49
2.5.6 Van der Waals forces . . . 51
2.5.7 Step forces in protein unfolding . . . 51
2.5.8 Elastic element methods . . . 54
2.5.9 Passive type array of cantilevers . . . 57
2.5.10 Active type single cantilever . . . 57
2.5.11 Fluid flow, surface tension and capillary forces . . . 59
2.6 Conclusion . . . 59
3 Linear elastic modelling for triskelion force artefacts 61 3.1 Introduction . . . 61
3.2 Basic elasticity and simple beam theory . . . 62
3.3 Implications for ligament design . . . 64
3.4 Pseudo-kinematic analysis of triskelion flexure . . . 67
3.5 Linear elastic model for triskelion force artefacts . . . 70
3.5.1 Motivation: The need for new models . . . 70
3.5.2 Critique for triskelion suspensions . . . 71
3.6 Enhanced Linear elastic model for variant triskelion suspensions designs . . 73
3.6.1 Hub motion and displacement at the arm . . . 74
3.6.2 Transformations to beam co-ordinates . . . 77
3.7 Pseudo-kinematic consideration of the suspension beams . . . 80
3.8 Analytical model for triskelion angled-beam suspension . . . 83
3.9 Implications and limitations of the linear model . . . 89
3.9.1 General needs for small force transfer artefacts . . . 89
3.10 Kinematics and parasitic motion . . . 93
3.11 Spring non-linearity in force artefacts . . . 95
3.12 Conclusion . . . 98
4 Implementation of enhanced linear elastic model:Numerical experiments and data analysis 100 4.1 Introduction . . . 100
4.2 Implementation of enhanced linear elastic model . . . 101
4.3 Design variables of the triskelion software program . . . 101
4.3.1 Platform parameters . . . 101
4.3.2 Elbow angleβi . . . 102
4.3.3 Beam parameters . . . 102
4.3.4 Material constant parameters . . . 103
4.4 Triskelion software program . . . 103
4.4.1 Triskelion software program verification . . . 105
4.5 Stiffness of triskelion force artefacts . . . 107
4.5.1 Case-a: When a load is applied at the centre of the hub . . . 109
4.5.2 Case-b: When a load is applied at off set position at the hub . . . . 109
4.6 Numerical experiments for the triskelion force artefacts . . . 112
4.6.1 Numerical experiments phase 1: Investigation of arm lengtha` . . . 113
4.6.2 Numerical experiments phase 2: Investigation of stiffnesskzand beam parameters . . . 116
4.6.3 Numerical experiments phase 3: Investigation of torsional stiffnessλx 118 4.7 Discussion of computed results . . . 121
4.8 Conclusion . . . 122
5.2 Development of triskelion force artefacts . . . 126
5.2.1 Challenges with sample design . . . 126
5.2.2 Brief description manufacturing techniques . . . 127
5.2.3 Polymeric triskelion force artefacts: Pros and cons . . . 128
5.3 Basic requirements for triskelion force artefact’s samples for testing experiments128 5.4 Potential fabrication approaches for 1-10 mm triskelion force artefacts . . . 130
5.4.1 MEMS fabrication: silicon micromachining . . . 130
5.4.2 Stereolithography (SL) and Microstereolithography (MSL) . . . 131
5.4.3 Injection moulding and Die-casting . . . 133
5.5 The use of triskelion force artefacts . . . 135
5.6 Low-cost production of polymer triskelion test specimens . . . 137
5.7 Triskelion force artefacts . . . 139
5.7.1 Type of triskelion artefacts . . . 139
5.7.2 Specification for artefact samples: classic and angle-beam triskelion . 139 5.7.3 Measurements of beam parameters of triskelion force artefact’s samples141 5.7.4 Batches charaterisation . . . 146
5.8 Conclusion . . . 148
6 Experimental analysis of stiffness: Classic triskelion force artefacts 149 6.1 Introduction . . . 149
6.2 Development of new method to measure the stiffness . . . 150
6.2.1 Operational principle of test-rig method . . . 151
6.2.2 Procedure to measure the stiffness . . . 156
6.2.3 Calibration of the force transducer . . . 157
6.3 Experimental test requirement . . . 158
6.4 Uncertainty expression for stiffness . . . 159
6.5 Stiffness measurement of classic triskelion force artefacts . . . 161
6.5.1 Batch a : Classic triskelion force artefacts with angle 60◦ . . . 163
6.5.2 Batch b : Classic triskelion force artefacts with angle 90◦ . . . 164
6.7 Conclusion . . . 168
7 Experimental analysis of stiffness: Angle-beam triskelion force artefacts 173 7.1 Introduction . . . 173
7.2 Angle-beam triskelionforce artefacts . . . 174
7.2.1 Motivation for angle-beam triskelion force artefacts . . . 174
7.2.2 Stiffness measurement of angle-beam triskelion force artefacts . . . . 174
7.2.3 Batch a :Angle-beam triskelion force artefacts with angle 60◦ . . . . 175
7.2.4 Batch b :Angle-beam triskelion force artefacts with angle 90◦ . . . . 176
7.2.5 Batch c :Angle-beam triskelion force artefacts with angle 120◦ . . . 177
7.3 Discussion and stiffness analysis of angle-beam triskelion force artefacts . . 178
7.4 Conclusion . . . 178
8 Tetraskelion force artefacts: specification, design, experimental analysis of stiffness and numerical investigations 183 8.1 Introduction . . . 183
8.2 Motivation for tetraskelion force artefacts . . . 184
8.3 Types and design tetraskelion force artefacts . . . 184
8.3.1 Specification, fabrication and dimensions measurement for classic & angle-beam tetraskelion samples . . . 185
8.4 Stiffness measurement for classic tetraskelion and angle-beam samples . . . 185
8.4.1 Batch i : Classic tetraskelion force artefacts, centre symmetric with elbow angle 90◦ . . . 190
8.4.2 Batch j : Classic tetraskelion force artefacts, diagonal symmetric with angle 90◦ . . . 191
8.4.3 Batch k &`: Angle-beam tetraskelion force artefacts, centre & diag-onal symmetric with angle 90◦ . . . 192
8.5 Stiffness behaviour of tetraskelion force artefacts . . . 197
8.6 Tetraskelion software program . . . 198
8.7 Numerical experiments for tetraskelion force artefacts . . . 200
8.7.2 Numerical experiments phase 5: Investigation of stiffnesskzand beam
parameters (`,w, &t) . . . 204
8.7.3 Numerical experiments phase 6: Investigation of torsional stiffnessλx and beam parameters (`,w, &t) . . . 205
8.8 Discussion of computed results . . . 211
8.9 Conclusion . . . 212
9 Best Choices of triskelion and tetraskelion force artefacts for industrial applications 214 9.1 Introduction . . . 214
9.2 Measurements of beam parameters of triskelion and tetraskelion force arte-fact’s samples . . . 215
9.3 Validation of classic and angle-beam triskelion force artefacts with elbow angle 60◦ . . . 215
9.4 Effects of elbow angle on classic and angle-beam triskelion force artefacts . 217 9.5 Performance and linear ranges for triskelion for artefacts . . . 218
9.6 Effects of elbow angle on classic and angle-beam tetraskelion force artefacts 218 9.7 Performance and linear ranges for tetraskelion for artefacts . . . 219
9.8 Enhanced numerical experiments for triskelion and tetraskelion force artefacts 219 9.8.1 Enhanced numerical experiments for triskelion artefacts with elbow angle 60◦, 45◦, 30◦, and 15◦ . . . 220
9.8.2 Enhanced numerical experiments for tetraskelion artefacts with elbow angle 60◦,45◦, 30◦,and 15◦ . . . 220
9.9 Major Applications of triskelion and tetraskelion force artefacts . . . 222
9.10 Best triskelion and tetraskelion suspensions designs . . . 223
9.11 Conclusion . . . 224
10 Conclusion 253
10.1 Recommendation for the future production of triskelion and tetraskelion devices256
A.1 Basic stiffness and compliance matrices . . . 272 A.2 Triskelion arm: beam length ratio and stiffness . . . 274
B Computation schema and codes for triskelion program, 275
B.1 Computation schema for triskelion Program . . . 275 B.2 Triskelion program: MATLAB codes . . . 278
List of Tables
2.1 Data of the balances and mass comparators used at PTB for the realization of the mass scale and for high-precision mass determinations (selection), (Max: maximum capacity, d: scale interval, S: standard deviation, Srel: relative
standard deviation in relation to the usable maximum capacity). . . 21
3.1 Equivalent for model in figure 3.2 . . . 69
4.1 Anglesαi and βi for triskelion force artefacts . . . 103
4.2 Input parameters for the new model, with typical values. . . 103
5.1 Specification for classic triskelion force artefacts with 60◦,90◦, & 120◦elbow angle. . . 140
5.2 Specification for angle-beam triskelion force artefacts with 60◦,90◦, & 120◦ elbow angle. . . 140
5.3 Classic triskelion samples of force artefacts . . . 147
5.4 Angle-beam triskelion samples of force artefacts . . . 147
6.1 Recorded current data sets for different hooks of known weight. . . 158
6.2 Measured stiffness of classic triskelion force artefacts from tables D.1, D.2, D.3, D.4, D.5, D.6, D.7 and D.8. . . 167
7.1 Measured stiffness of angle-beam triskelion force artefacts from tables F.1, F.2, F.3, F.4, F.5, and F.6. . . 178
8.3 Angle-beam tetraskelion samples of force artefacts . . . 189
8.4 Measured stiffness of classic and angle-beam tetraskelion force artefacts from Tables H.1, H.2, H.3, H.4, H.5, and H.6. . . 198
8.5 αi and βi for tetraskelion model . . . 200
8.6 Input parameters specification for TSFAs with 60◦,90◦,120◦,150◦& 180◦. 200 9.1 Classic triskelion samples of force artefacts . . . 242
9.2 Angle-beam triskelion samples of force artefacts . . . 242
9.3 Classic tetraskelion samples of force artefacts . . . 243
9.4 Angle-beam tetraskelion samples of force artefacts . . . 243
9.5 Comparative analysis of stiffness kzp N/m predicted by triskelion software program and experimental values kzexp N/m at the centre of the hub; `, w &t are beam parameters of classic triskelion force artefacts. . . 244
9.6 Comparative analysis of stiffness kzp N/m predicted by triskelion software program and experimental values of stiffnesskzexp N/mat off-centre point of hub (Mx term consider the hub regions only);`,w&tare beam parameters of classic triskelion force artefacts. . . 244
9.7 Comparative analysis of stiffness kzp N/m predicted by triskelion software program and experimental values of stiffness kzexp N/m at of the hub; `, w &t are beam parameters of angle-beam triskelion force artefacts. . . 245
9.8 Comparative analysis of stiffness kzp N/m predicted by triskelion software program and experimental values stiffnesskzexp N/mat off-centre point (Mx term consider the hub regions only); `,w &tare beam parameters of angle-beam triskelion force artefacts. . . 245
9.9 Comparative analysis of stiffness kzp N/m predicted by triskelion software program and experimental values of stiffnesskzexp N/mat the centre of hub; `,w &tare beam parameters of classic tetraskelion force artefacts. . . 246
9.11 Comparative analysis of stiffness kzp N/m predicted by triskelion software program and experimental values of stiffness kzexp N/m at the centre of the hub; `,w& tare beam parameters of angle-beam tetraskelion force artefacts. 247 9.12 Comparative analysis of stiffness kzp N/m predicted by triskelion software
program and experimental values of stiffnesskz−exp N/mat off-centre point of the hub (Mx term consider the hub regions only); `, w & t are beam parameters of angle-beam tetraskelion force artefacts. . . 247 9.13 Performance of classic and angle-beam triskelion samples of force artefacts. 248 9.14 The complete picture of predicted axial and torsional stiffness by the
en-hanced linear elastic model for triskelion force artefacts with elbow angle 15◦, 30◦, 45◦, 60◦, 90◦, 120◦, 150◦ and 180◦,. . . 249 9.15 The complete picture of predicted axial and torsional stiffness by the
en-hanced linear elastic model for triskelion force artefacts with elbow angle 15◦, 30◦, 45◦, 60◦, 90◦, 120◦, 150◦ and 180◦,. . . 250 9.16 The complete picture of predicted axial and torsional stiffness by the
en-hanced linear elastic model for triskelion force artefacts with elbow angle 15◦, 30◦, 45◦, 60◦, 90◦, 120◦, 150◦ and 180◦,. . . 251 9.17 The complete picture of predicted axial and torsional stiffness by the
en-hanced linear elastic model for triskelion force artefacts with elbow angle 15◦, 30◦, 45◦, 60◦, 90◦, 120◦, 150◦ and 180◦,. . . 252
D.1 Coefficients analysis of plotted graph for classic triskelion artefact CSS1-60. 292 D.2 Coefficients analysis of plotted graph for classic triskelion artefact CS2-60. . 292 D.3 Coefficients analysis of plotted graph for classic triskelion artefact CS1-90. . 293 D.4 Coefficients analysis of plotted graph for classic triskelion artefact CS2-90. . 293 D.5 Coefficients analysis of plotted graph for classic triskelion artefact CS1-120. 293 D.6 Coefficients analysis of plotted graph for classic triskelion artefact CS2-120. 293 D.7 Coefficients analysis of plotted graph for classic triskelion polymer artefact
CS1-604. . . 294 D.8 Coefficients analysis of plotted graph for classic triskelion polymer artefact
F.1 Coefficients analysis of plotted graph for angle-beam triskelion artefact ABS1-60. . . 320 F.2 Coefficients analysis of plotted graph for classic triskelion artefact ABS2-60. 320 F.3 Coefficients analysis of plotted graph for angle-beam triskelion artefact ABS1-90321 F.4 Coefficients analysis of plotted graph for classic triskelion artefact ABAS2-90. 321 F.5 Coefficients analysis of plotted graph for angle-beam triskelion artefact
ABS1-120. . . 321 F.6 Coefficients analysis of plotted graph for classic triskelion artefact ABS2-120. 321
H.1 Coefficients of the best linear fit to graphs for classic tetraskelion centre symmetric sample CS1-CS-90. . . 342 H.2 Coefficients of the best linear fit to graphs for classic tetraskelion centre
symmetric sample CS2-CS-90. . . 342 H.3 Coefficients of the best linear fit to graphs for classic tetraskelion diagonal
symmetric sample CS1-DS-90. . . 343 H.4 Coefficients of the best linear fit to graphs for classic tetraskelion diagonal
symmetric sample CS2-DS-90. . . 343 H.5 Coefficients of the best linear fit to graphs for angle-beam tetraskelion centre
symmetric sample ABS1-DS-90. . . 343 H.6 Coefficients of the best linear fit to graphs for angle-beam tetraskelion
List of Figures
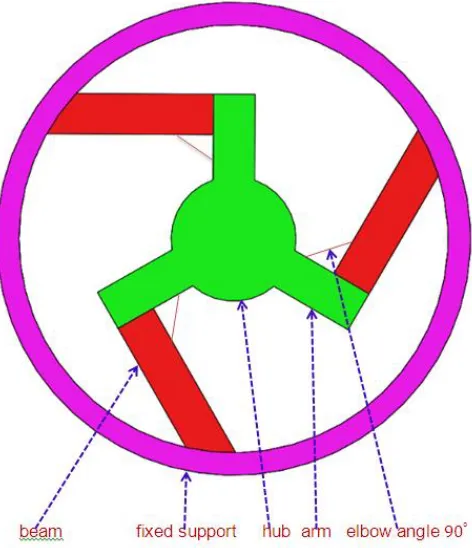
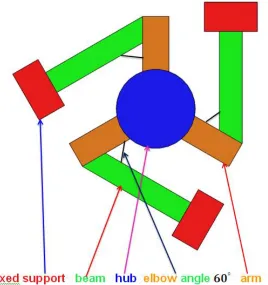
1.1 The classical triskelion suspension for a micro probe, layout with elbow angle 60◦. . . 4
2.1 A common traceability path(from [1]) . . . 12 2.2 Schematic of NPL low force balance components: (1) platen and strut, (2) leaf
spring, (3) parallelogram body, (4) dielectric, (5) capacitor plate, (6) spacer, (7) reference mirror, (8) moving mirror, (9) cantilever, (10) counterweight, and (11) laser beams . . . 15 2.3 Picture of NPL low force balance (from [2]). . . 15 2.4 (Three-dimensional computer model of the electrical nanobalance device.
The area shown is 980 µm 560 µm. Dimensions perpendicular to the plane have been expanded by a factor of 20 for clarity (from [3]). . . 16 2.5 SI traceability in the NIST small force metrology laboratory (from [4]). . . 17 2.6 Schematic of NIST EFB components: (1) parallelogram balance, (2)
differen-tial plane mirror interferometer, (3) main inner electrode (cross-section), (4) main outer electrode (cross-section), (5) vacuum chamber, (6) optical table, (7) granite foundation block, (8) heterodyne laser light source, (9) mass lift and (10) counterweight (from [4]). . . 19 2.7 Measuring Facility with rotary table (from [5]). . . 22 2.8 Facility for dynamic force calibration (from [6]). . . 22 2.9 Electrostatic system for stiffness reduction1: base plate; 2: conductive
2.10 Lateral view of the electrostatic system for stiffness reduction1: base plate; 2: conductive disc-pendulum; 3, 4: external conductive plates; 5: suspension by a thin conductive wire; 6, 7: voltage sources; 8: electric insulation layer; 9: frame fastened to base plate (d1≈d2≈10−4m) (from [7]). . . 25 2.11 Construction principle of the new FSM. The ECB is located on a platform
mounted on a NPT and can thus be driven against the force transducer. The transducer itself hangs on a rotational and tilting table for precise adjust-ment. The tilt table can be changed in x and y direction, whereby the tilt angle is measured by two appropriate tilt sensors. The rotational table allows a rotation of 360 degree. All hanging components are mounted on a vertical moveable traverse. (from [8]). . . 26 2.12 Photograph of the new FSM. In the lower part one can see the NPT and
the balance, surrounded by a foil to reduce thermal influences. Above the balance, the transducer, with the adapter mounted on the rotational and tilt table (from [8]). . . 26 2.13 A conventional micro-weighing device: the electro-mechanical system.(from [9]). 29 2.14 A photo of the nano force calibrator (NFC) consisting of a commercial
mi-crobalance, a three-axis stage, a nanostage and so on. The cantilever pressing the load button is shown in the inset(from [10]). . . 29 2.15 A schematic diagram of the calibration setup using the nano force calibrator
(NFC) (from [10]). . . 31 2.16 Schematic diagram of traceable picoNewton force realization based on flux
quantization in a superconducting annulus (from [11]). . . 31 2.17 The seven base units and their relationship in the current SI (from [12]). . . 35 2.18 Figure 2. Definition of and relationship between the seven base units in the
2.20 The probe tip (T) and the stylus (S) are suspended to the probe house by three slender rods (R) tangentially touching an intermediate body (I).The free ends of the rods are to be connected to the probe house (from [14]). . . 40 2.21 Dimensions of the suspension from [14]). . . 40 2.22 Functional principle of the 3D microprobe system: (1) fibre coupling, (2)
focus lens, (3) reference mirror, (4) neutral and (5) polarizing beam splitter, (6) probe mount system and (7) plug. from [15]). . . 42 2.23 New system design for the 3D microprobe system: (1) fibre coupling, (2)
focus lens, (3) reference mirror, (4) probe mount system, (5) plug, (6) over-load protection and (7) weight force compensation and force generating unit from [15]). . . 42 2.24 Designs for the suspension system: (1) stylus, and (2) sensor elements. (a)
Full or cross-shaped boss membranes [16]). (b) IBS Triskelion probe [17]): Invar membrane with capacitive sensors. (c) Gannen-XP [18]): silicon mem-brane with piezoresistive sensing elements. . . 43 2.25 Assumptions and result of the membrane design. (a) Substituted mechanical
system. (b) Design: (1) stylus, (2) bending area from [15]). . . 43 2.26 Schematic setup of the string force sensor- the nanoguitar (from [19]). . . . 46 2.27 Drawing of the prototype force sensor. Example of an actual experimental
set-up showing sheer piezo for tension adjustment and magnetic for actuation of Lorentz oscillations (from [19]). . . 46 2.28 Schematic diagram of a double-ended tuning fork resonance force sensor
(from [20]). . . 46 2.29 Imaging techniques that can be used to observe physical, biological and
biochemical changes occurring in biological structures during biomechanical tests of cells and biomolecules (from [21]). . . 52 2.30 Experimental techniques for conducting mechanical tests in single cell and
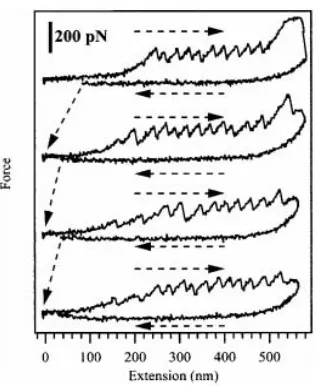
single molecule biomechanics (from [21]). . . 52 2.31 (a) The unfolding of protein domains by an external force, (b) The
2.32 Force extension curves obtained by stretching titin proteins show periodic features that are consistent with their modular construction (from [23]). The ex1ension curve in the spacer region preceding the saw-tooth is not well defined and would likely hinder traceability. . . 53 2.33 Four consecutive force spectra on a single molecule of the protein titin using
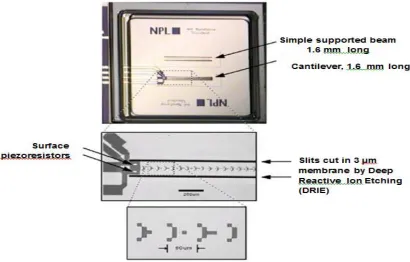
a small cantilever. All force spectra were acquired at a pulling rate of 3039 mm/s, which is an order of magnitude faster than previously performed with conventional cantilevers (from [24]). . . 54 2.34 Experimental prototype reference cantilever array plan view (SOI device
level) (from [25]). . . 57 2.35 Optical micrographs of the cantilever microfabricated array of reference
springs (C-MARS). Note the binary length scale formed from 10 µm surface oxide squares (from [26]). . . 58
3.1 A generic end-loaded cantilever. . . 63 3.2 A rod attached to rigid support (base and platform). . . 65 3.3 The classic triskelion suspension: (a) layout of 90◦ elbow angle. . . 72 3.4 The classic triskelion suspension: (b) further model simplification. . . 72 3.5 Geometric parameters of a typical suspension system (a), and the classic
triskelion suspension layout (b). . . 75 3.6 Single beam of triskelion suspension model. . . 77 3.7 Pseudo-kinematic ‘map’ for one suspension leg of a classic triskelion design. 81 3.8 Pseudo-kinematic equivalence for ‘angle-beam’ triskelion flexure. . . 83 3.9 Basic cantilever model. . . 84 3.10 Two separated bodies of the suspension beam (shown for a angle 90◦). . . . 86 3.11 Relationship betweenβ andφ, illustrated for ‘internal’ angles of around 120◦
and 60◦. . . 86
4.3 Simplified 2D model of platform and suspension, (a) concept, (b) effect of central load, (c) effect of offset load. . . 108 4.4 The triskelion force artefacts with elbow angles, (a) 60◦, (b) 90◦, (c) 120◦,
(d) 150◦ and (e) 180◦. . . 114 4.5 Graph for variable arm’s length a` verses computed results for stiffnesskz of
triskelion force artefacts with elbow angles 60◦,90◦,120◦,150◦& 180◦. . . . 115 4.6 Graph for variable arm’s lengtha` verses computed results for stiffnessλz of
triskelion force artefacts with elbow angles 60◦,90◦,120◦,150◦& 180◦. . . . 115 4.7 Graph for variable beam’s length`verses computed results for stiffnesskz of
triskelion force artefacts with elbow angles 60◦,90◦,120◦,150◦& 180◦. . . . 117 4.8 Graph for variable beam’s width w verses computed results for stiffness kz
of triskelion force artefacts with elbow angles 60◦,90◦,120◦,150◦& 180◦. . 117 4.9 Graph for variable beam’s thicknesstverses computed results for stiffnesskz
of triskelion force artefacts with elbow angles 60◦,90◦,120◦,150◦& 180◦. . 118 4.10 Graph for variable beam’s length`verses computed results for stiffnessλz of
triskelion force artefacts with elbow angles 60◦,90◦,120◦,150◦& 180◦. . . . 119 4.11 Graph for variable beam’s width w verses computed results for stiffness λz
of triskelion force artefacts with elbow angles 60◦,90◦,120◦,150◦& 180◦. . 120 4.12 Graph for variable beam’s thicknesstverses computed results for stiffnessλz
of triskelion force artefacts with elbow angles 60◦,90◦,120◦,150◦& 180◦. . 120
5.1 The triskelion mould with elbow angle 60◦. . . 138 5.2 The triskelion mould with elbow angle 120◦. . . 138 5.3 The sample CS1-60 of a classic triskelion force artefact with elbow angle 60◦. 142 5.4 The sample CS2-604 of a classic triskelion force artefact with elbow angle 60◦.142 5.5 The sample CS1-90 of a classic triskelion force artefact with elbow angle 90◦. 143 5.6 The sample ABS2-90 of a angle-beam triskelion force artefact with elbow
angle 90◦. . . 143 5.7 The sample CS2-120 of a classic triskelion force artefact with elbow angle 120◦.144 5.8 The sample ABS2-120 of a angle-beam triskelion force artefact with elbow
5.9 The sample ABS1-60 of a angle-beam triskelion force artefact with elbow angle 60◦. . . 145 5.10 Measured dimensions of classic triskelion sample CS1-60, with elbow angle
60◦. . . 145 5.11 Measured dimensions of angle-beam triskelion sample CS1-60, with elbow
angle 60◦. . . 146
6.1 Experimental arrangement for the variable tracking force using a magnetic force transducer from [27] and [28]. . . 151 6.2 New Method: Schema of Test-rig Method to measure the stiffness of triskelion
force artefacts. . . 153 6.3 New Method:Picture of Test-rig Method to measure the stiffness of triskelion
force artefacts . . . 154 6.4 Calibration to determine the constant of the force Talysurf transducer. . . . 158 6.5 Stiffness measured at the centre of hub for classic triskelion sample CS1-60
S.No. 1, D.1 . . . 169 6.6 Stiffness measured at off-centre point for classic triskelion sample CS1-60
S.No. 4, D.1 . . . 169 6.7 Stiffness measured at the centre of hub for classic triskelion sample CS1-90
S.No. 2, D.3 . . . 170 6.8 Stiffness measured at off-centre point for classic triskelion sample CS1-90
S.No. 4, D.3 . . . 170 6.9 Stiffness measured at the centre of hub for classic triskelion sample CS1-120
S.No. 3, D.5 . . . 171 6.10 Stiffness measured at off-centre point of hub for classic triskelion sample
CS1-120 S.No. 4, D.5 . . . 171 6.11 Stiffness measured at the centre of hub for classic triskelion sample CS1-120
S.No. 1, D.7 . . . 172 6.12 Stiffness measured at off-centre point of hub for classic triskelion sample
7.1 Stiffness measured at the centre of hub for angle-beam triskelion samples ABS1-60 S.No. 1, Table F.1 . . . 180 7.2 Stiffness measured at off-centre point for angle-beam triskelion samples
ABS1-60 S.No. 4, Table F.1 . . . 180 7.3 Stiffness measured at the centre of hub for angle-beam triskelion samples
ABS2-90 S.No. 1, Table F.3 . . . 181 7.4 Stiffness measured at off-centre point for angle-beam triskelion samples
ABS1-90 S.No. 4, Table F.3 . . . 181 7.5 Stiffness measured at the centre of hub for angle-beam triskelion samples
ABS1-120 S.No. 1, Table F.5 . . . 182 7.6 Stiffness measured at off-centre point for angle-beam triskelion samples
ABS1-120 S.No. 4, Table F.5 . . . 182
8.1 The classic tetraskelion suspension with centre symmetric (CS) and a layout with elbow angle 90◦ . . . 186 8.2 The classical tetraskelion suspension with centre symmetric and further
model simplification with elbow angle 90◦ . . . 186 8.3 The classic tetraskelion suspension with diagonal symmetric (DS) and a
lay-out with elbow angle 90◦ . . . 187 8.4 The classical tetraskelion suspension with diagonal symmetric (DS) and
fur-ther model simplification with elbow angle 90◦ . . . 187 8.5 Measured dimensions of classic triskelion sample CS1-CS-90, with elbow
an-gle 90◦. . . 188 8.6 Measured dimensions of angle-beam triskelion sample ABS1-CS-90, with
el-bow angle 60◦. . . 188 8.7 Symmetry of the platform for tetraskelion (CS & DS), dis length of square
type hub'diameter of the hub,sis perpendicular distance from the platform centre to the arm-cental-line. s= 0 for CS case and s= d3 for DS case. . . . 193 8.8 Stiffness measured at the centre for classic tetraskelion samples
8.10 Stiffness measured at the centre of hub for classic tetraskelion samples CS1-DS-90 S.No. 3, Table H.3. . . 195 8.11 Stiffness measured at off-point for classic tetraskelion samples CS2-DS-90
S.No. 4, Table H.4. . . 195 8.12 Stiffness measured at the centre of hub for classic triskelion samples
CS1-CS-90 S.No. 3, Table H.5. . . 196 8.13 Stiffness measured at off-centre point of hub for classic tetraskelion samples
CS1-DS-90 S.No. 6, Table H.6 . . . 196 8.14 Dependency Diagram for Tetraskelion Program . . . 199 8.15 The simplified model for tetraskelion force artefacts, centre symmetric
(TTSFA-CS-90) with elbow angle 90◦. . . 201 8.16 The simplified model for tetraskelion force artefacts, centre symmetric
(TTSFA-CS-135) with elbow angle 135◦. . . 201 8.17 The simplified model for tetraskelion force artefacts, centre symmetric
(TTSFA-CS-180) with elbow angle 180◦. . . 202 8.18 The simplified model for tetraskelion force artefacts, diagonal symmetric
(TTSFA-DS-90) with elbow angle 90◦. . . 202 8.19 The simplified model for tetraskelion force artefacts, diagonal symmetric
(TTSFA-DS-135) with elbow angle 135◦. . . 203 8.20 The simplified model for tetraskelion force artefacts, diagonal symmetric
(TTSFA-DS-180) with elbow angle 180◦. . . 203 8.21 Graph for variable arm’s length verses computed results for stiffness kz of
tetraskelion force artefacts TTSFA-CS-90, TTSFA-DS-90, TTSFA-CS-135, TTSFA-DS-135, TTSFA-CS-180, & TTSFA-DS-180 with elbow angles 90◦, 135◦ and 180◦ . . . 207 8.22 Graph for variable arm’s length verses computed results for torsional stiffness
8.23 Graph for beam’s length verses computed results for stiffnesskz of tetraske-lion force artefacts CS-90, DS-90, CS-135, TTSFA-DS-135, TTSFA-CS-180, & TTSFA-DS-180 with elbow angles 90◦, 135◦ and 180◦ . . . 208 8.24 Graph for variable beam’s length verses computed results for stiffnesskz of
tetraskelion force artefacts TTSFA-CS-90, TTSFA-DS-90, TTSFA-CS-135, TTSFA-DS-135, TTSFA-CS-180, & TTSFA-DS-180 with elbow angles 90◦, 135◦ and 180◦. . . 208 8.25 Graph for beam’s thickness verses computed results for stiffness kz of
tetraskelion force artefacts TTSFA-CS-90, TTSFA-DS-90, TTSFA-CS-135, TTSFA-DS-135, TTSFA-CS-180, & TTSFA-DS-180 with elbow angles 90◦, 135◦ and 180◦ . . . 209 8.26 Graph for variable beam’s length verses computed results for torsional
stiff-nessλxof tetraskelion force artefacts CS-90, DS-90, TTSFA-CS-135, TTSFA-DS-135, TTSFA-CS-180, & TTSFA-DS-180 with elbow an-gles 90◦, 135◦ and 180◦. . . 209 8.27 Graph for beam’s width verses computed results for torsional stiffnessλx of
tetraskelion force artefacts TTSFA-CS-90, TTSFA-DS-90, TTSFA-CS-135, TTSFA-DS-135, TTSFA-CS-180, & TTSFA-DS-180 with elbow angles 90◦, 135◦ and 180◦ . . . 210 8.28 Graph for variable beam’s thickness verses computed results for torsional
stiffness λx of tetraskelion force artefacts TTSFA-CS-90, TTSFA-DS-90, TTSFA-CS-135, TTSFA-DS-135, TTSFA-CS-180, & TTSFA-DS-180 with elbow angles 90◦, 135◦ and 180◦. . . 210
9.1 Classic triskelion force artefacts ((a), (b), (c), & (d) with elbow angle 60◦ and (e) & (f) with elbow angle 90◦) indicate their performances in the linear region . . . 226 9.2 Classic triskelion force artefacts ((g) & (h)with elbow angle 90◦ and (i), (j),
9.3 Angle-beam triskelion force artefacts ((a), (b), (c), & (d) with elbow angle 60◦ and (e) & (f) with elbow angle 90◦) indicate their performances in the linear region . . . 228 9.4 Angle-beam force artefacts ((g) & (h)with elbow angle 90◦ and (i), (j), (k)
& (l) with elbow angle 120◦) indicate their performances in the linear region 229 9.5 Graph for arm length versus computed results for axial stiffnesskz of
triske-lion force artefacts CTSFA-60, CTSFA-45, CTSFA-30, & CTSFA-15 with elbow angles 60◦, 45◦, 30◦, and 15◦ . . . 230 9.6 Graph for arm length versus computed results for torsional stiffness kx of
triskelion force artefacts CTSFA-60, CTSFA-45, CTSFA-30, & CTSFA-15 with elbow angles 60◦, 45◦, 30◦, and 15◦. . . 230 9.7 Graph for beam length versus computed results for axial stiffnesskzof
triske-lion force artefacts CTSFA-60, CTSFA-45, CTSFA-30, & CTSFA-15 with elbow angles 60◦, 45◦, 30◦, and 15◦ . . . 231 9.8 Graph for variable beam length versus computed results for axial stiffnesskz
of triskelion force artefacts CTSFA-60, CTSFA-45, CTSFA-30, & CTSFA-15 with elbow angles 60◦, 45◦, 30◦, and 15◦. . . 231 9.9 Graph for beam thickness verses computed results for axial stiffness kz of
triskelion force artefacts CTSFA-60, CTSFA-45, CTSFA-30, & CTSFA-15 with elbow angles 60◦, 45◦, 30◦, and 15◦ . . . 232 9.10 Graph for variable beam length versus computed results for torsional stiffness
λxof triskelion force artefacts 60, 45, 30, & CTSFA-15 with elbow angles 60◦, 45◦, 30◦, and 15◦. . . 232 9.11 Graph for beam width versus computed results for torsional stiffness λx of
triskelion force artefacts CTSFA-60, CTSFA-45, CTSFA-30, & CTSFA-15 with elbow angles 60◦, 45◦, 30◦, and 15◦. . . 233 9.12 Graph for variable beam thickness versus computed results for torsional
9.13 Graph for variable arm length verses computed results for axial stiffness kz of tetraskelion force artefacts CTTSFA-60, CTTSFA-45, CTTSFA-30, & CTTSFA-15 with elbow angles 60◦, 45◦, 30◦, and 15◦ . . . 234 9.14 Graph for variable arm length versus computed results for torsional stiffness
kx of tetraskelion force artefacts CTTSFA-60, CTTSFA-45, CTTSFA-30, & CTTSFA-15 with elbow angles 60◦, 45◦, 30◦, and 15◦. . . 234 9.15 Graph for beam length versus computed results for axial stiffness kz of
tetraskelion force artefacts CTTSFA-60, CTTSFA-45, CTTSFA-30, & CTTSFA-15 with elbow angles 60◦, 45◦, 30◦, and 15◦ . . . 235 9.16 Graph for variable beam length versus computed results for axial stiffness
kz of tetraskelion force artefacts CTTSFA-60, CTTSFA-45, CTTSFA-30, & CTTSFA-15 with elbow angles 60◦, 45◦, 30◦, and 15◦. . . 235 9.17 Graph for beam thickness versus computed results for stiffness axial kz
of tetraskelion force artefacts CTTSFA-60, CTTSFA-45, CTTSFA-30, & CTTSFA-15 with elbow angles 60◦, 45◦, 30◦, and 15◦ . . . 236 9.18 Graph for variable beam length versus computed results for torsional stiffness
λx of tetraskelion force artefacts CTTSFA-60, CTTSFA-45, CTTSFA-30, & CTTSFA-15 with elbow angles 60◦, 45◦, 30◦, and 15◦. . . 236 9.19 Graph for beam width verses computed results for torsional stiffness λx
of tetraskelion force artefacts CTTSFA-60, CTTSFA-45, CTTSFA-30, & CTTSFA-15 with elbow angles 60◦, 45◦, 30◦, and 15◦. . . 237 9.20 Graph for variable beam thickness verses computed results for torsional
9.28 The simplified model for tetraskelion force artefacts with elbow angle 45◦. . 241
Chapter 1
Introduction
This chapter introduces the needs and ideas for low force measurement and the subsequent need for low force artefacts. It then identifies limitations in the current understanding of low force technology leading to the aims, objectives, and scope of this thesis.
1.1
Background: General need in force metrology
The past two decades have seen many advancements in micro and nano technology. New devices are being produced which can create very small forces in the micro to nano-newton scale and require new calibration methods. The growing interest in nanomechanics is greatly demanding the accurate measurement for determining the mechanical property micro- and nano-devices down to nanonewton level [29], [30], [31]. These types of appli-cation have great importance in metrology and are becoming essential for micro to nano level for small force calibration. The biophysicists have also been seen to characterising small forces down to subpiconewton that are associated with cells and molecules to study the role of forces and mechanical properties that can effect biological processes [32], [33], [34].
elastic modulus of bulk materials [38]. This technique is also referred to as nanoindentation when used at small forces and depths. The interaction forces between biological molecules and Casimir force is also measured by an AFM [39], [40].
Dynamic atomic microscopy (DAFM) is also a most important and powerful tool in nanotechnology, used to measure topography and physio-chemical properties of organic and inorganic material at nano length scale, manipulation and fabrication of functional nanostructures. An example of a vibrating micro cantilever with a nanoscale tip when interacts with a sample via long and short range force that has several distinct eigenmodes and tip sample forces that are non-linear. Further improvement in imaging contract or reduction in imaging forces are afforded by the modes are worthy testament to the importance of cantilever dynamic in DAFM [41], [42].
The role of contact probes in metrology is essential for dimensional and other measure-ments. Force metrology is crucial in many industries that have increasing concern with smaller and ultimately these are relying only on AFM etc. Force measurements are most essential in micro- and nano-technology,atomic force microscope (AFM), coordinate mea-suring machine (CMM), material testing aerospace, aviation industry, car industry, safety engineering, energy production process, power plants, medicine, biomedicine, chemical industry micro-CMM which are creating great demand for tracing micro- to nano-newton forces [43] [44].
The most intuitive method for force calibration is by deadweight. This is still used for maintaining traceability within the millinewton to meganewton range( [45]). However, for smaller forces at the end of the low force balance scale, handling difficulties and independent testing issues lead to a high relative uncertainties in deadweight measurement. Hence, dead-weights are impractical for low force calibration. A new route required to calibrate the low force that will be discussed in chapter 2.
Physikalich-Technische Bundesanstalt (PTB), centre for measurement standards-industrial technology research institute (CMS-ITRI) and other institutions are attempting to de-velop technology and implement it in the working range 1 nN to 10 µN to measure low forces. They have also developed low force facilities [46], [47], [48], [49], [50], [9], [51], [52], [53], [54], [55], [56] which will be reviewed in the second chapter.
1.2
Scope of the thesis
Section 1.1 has highlighted some of the many physical principles that could be applied to small-scale force sensing. It has also made it evident that very few are mature enough and technologically sufficiently controllable to have practical relevance in force transfer artefacts within the next few years. This is especially the case for upper parts of the ranges of the low- force secondary standards being implemented by National Measurement Institutions (NMIs) in the 2000-2020 period. Given also the perception that the upper range is one of most pressing industrial needs, NPL appear fully justified in declaring that the other programs from 2005 would follow only an elastic device as a force transfer artefact for use with their low force balance (LFB).
Figure 1.1: The classical triskelion suspension for a micro probe, layout with elbow angle 60◦.
1.3
Aims and objectives of the research work
The overall aim of this study is to improve the understanding and practice of micro calibra-tion by means of triskelion force artefacts and the measurement of small forces that could interact between a secondary standard and working instruments. It is concerned first with calibration at a national level, and later with a low-cost effective, robust design for direct industrial use.
In order to achieve the above aims, the following major research objectives have been identified:
• Studying and reporting on of force sensing methods.
• Development of enhanced linear clastic model for variant design of triskelion artefacts.
• Development of triskelion and tetraskelion software programs.
• Exploring a low-cost approach for fabrication of triskelion and tetraskelion force
• Development of test-rig method to measurement of low forces in the range up to
around 1 Newton and displacements of up to of 1mm.
1.4
Layout of the thesis
Chapter 2: Needs and capabilities in low-force technology
This chapter reviews the measurement of small forces in the micro- to nano-newton range that is becoming a very important field of research within in micro- and nanotechnology, nanoindenters, AFM, micro-CMMs and so on. The generation and measurement of small forces have many applications in the various fields of technology. This chapter specifically presents force sensing methods and the capability for small force metrology in the NMIs and other institutions.
Chapter 3: Linear Elastic Model for triskelion suspension
This chapter starts with a brief overview of some fundamental elastic beam theory. Follow-ing this, a novel contribution of this chapter is the development of an enhanced linear elastic model for triskelion suspension in order to predict the stiffness of triskelion force artefacts. Unlike published examples, it has capability to set independently all potential significant design parameters, such as elbow angles and can allow any number and distribution of n suspension beams around the centre of the hub of force artefacts. The new linear elastic model for triskelion force artefacts will be used to investigate changes in the elbow angles of the triskelion force artefacts, the stabilities and stiffness of platform centre (hub).
Chapter 4:- Implementation of linear elastic model; Numerical experiments and data analysis
these types must become non-linear with increasing deflection, so the validity of the simple model under different parameters needs full investigation.
Chapter 5:- Triskelion polymeric force artefacts; Specification and design
This chapter describes the use of polymeric triskelion force artefacts for the first time. The use of polymeric force artefacts has the commercial capability to exploit polymers in a mass production scale for triskelion force artefacts and the possibility to offer a low-cost approach that is highly useful for industries. The low-cost approach could bring a revolution in the use of polymers in the design of triskelion force artefacts, just like precision injection moulding in the commercial market.
Chapter 6:- Experimental analysis of stiffness; Classic triskelion force artefacts
This chapter covers the specification, design and use of the best bespoke method for testing the stiffness of triskelion force artefacts. The validation testing results of classical triskelion force artefacts were carried out using the triskelion software program. The results of classic triskelion force artefacts force artefacts were also presented in this chapter. A non-linearity is deducted from whole range of experiments of classic triskelion force artefacts and angle-beam triskelion force artefacts that follows a best cubic fit. This allows analysis for the range of validity of the enhanced linear elastic model for triskelion force artefacts. The concept of non-linearity was detected for the first time from the experimental result of classic and angle-beam triskelion force artefacts and was not seen in any scientific published research papers.
Chapter 7:- Experimental analysis of stiffness; Angle-beam triskelion force arte-facts
Chapter 8:- Tetraskelion force artefacts; specification, design, experimental analysis of stiffness and numerical investigations
This chapter describes the extended research work for the design of tetraskelion force arte-facts. Two type of polymeric tetraskelion force artefacts (four legs) for classic and angle-beam tetraskelion force artefacts were fabricated. It was observed in the experimental research work that all the tetraskelion force artefacts belong to the triskelion force artefacts family and become significantly stiffer because they were kinematically constrained. This new idea is slightly counter-intuitive, being a trade-off between individual stiffness and a number of additional support legs which leads to better practical performance compared to three legs. The new polymeric tetraskelion force artefacts models and experimental tech-nique was developed and used for the preliminary investigation of these points. The poly-meric tetraskelion force artefacts were developed for the first time for practical testing and have never been published in any scientific research papers. Moreover, a new tetraskelion software program was developed by upgrading the triskelion software program to predict the stiffness of tetraskelion force artefacts before their fabrication and validation.
Chapter 9:- Best choices of triskelion and tetraskelion force artefacts for indus-trial applications
This chapter discusses the potential use of triskelion and tetraskelion force artefacts for commercial use. Their performance and working ranges in the linear region of the graphs plotted from the experimental data are described. The numerical experiments are also extended to explore the best variant design of triskelion and tetraskelion force artefacts or micro probe suspensions.
Chapter 10:- Conclusion and future recommendations
Chapter 2
Needs and capabilities in low-force
metrology
2.1
Introduction
This chapter highlight the essential standard capabilities for low force metrology developed in various NMIs in the world. The current challenges are the base units (kg, m, s) of SI systems. The NMIs are motivated by the needs for small force standards and have started to explore new methods and techniques of calibration for SI-traceable force. The primary standards of force are derived from the unit of the Newton using base units of SI systems.
The realisation of an SI unit, ‘newton’ (or a fraction of it) in terms of base unit will involve complex and delicate instrumentation (often called a ‘secondary standards’). Such systems are impractical for almost any direct calibration, necessitating the development of intermediate (interfacing) devices: force transfer artefacts. Hence, the exploration of various methods and modelling techniques are carried out in this chapter for new design of “force transfer artefacts”. This is the starting point for the development of the research work presented in this thesis.
2.2
Scope of low force measurement
Advances in research have made possible the traceability of force at the macro to nano level. The twentieth century has seen a rapid increase in the demands of scientific study and a jump in the sensitivity of instruments to measure very small forces. For example, in bioscience the detachment force using a bio-membrane probe is measured in the ranges 10−2pN and 100pN [58]. Also the mechanical force realization based on flux quantization in the pico-Newton range is proposed by [59], [60]. More generally, the use of soft materials (polymers and cells etc.) in research or industry situation risks distortion or damage unless probe forces are carefully controlled. The twentieth century has also seen major growth in highly miniature systems and true micro electro mechanical systems (MEMS) involving a wider range of materials and manufacturing procedures, e.g., the need to monitor and control forces on gripper of micro-robots and other micro-mechanical processes). The sur-face characterisation tools needed for such applications and for high precision macroscopic products (optics and bearings, etc) therefore often involve smaller and smaller forces in order to deliver necessary performance; consider for example, the stylus profilometer, and micro CMM, micro and nano-hardness testers, micro- and nano-tribometers as well as probe microscopy mentioned in chapter 1. It might further be noted that pharmaceutical and some other sectors often rely on weighing very small doses of powder, with a need to control to below a milligram mass (∼10µN weight).
The scientific and technical situations just discussed to cover, perhaps, forces from a large fraction of a newton to nano-newton, with likely growth in the use of even smaller ones where at least pico-newton resolution is needed. This is clearly to wide to cover by one method and a series of techniques with overlapping ranges will be required. There then arise a major challenges over how traceable force metrology can be archived for them.
The newton derives in the SI system from the kilogram, which is extremely difficult to realise even in a best standards laboratories to precision much better than (1×10⁻⁹). 1µN
actively on them. Generally there are at least two stages involved. First, a high-specialised traceable secondary standard is needed, which focuses directly on small forces. Following this, there needs to be adequate means of transferring information from secondary stan-dards to working devices within laboratories and factories.
This thesis takes the assumption that one of the most important ranges of low-force measurement for the next few years covers broadly from 1µN to around 100 mN. It is chosen for several reasons. First, it is highly relevant to mechanical characterisation and micro-manipulation for already established, economically important industries. Second there is good evidence that NMIs will be able to provide reasonable traceable reference instruments for this vision. There is likely to be a stable market for simpler small instruments and transfer artefacts that at low cost can either fully calibrate or at least diagnose out-of-specification conditions on user instruments. Before proceeding to consider the latter, it is helpful to review the capabilities of typical NMIs and to consider the range of sensing principles that might be applied.
2.2.1 Traceability and fundamental force concepts in metrology
Traceability
“Traceability is defined as the property of a measurement result whereby the result can be related to a reference through a documented unbroken chain of calibrations, each contributing to the measurement uncertainty” [61], [45].
or
“Traceability may also be defined as an unbroken record of documentation (documentation traceability) or an unbroken chain of measurements and associated uncertainties (metro-logical traceability)“ [1].
rare changes exist that were found to be identical under the same conditions. The vari-ation in the measurement process occurs, which may be caused by many factors, such as standards, work pieces, instruments, persons and procedures and environment [62]. The methods to estimate the uncertainty in measurement should be need rigorously. The ap-proach to uncertainty of fundamental concept of traceability described in [63], [64], [65] is highly encouraged and considered to be essential in the engineering experiments. As an example figure 2.1, considered here deliberately from outside our immediate context that shows a common path for a calibrated thermometer [1]. The other example is measurement of the surface profile using stylus instrument. The stylus instruments are commonly used for a measurement of topography by measuring the displacement of stylus as it traverses the surface [45].
Fundamental force concept in conventional metrology
Force is a derived unit in the SI, which means that primary standards of the force are derived from the fundamental definition of force by using three basic units kilogram (kg), mass (m), and second (s). One newton is defined as the force required to accelerate a mass of one kg at a rate of one meter-(sec)−2. 1kg is defined as the mass of primary kilogram, a platinum-iridium cylinder stored in Paris. The weight of a body is a gravitational force acting on a body and measured in kg as mass [66]. Conventionally, the force is measured by using strain gauges, load cells, resonance structured, electric balances, force transducers, piezoelectric crystal and pressure. For a known acceleration due to a gravity, the downward force generated by the earth field can be calculated. This is the basic principle that works behind the deadweight standards machines [67], [68].
NIST. The handling of such small masses becomes difficult and their relative uncertainties increases inversely proportional to the decrease in mass [69].
2.2.2 Low force traceability in metrology
[image:47.612.116.529.344.688.2]The low force measurement is becoming essential in the national metrology institutes (NMI). In order to meet the demand of traceable micro to nano-newton force, NMIs worldwide are working together to extend the range of traceable force measurement further down to the nano-Newton level [70], [71], [72], [29], [73], [74], [47] . These NMIs have developed their own small force facilities based own designs and operating principles. Each NMI has realised diverse paths of calibration for small force facilities for primary realisation and dissemination routes. A variety of artefacts and methods have been developed by them.
The small force standards are still in a nascent stage. First an informal study pi-lot comparison program was organized by the NMIs, who have small force facility and standards. The comparison study program among four NMIs, KRISS, NIST, NPL and PTB [75]. The primary realisation of a small force in the pilot study program is di-vided into two types: electrical force-based and mass-based methods. Both NPL and NIST facilities realise traceable forces based on electrostatic methods through electro-static balance principle and traceability is derived from international system of units SI (i.e. meter, capacitance & voltage, while KRISS and PTB primary standards are realised based on deadweight principles by using high-precision mass comparators. The calibration procedures employed by them are not standardised yet and deviate from those used in the macro-force metrology such as standardised procedure described in ISO 376 [76].
In this pilot study comparison programm, it was decided by consensus of the participants not to adhere to the existing macro-force protocols. They agreed that comparison would be performed for the measurement of spring constant and force sensitivity for each of a set of five piezoelectric cantilevers. The pilot study comparison programm was conducted among NMIs from February 2008 to February 2010. The results of calibration capability are in agreement, suggesting that their small force facility are equivalent within their reported uncertainties. The detail of the reported uncertainties may be seen [77]. It was concluded by the authors that for future comparison a more rigorous technical protocol should be developed and adopted.
2.3
Standards and capabilities for small force metrology
2.3.1 Low force measurement at NPL
The United Kingdom NPL, an internationally leading NMI, is playing active role to velop a facility for low force measurement. The low force balance was designed and de-veloped at NPL with the collaboration of University Warwick and Technical University Eindhoven (2002-2005) [84], [85]. At NPL, and commonly elsewhere, small-force metrology (nanometrology) is considered the retain of facilities that inform it are, therefore, tex-ture measuring instruments, such as NPL’s Nanosurf 4 (primary profile measuring instru-ment) [86], topography measuring instruments [49], the development of primary balance in 1930 [87], Newton thrust balance [88], nanoidentation instruments [89], micro-coordinate metrology probe based on a patented noncontact vibrating sensor [50], [90] novel comb drive for calibration of AFM cantilever [91] and micro-electromechanical device for lateral force calibration [3].
Low force Balance
The NPL has developed an instrument (figures 2.2 and 2.3) to provide force traceability in the micro to nano Newton range 1nN toµN. The low force balance(LFB) [48], [78] uses elec-trostatic forces, which tend to be small and so more easily controlled in this context. The NPL system, designed in collaboration with Eindhoven University of Technology, Nether-lands and University of Warwick, has superficial similarity to precision electronic balance. A dielectric plate is suspended between pairs of electrodes by a very soft linear translation flexure mechanism. This motion is measured by a traceable multi-path laser interferometer. The basic principle of low force balance is summarised by
F = 1
2V
2dc
dz
(2.1)
whereF is force exerted,V is the applied voltage and dcdz the rate of change of capacitance per unit distance in the direction of motion.
Figure 2.2: Schematic of NPL low force balance components: (1) platen and strut, (2) leaf spring, (3) parallelogram body, (4) dielectric, (5) capacitor plate, (6) spacer, (7) reference mirror, (8) moving mirror, (9) cantilever, (10) counterweight, and (11) laser beams
(from [84]).
Figure 2.3: Picture of NPL low force balance (from [2]).
2.3.2 Electrical Nanobalnce
A novel comb-drive device was developed at NPL to calibrate the AFM cantilever spring constant. One example, the nanobalance device is shown in figure 2.4 that requires it operation in vacuum [91]. A vertical asymmetric in the fields is produced in the pairs of comb device that levitates a landing stage against an internal electric field. The spring constant value traceable to SI unit is calculated from the measurement of the driving electric signal and resultant deflection. Then for end-users, the device becomes a passive, calibrated, elastic device without requiring any more connections or possible disturbance by interacting fields. The authors reported a value of landing stage centre-point spring constant, 0.195 Nm−1±0.01 Nm−1, that can provide calibration of AFM in the range 0.03Nm−1 to 1 Nm−1. The other example of a similar technique is seen at NPL, the Lateral Electrical Nanobalance (LEN) that was designed to measure the lateral forces such friction in AFM [3].
Figure 2.4: (Three-dimensional computer model of the electrical nanobalance device. The area shown is 980µm 560µm. Dimensions perpendicular to the plane have been expanded by a factor of 20 for clarity (from [3]).
2.3.3 Low force measurement at NIST
in the NIST small force laboratory is show in figures 2.5. The hierarchy in NIST for small force metrology is based on a combination of length, capacitance and voltage below than 10−5N [47]. The NIST has realised traceable force standards below 20µN (electrostatic force balance (EFB)) [47]. The EFB is derived from electrical units to provide force tracebility to the AFM and instrumented indentation [92]. A piezoresistive cantilever is calibrated by using EFB at NIST. This type of cantilever acts as a force transfer artefact when assessing the thermal calibration method by comparison [25].
Electrostatic force balance
The NIST has developed a electrostatic force balance after a series of design iterations [79], [80], [93], [94], [4].The current version is shown in the figure 2.6. The figure shows that electrostatic force balance has been assembled on an optical table, which is designed free standing vacuum chamber. The electric force balance is mounted on an optical table with three legs that are protrude from the chamber floor through flexible bellows that terminate in blank flanges. The electric force balance operates in the air, or with another inert gas and the vacuum chamber operation eliminates air currents that could perturb compliant suspension. Both index of refraction in the interferometer and die electric constant gap in the capacitance are eliminated by the operation of vacuum a chamber. The electric force balance consists of an electrostatic force generator that acts along a vertical z-axis (aligned with local gravity) [79].
Forces are produced when a voltage is applied to the pairs of nested coaxial cylinders. The high voltage cylinder is fixed and inner ground cylinder is free to translate along z-axis, which can vary the degree of overlap between the cylinders. The electric force F is generated along the vertical z-axis for a given applied voltage.
Fz = 1 2
dc
dz
V12−V22+ 2Vs(V1−V2)
(2.2)
whereFis force, dzdc is capacitance gradient,V1 is the voltage applied to the outer electrode
before loading,V2 is the voltage applied to the outer electrode after loading and Vs is the potential difference between the electrodes.
The source of uncertainty from the potential difference between electrodes is diminished by the procedure of reversing the direct voltage across the plates [93].
![Figure 2.1: A common traceability path(from [1])](https://thumb-us.123doks.com/thumbv2/123dok_us/9566369.460929/47.612.116.529.344.688/figure-a-common-traceability-path-from.webp)
![Figure 2.30: Experimental techniques for conducting mechanical tests in single cell andsingle molecule biomechanics (from [21]).](https://thumb-us.123doks.com/thumbv2/123dok_us/9566369.460929/87.612.168.481.77.296/figure-experimental-techniques-conducting-mechanical-andsingle-molecule-biomechanics.webp)
![Figure 2.32: Force extension curves obtained by stretching titin proteins show periodicfeatures that are consistent with their modular construction (from [23])](https://thumb-us.123doks.com/thumbv2/123dok_us/9566369.460929/88.612.236.422.74.311/figure-extension-obtained-stretching-proteins-periodicfeatures-consistent-construction.webp)