Proceedings of the 49th Annual Meeting of the Association for Computational Linguistics, pages 1027–1035,
Reordering Metrics for MT
Alexandra Birch Miles Osborne
[email protected] [email protected] University of Edinburgh
10 Crichton Street Edinburgh, EH8 9AB, UK
Abstract
One of the major challenges facing statistical machine translation is how to model differ-ences in word order between languages. Al-though a great deal of research has focussed on this problem, progress is hampered by the lack of reliable metrics. Most current metrics are based on matching lexical items in the translation and the reference, and their abil-ity to measure the qualabil-ity of word order has not been demonstrated. This paper presents a novel metric, the LRscore, which explic-itly measures the quality of word order by using permutation distance metrics. We show that the metric is more consistent with human judgements than other metrics, including the BLEUscore. We also show that the LRscore can successfully be used as the objective func-tion when training translafunc-tion model parame-ters. Training with the LRscore leads to output which is preferred by humans. Moreover, the translations incur no penalty in terms of BLEU scores.
1 Introduction
Research in machine translation has focused broadly on two main goals, improving word choice and im-proving word order in translation output. Current machine translation metrics rely upon indirect meth-ods for measuring the quality of the word order, and their ability to capture the quality of word order is poor (Birch et al., 2010).
There are currently two main approaches to eval-uating reordering. The first is exemplified by the BLEU score (Papineni et al., 2002), which counts
the number of matching n-grams between the refer-ence and the hypothesis. Word order is captured by the proportion of longer n-grams which match. This method does not consider the position of match-ing words, and only captures ordermatch-ing differences if there is an exact match between the words in the translation and the reference. Another approach is taken by two other commonly used metrics, ME-TEOR (Banerjee and Lavie, 2005) and TER (Snover et al., 2006). They both search for an alignment be-tween the translation and the reference, and from this they calculate a penalty based on the number of differences in order between the two sentences. When block moves are allowed the search space is very large, and matching stems and synonyms in-troduces errors. Importantly, none of these metrics capture the distance by which words are out of order. Also, they conflate reordering performance with the quality of the lexical items in the translation, making it difficult to tease apart the impact of changes. More sophisticated metrics, such as the RTE metric (Pad´o et al., 2009), use higher level syntactic or semantic analysis to determine the grammaticality of the out-put. These approaches require annotation and can be very slow to run. For most research, shallow metrics are more appropriate.
We introduce a novel shallow metric, the Lexical Reordering Score (LRscore), which explicitly mea-sures the quality of word order in machine trans-lations and interpolates it with a lexical metric. This results in a simple, decomposable metric which makes it easy for researchers to pinpoint the effect of their changes. In this paper we show that the LRscore is more consistent with human judgements
than other metrics for five out of eight different lan-guage pairs. We also apply the LRscore during Mini-mum Error Rate Training (MERT) to see whether in-formation on reordering allows the translation model to produce better reorderings. We show that hu-mans prefer the output of systems trained with the LRscore 52.5% as compared to 43.9% when train-ing with the BLEUscore. Furthermore, training with the LRscore does not result in lower BLEUscores.
The rest of the paper proceeds as follows. Sec-tion 2 describes the reordering and lexical metrics that are used and how they are combined. Section 3 presents the experiments on consistency with human judgements and describes how to train the language independent parameter of the LRscore. Section 4 re-ports the results of the experiments on MERT. Fi-nally we discuss related work and conclude.
2 The LRscore
In this section we present the LRscore which mea-sures reordering using permutation distance metrics. These reordering metrics have been demonstrated to correlate strongly with human judgements of word order quality (Birch et al., 2010). The LRscore com-bines the reordering metrics with lexical metrics to provide a complete metric for evaluating machine translations.
2.1 Reordering metrics
The relative ordering of words in the source and tar-get sentences is encoded in alignments. We can in-terpret alignments as permutations which allows us to apply research into metrics for ordered encodings to measuring and evaluating reorderings. We use dis-tance metrics over permutations to evaluate reorder-ing performance. Figure 1 shows three permutations. Each position represents a source word and each value indicates the relative positions of the aligned target words. In Figure 1 (a) represents the identity permutation, which would result from a monotone alignment, (b) represents a small reordering consist-ing of two words whose orders are inverted, and (c) represents a large reordering where the two halves of the sentence are inverted in the target.
A translation can potentially have many valid word orderings. However, we can be reasonably cer-tain that the ordering of the reference sentence must be acceptable. We therefore compare the ordering
(a) (1 2 3 4 5 6 7 8 9 10) (b) (1 2 3 4•6•5•7 8 9 10) (c) (6 7 8 9 10•1 2 3 4 5)
Figure 1. Three permutations: (a) monotone (b) with a small reordering and (b) with a large reordering. Bullet points highlight non-sequential neighbours.
of a translation with that of the reference sentence. Where multiple references exist, we select the clos-est, i.e. the one that gives the best score. The un-derlying assumption is that most reasonable word orderings should be fairly similar to the reference, which is a necessary assumption for all automatic machine translation metrics.
Permutations encode one-one relations, whereas alignments contain null alignments and one-many, many-one and many-many relations. We make some simplifying assumptions to allow us to work with permutations. Source words aligned to null are as-signed the target word position immediately after the target word position of the previous source word. Where multiple source words are aligned to the same target word or phrase, a many-to-one relation, the target ordering is assumed to be monotone. When one source word is aligned to multiple target words, a one-to-many relation, the source word is assumed to be aligned to the first target word. These simplifi-cations are chosen so as to reduce the alignment to a bijective relationship without introducing any extra-neous reorderings, i.e. they encode a basic monotone ordering assumption.
We choose permutation distance metrics which are sensitive to the number of words that are out of order, as humans are assumed to be sensitive to the number of words that are out of order in a sen-tence. The two permutations we refer to, π andσ, are the reference permutation and the source-translation permutation. The metrics are normalised so that 0 means that the permutations are completely inverted, and 1 means that they are identical. We re-port these scores as percentages.
2.1.1 Hamming Distance
The Hamming distance (Hamming, 1950) mea-sures the number of disagreements between two per-mutations. It is defined as follows:
dh(π, σ) = 1−
Pn
i=1xi
n , xi=
Eg. BLEU METEOR TER dh dk
[image:3.612.75.304.353.449.2](a) 100.0 100.0 100.0 100.0 100.0 (b) 61.8 86.9 90.0 80.0 85.1 (c) 81.3 92.6 90.0 0.0 25.5
Table 1.Metric scores for examples in Figure 1 which are calculated by comparing the permutations to the identity. All metrics are adjusted so that 100 is the best score and 0 the worst.
where n is the length of the permutation. The Hamming distance is the simplest permutation dis-tance metric and is useful as a baseline. It has no concept of the relative ordering of words.
2.1.2 Kendall’s Tau Distance
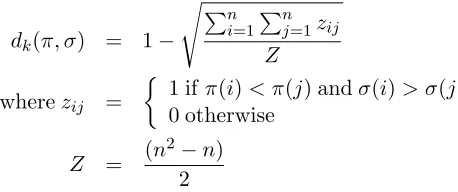
Kendall’s tau distance is the minimum number of transpositions of twoadjacentsymbols necessary to transform one permutation into another (Kendall, 1938). It represents the percentage of pairs of ele-ments which share the same order between two per-mutations. It is defined as follows:
dk(π, σ) = 1−
s Pn
i=1
Pn j=1zij
Z
wherezij =
1 ifπ(i)< π(j) andσ(i)> σ(j) 0 otherwise
Z = (n 2−n)
2
Kendalls tau seems particularly appropriate for measuring word order differences as the relative or-dering words is taken into account. However, most human and machine ordering differences are much closer to monotone than to inverted. The range of values of Kendall’s tau is therefore too narrow and close to 1. For this reason we take the square root of the standard metric. This adjusted dk is also
more correlated with human judgements of reorder-ing quality (Birch et al., 2010).
We use the example in Figure 1 to highlight the problem with current MT metrics, and to demon-strate how the permutation distance metrics are cal-culated. In Table 1 we present the metric results for the example permutations. The metrics are calcu-lated by comparing the permutation string with the monotone permutation. (a) receives the best score for all metrics as it is compared to itself. BLEU
and METEOR fail to recognise that (b) represents a small reordering and (c) a large reordering and they
assign a lower score to (b). The reason for this is that they are sensitive to breaks in order, but not to the actual word order differences. BLEU matches more n-grams for (c) and consequently assigns it a higher score. METEOR counts the number of blocks that the translation is broken into, in order to align it with the source. (b) is aligned using four blocks, whereas (c) is aligned using only two blocks. TER counts the number of edits, allowing for block shifts, and ap-plies one block shift for each example, resulting in an equal score for (b) and (c). Both the Hamming distancedh and the Kendall’s tau distance dk
cor-rectly assign (c) a worse score than (b). Note that for (c), the Hamming distance was not able to re-ward the permutation for the correct relative order-ing of words within the two large blocks and gave (c) a score of 0, whereas Kendall’s tau takes relative ordering into account.
Wong and Kit (2009) also suggest a metric which combines a word choice and a word order compo-nent. They propose a type of F-measure which uses a matching function M to calculate precision and recall.M combines the number of matched words, weighted by theirtfidf importance, with their posi-tion difference score, and finally subtracting a score for unmatched words. Including unmatched words in theM function undermines the interpretation of the supposed F-measure. The reordering component is the average difference of absolute and relative word positions which has no clear meaning. This score is not intuitive or easily decomposable and it is more similar to METEOR, with synonym and stem functionality mixed with a reordering penalty, than to our metric.
2.2 Combined Metric
The LRscore consists of a reordering distance met-ric which is linearly interpolated with a lexical score to form a complete machine translation evaluation metric. The metric is decomposable because the in-dividual lexical and reordering components can be looked at individually. The following formula de-scribes how to calculate the LRscore:
LRscore=αR+ (1−α)L (1)
The metric contains only one parameter,α, which balances the contribution of the reordering metric,
the lexical metric.Ris the average permutation dis-tance metric adjusted by the brevity penalty and it is calculated as follows:
R=
P
s∈SdsBPs
|S| (2)
WhereSis a set of test sentences,dsis the
reorder-ing distance for a sentence and BP is the brevity penalty.
The brevity penalty is calculated as:
BP =
1 ift > r
e1−r/t ift≤r (3)
wheretis the length of the translation, andris the closest reference length. If the reference sentence is slightly longer than the translation, then the brevity penalty will be a fraction somewhat smaller than 1. This has the effect of penalising translations that are shorter than the reference. The brevity penalty within the reordering component is necessary as the distance-based metric would provide the same score for a one word translation as it would for a longer monotone translation.Ris combined with a system level lexical score.
In this paper we apply the BLEUscore as the lex-ical metric, as it is well known and it measures lexi-cal precision at different n-gram lengths. We experi-ment with the full BLEUscore and the 1-gram BLEU
score, BLEU1, which is purely a measure of the pre-cision of the word choice. The 4-gram BLEU score
includes some measure of the local reordering suc-cess in the precision of the longer n-grams. BLEU
is an important baseline, and improving on it by in-cluding more reordering information is an interest-ing result. The lexical component of the system can be any meaningful metric for a particular target lan-guage. If a researcher was interested in morpholog-ically rich languages, for example, METEOR could be used. We use the LRscore to return sentence level scores as well system level scores, and when doing so the smoothed BLEU(Lin and Och, 2004) is used.
3 Consistency with Human Judgements
Automatic metrics must be validated by compar-ing their scores with human judgements. We train the metric parameter to optimise consistency with human preference judgements across different lan-guage pairs and then we show that the LRscore is
more consistent with humans than other commonly used metrics.
3.1 Experimental Design
Human judgement of rank has been chosen as the of-ficial determinant of translation quality for the 2009 Workshop on Machine Translation (Callison-Burch et al., 2009). We used human ranking data from this workshop to evaluate the LRscore. This consisted of German, French, Spanish and Czech translation systems that were run both into and out of English. In total there were 52,265 pairwise rank judgements collected.
Our reordering metric relies upon word align-ments that are generated between the source and the reference sentences, and the source and the trans-lated sentences. In an ideal scenario, the transla-tion system outputs the alignments and the refer-ence set can be selected to have gold standard hu-man alignments. However, the data that we use to evaluate metrics does not have any gold standard alignments and we must train automatic alignment models to generate them. We used version two of the Berkeley alignment model (Liang et al., 2006), with the posterior threshold set at 0.5. Our Spanish-, French- and German-English alignment models are trained using Europarl version 5 (Koehn, 2005). The Czech-English alignment model is trained on sec-tions 0-2 of the Czech-English Parallel Corpus, ver-sion 0.9 (Bojar and Zabokrtsky, 2009).
The metric scores are calculated for the test set from the 2009 workshop on machine translation. It consists of 2525 sentences in English, French, Ger-man, Spanish and Czech. These sentences have been translated by different machine translation systems and the output submitted to the workshop. The sys-tem output along with human evaluations can be downloaded from the web1.
The BLEUscore has five parameters, one for each
n-gram, and one for the brevity penalty. These pa-rameters are set to a default uniform value of one. METEOR has 3 parameters which have been trained for human judgements of rank (Lavie and Agarwal, 2008). METEOR version 0.7 was used. The other baseline metric used was TER version 0.7.25. We adapt TER by subtracting it from one, so that all
1
metric increases mean an improvement in the trans-lation. The TER metric has five parameters which have not been trained.
Using rank judgements, we do not have absolute scores and so we cannot compare translations across different sentences and extract correlation statistics. We therefore use the method adopted in the 2009 workshop on machine translation (Callison-Burch et al., 2009). We ascertained how consistent the auto-matic metrics were with the human judgements by calculating consistency in the following manner. We take each pairwise comparison of translation output for single sentences by a particular judge, and we recorded whether or not the metrics were consistent with the human rank. I.e. we counted cases where both the metric and the human judge agreed that one system is better than another. We divided this by the total number of pairwise comparisons to get a per-centage. We excluded pairs which the human anno-tators ranked as ties.
de-en es-en fr-en cz-en
dk 73.9 80.5 80.4 81.1
Table 2. The average Kendall’s tau reordering distance between the test and reference sentences. 100 means monotone thus de-en has the most reordering.
We present a novel method for setting the LRscore parameter. Using multiple language pairs, we train the parameter according to the amount of reordering seen in each test set. The advantage of this approach is that researchers do not need to train the parameter for new language pairs or test do-mains. They can simply calculate the amount of re-ordering in the test set and adjust the parameter ac-cordingly. The amount of reordering is calculated as the Kendall’s tau distance between the source and the reference sentences as compared to dummy monotone sentences. The amount of reordering for the test sentences is reported in Table 2. German-English shows more reordering than other language pairs as it has a lowerdkscore of 73.9. The language
independent parameter (θ) is adjusted by applying the reordering amount (dk) as an exponent. θis
al-lowed to takes values of between 0 and 1. This works in a similar way to the brevity penalty. With more re-ordering, thedk becomes smaller which leads to an
increase in the final value ofα.αrepresents the per-centage contribution of the reordering component in
the LRscore:
α=θdk (4)
The language independent parameterθis trained once, over multiple language pairs. This procedure optimises the average of the consistency results across the different language pairs. We use greedy hillclimbing in order to find the optimal setting. As hillclimbing can end up in a local minima, we per-form 20 random restarts, and retaining only the pa-rameter value with the best consistency result.
3.2 Results
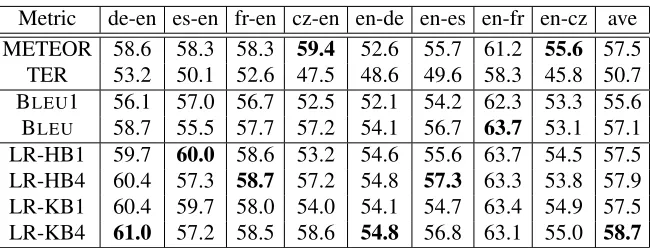
Table 3 reports the optimal consistency of the LRscore and baseline metrics with human judge-ments for each language pair. The LRscore vari-ations are named as follows: LR refers to the LRscore, “H” refers to the Hamming distance and “K” to Kendall’s tau distance. “B1” and “B4” refer to the smoothed BLEU score with the 1-gram and the complete scores. Table 3 shows that the LRscore is more consistent with human judgement for 5 out of the 8 language pairs. This is an important result which shows that combining lexical and reordering information makes for a stronger metric than the baseline metrics which do not have a strong reorder-ing component.
METEOR is the most consistent for the Czech-English and Czech-English-Czech language pairs, which have the least amount of reordering. METEOR lags behind for the language pairs with the most reorder-ing, the German-English and English-German pairs. Here LR-KB4 is the best metric, which shows that metrics which are sensitive to the distance words are out of order are more appropriate for situations with a reasonable amount of reordering.
4 Optimising Translation Models
Metric de-en es-en fr-en cz-en en-de en-es en-fr en-cz ave METEOR 58.6 58.3 58.3 59.4 52.6 55.7 61.2 55.6 57.5
TER 53.2 50.1 52.6 47.5 48.6 49.6 58.3 45.8 50.7 BLEU1 56.1 57.0 56.7 52.5 52.1 54.2 62.3 53.3 55.6 BLEU 58.7 55.5 57.7 57.2 54.1 56.7 63.7 53.1 57.1
[image:6.612.145.470.69.193.2]LR-HB1 59.7 60.0 58.6 53.2 54.6 55.6 63.7 54.5 57.5 LR-HB4 60.4 57.3 58.7 57.2 54.8 57.3 63.3 53.8 57.9 LR-KB1 60.4 59.7 58.0 54.0 54.1 54.7 63.4 54.9 57.5 LR-KB4 61.0 57.2 58.5 58.6 54.8 56.8 63.1 55.0 58.7
Table 3.The percentage consistency between human judgements of rank and metrics. The LRscore variations (LR-*) are optimised for average consistency across language pair (shown in right hand column). The bold numbers represent the best consistency score per language pair.
the metric rewards, but will be blind to aspects of translation quality that are not directly captured by the metric. We apply the LRscore in order to im-prove the reordering performance of a phrase-based translation model.
4.1 Experimental Design
We hypothesise that the LRscore is a good metric for training translation models. We test this by eval-uating the output of the models, first with automatic metrics, and then by using human evaluation. We choose to run the experiment with Chinese-English as this language pair has a large amount of medium and long distance reorderings.
4.1.1 Training Setup
The experiments are carried out with Chinese-English data from GALE. We use the official test set of the 2006 NIST evaluation (1994 sentences). For the development test set, we used the evalu-ation set from the GALE 2008 evaluevalu-ation (2010 sentences). Both development set and test set have four references. The phrase table was built from 1.727M parallel sentences from the GALE Y2 train-ing data. The phrase-based translation model called MOSES was used, with all the default settings. We extracted phrases as in (Koehn et al., 2003) by run-ning GIZA++ in both directions and merging align-ments with the grow-diag-final heuristic. We used the Moses translation toolkit, including a lexicalised reordering model. The SRILM language modelling toolkit (Stolcke, 2002) was used with interpolated Kneser-Ney discounting. There are three separate 3-gram language models trained on the English side of parallel corpus, the AFP part of the Gigaword corpus, and the Xinhua part of the Gigaword
cor-LR-HB1 LR-HB4 LR-KB1 LR-KB4 26.40 07.19 43.33 26.23
Table 4.The parameter setting representing the % impact of the reordering component for the different versions of the LRscore metric.
pus. A 4 or 5-gram language model would have led to higher scores for all objective functions, but would not have changed the findings in this paper. We used the MERT code available in the MOSES repository (Bertoldi et al., 2009).
The reordering metrics require alignments which were created using the Berkeley word alignment package version 1.1 (Liang et al., 2006), with the posterior probability to being 0.5.
We first extracted the LRscore Kendall’s tau dis-tance from the monotone for the Chinese-English test set and this value was 66.1%. This is far more re-ordering than the other language pairs shown in Ta-ble 2. We then calculated the optimal parameter set-ting, using the reordering amount as a power expo-nent. Table 4 shows the parameter settings we used in the following experiments. The optimal amount of reordering for LR-HB4 is low, but the results show it still makes an important contribution.
4.1.2 Human Evaluation Setup
Turk and we improve annotation quality by collect-ing multiple judgements, and eliminatcollect-ing workers who do not achieve a certain level of performance on gold standard questions.
We randomly selected a subset of sentences from the test set. We use 60 sentences each for compar-ing traincompar-ing with BLEU to training with LR-HB4 and with LR-KB4. These sentences were between 15 and 30 words long. Shorter sentences tend to have uninteresting differences, and longer sentences may have many conflicting differences.
Workers were presented with a reference sen-tence and two translations which were randomly ordered. They were told to compare the transla-tions and select their preferred translation or “Don’t Know”. Workers were screened to guarantee reason-able judgement quality. 20 sentence pairs were ran-domly selected from the 120 test units and anno-tated as gold standard questions. Workers who got less than 60% of these gold questions correct were disqualified and their judgements discarded.
After disagreeing with a gold annotation, a worker is presented with the gold answer and an expla-nation. This guides the worker on how to perform the task and motivates them to be more accurate. We used the Crowdflower2 interface to Mechanical Turk, which implements the gold functionality.
Even though experts can disagree on preference judgements, gold standard labels are necessary to weed out the poor standard workers. There were 21 trusted workers who achieved an average accuracy of 91% on the gold. There were 96 untrusted work-ers who averaged 29% accuracy on the gold. Their judgements were discarded. Three judgements were collected from the trusted workers for each of the 120 test sentences.
4.2 Results
4.2.1 Automatic Evaluation of MERT
In this experiment we demonstrate that the re-ordering metrics can be used as learning criterion in minimum error rate training to improve parameter estimation for machine translation.
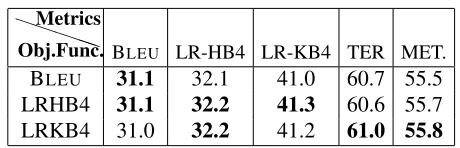
Table 5 reports the average of three runs of MERT training with different objective functions. The lexi-cal metric BLEUis used as an objective function in
2
http://www.crowdflower.com
Metrics P
P PP
P
[image:7.612.311.541.68.142.2]Obj.Func.BLEU LR-HB4 LR-KB4 TER MET. BLEU 31.1 32.1 41.0 60.7 55.5 LRHB4 31.1 32.2 41.3 60.6 55.7 LRKB4 31.0 32.2 41.2 61.0 55.8
Table 5.Average results of three different MERT runs for different objective functions.
isolation, and also as part of the LRscore together with the Hamming distance and Kendall’s tau dis-tance. We test with these metrics, and we also report the TER and METEOR scores for comparison.
The first thing we note in Table 5 is that we would expect the highest scores when training with the same metric as that used for evaluation as MERT maximises the objective function on the develop-ment data set. Here, however, when testing with BLEU, we see that training with BLEU and with
LR-HB4 leads to equally high BLEU scores. The reordering component is more discerning than the BLEUscore. It reliably increases as the word order
approaches that of the reference, whereas BLEUcan reports the same score for a large number of different alternatives. This might make the reordering metric easier to optimise, leading to the joint best scores at test time. This is an important result, as it shows that by training with the LRscore objective function, BLEUscores do not decrease, which is desirable as BLEUscores are usually reported in the field.
The LRscore also results in better scores when evaluated with itself and the other two baseline met-rics, TER and METEOR. Reordering and the lexi-cal metrics are orthogonal information sources, and this shows that combining them results in better per-forming systems. BLEU has shown to be a strong baseline metric to use as an objective function (Cer et al., 2010), and so the LRscore performance in Ta-ble 5 is a good result.
Type Sentence
Reference silicon valley is still a rich area in the united states. the average salary in the area was us $62,400 a year, which was 64% higher than the american average.
LR-KB4 silicon valley is still an affluent area of the united states, the regional labor with an average annual salary of 6.24 million us dollars, higher than the average level of 60 per cent. BLEU silicon valley is still in the united states in the region in an affluent area of the workforce,
the average annual salary of 6.24 million us dollars, higher than the average level of 60 per cent
Table 7.A reference sentence is compared with output from models trained with BLEUand with the LR-KB4 lrscore.
Prefer LR Prefer BLEU Don’t Know
LR-KB4 96 79 5
LR-HB4 93 79 8
Total 189 (52.5%) 158 (43.9%) 13
Table 6.The number of the times human judges preferred the output of systems trained either with the LRscore or with the BLEUscore, or were unable to choose.
4.2.2 Human Evaluation
We collect human preference judgements for out-put from systems trained using the BLEUscore and
the LRscore in order to determine whether training with the LRscore leads to genuine improvements in translation quality. Table 6 shows the number of the times humans preferred the LRscore or the BLEU
score output, or when they did not know. We can see that humans have a greater preference for the out-put for systems trained with the LRscore, which is preferred 52.5% of the time, compared to the BLEU
score, which was only preferred 43.9% of the time. The sign test can be used to determine whether this difference is significant. Our null hypothesis is that the probability of a human preferring the LRscore trained output is the same as that of prefer-ring the BLEU trained output. The one-tailed alter-native hypothesis is that humans prefer the LRscore output. If the null hypothesis is true, then there is only a probability of 0.048 that 189 out of 347 (189 + 158)people will select the LRscore output. We therefore discard the null hypothesis and the hu-man preference for the output of the LRscore trained system is significant to the 95% level.
In order to judge how reliable our judgements are we calculate the inter-annotator agreement. This is given by the Kappa coefficient (K), which balances agreement with expected agreement. The Kappa co-efficient is 0.464 which is considered to be a moder-ate level of agreement.
In analysis of the results, we found that output
from the system trained with the LRscore tend to produce sentences with better structure. In Table 7 we see a typical example. The word order of the sentence trained with BLEU is mangled, whereas the LR-KB4 model outputs a clear translation which more closely matches the reference. It also garners higher reordering and BLEUscores.
We expect that more substantial gains can be made in the future by using models which have more powerful reordering capabilities. A richer set of re-ordering features, and a model capable of longer distance reordering would better leverage metrics which reward good word orderings.
5 Conclusion
References
Satanjeev Banerjee and Alon Lavie. 2005. Meteor: An automatic metric for MT evaluation with improved correlation with human judgments. InWorkshop on Intrinsic and Extrinsic Evaluation Measures for MT and/or Summarization.
Nicola Bertoldi, Barry Haddow, and Jean-Baptiste Fouet. 2009. Improved Minimum Error Rate Training in Moses. The Prague Bulletin of Mathematical Linguis-tics, 91:7–16.
Alexandra Birch, Phil Blunsom, and Miles Osborne. 2010. Metrics for MT Evaluation: Evaluating Re-ordering. Machine Translation, 24(1):15–26.
Ondrej Bojar and Zdenek Zabokrtsky. 2009. CzEng0.9: Large Parallel Treebank with Rich Annotation.
Prague Bulletin of Mathematical Linguistics, 92:63– 84.
Chris Callison-Burch, Philipp Koehn, Christof Monz, and Josh Schroeder. 2009. Findings of the 2009 Workshop on Statistical Machine Translation. InProceedings of the Fourth Workshop on Statistical Machine Transla-tion, pages 1–28, Athens, Greece, March. Association for Computational Linguistics.
Chris Callison-Burch. 2009. Fast, cheap, and cre-ative: evaluating translation quality using Amazon’s Mechanical Turk. InProceedings of the 2009 Confer-ence on Empirical Methods in Natural Language Pro-cessing, pages 286–295, Singapore, August. Associa-tion for ComputaAssocia-tional Linguistics.
Daniel Cer, Christopher D. Manning, and Daniel Juraf-sky. 2010. The best lexical metric for phrase-based statistical MT system optimization. In Human Lan-guage Technologies: The 2010 Annual Conference of the North American Chapter of the Association for Computational Linguistics, pages 555–563, Los An-geles, California, June.
Richard Hamming. 1950. Error detecting and er-ror correcting codes. Bell System Technical Journal, 26(2):147–160.
Maurice Kendall. 1938. A new measure of rank correla-tion. Biometrika, 30:81–89.
A. Kittur, E. H. Chi, and B. Suh. 2008. Crowdsourcing user studies with Mechanical Turk. InProceeding of the twenty-sixth annual SIGCHI conference on Human factors in computing systems, pages 453–456. ACM. Philipp Koehn, Franz Och, and Daniel Marcu. 2003.
Sta-tistical Phrase-Based translation. In Proceedings of the Human Language Technology and North Ameri-can Association for Computational Linguistics Con-ference, pages 127–133, Edmonton, Canada. Associ-ation for ComputAssoci-ational Linguistics.
Philipp Koehn. 2005. Europarl: A parallel corpus for statistical machine translation. InProceedings of MT-Summit.
Alon Lavie and Abhaya Agarwal. 2008. Meteor, m-BLEU and m-TER: Evaluation metrics for high-correlation with human rankings of machine transla-tion output. InProceedings of the Workshop on Sta-tistical Machine Translation at the Meeting of the As-sociation for Computational Linguistics (ACL-2008), pages 115–118.
Percy Liang, Ben Taskar, and Dan Klein. 2006. Align-ment by agreeAlign-ment. In Proceedings of the Human Language Technology Conference of the NAACL, Main Conference, pages 104–111, New York City, USA, June. Association for Computational Linguistics. Chin-Yew Lin and Franz Och. 2004. ORANGE: a
method for evaluating automatic evaluation metrics for machine translation. InProceedings of the Conference on Computational Linguistics, pages 501–507. Franz J. Och. 2003. Minimum error rate training in
sta-tistical machine translation. InProceedings of the As-sociation for Computational Linguistics, pages 160– 167, Sapporo, Japan.
Sebastian Pad´o, Daniel Cer, Michel Galley, Dan Jurafsky, and Christopher D. Manning. 2009. Measuring ma-chine translation quality as semantic equivalence: A metric based on entailment features. Machine Trans-lation, pages 181–193.
Kishore Papineni, Salim Roukos, Todd Ward, and Wei-Jing Zhu. 2002. BLEU: a method for automatic evalu-ation of machine translevalu-ation. InProceedings of the As-sociation for Computational Linguistics, pages 311– 318, Philadelphia, USA.
Matthew Snover, Bonnie Dorr, R. Schwartz, L. Micciulla, and J. Makhoul. 2006. A study of translation edit rate with targeted human annotation. InProceedings of Association for Machine Translation in the Ameri-cas, pages 223–231.
Rion Snow, Brendan O’Connor, Daniel Jurafsky, and Andrew Y. Ng. 2008. Cheap and fast—but is it good?: Evaluating non-expert annotations for natural language tasks. InProceedings of the Conference on Empirical Methods in Natural Language Processing, pages 254–263. Association for Computational Lin-guistics.
Andreas Stolcke. 2002. SRILM - an extensible language modeling toolkit. InProceedings of Spoken Language Processing, pages 901–904.