Munich Personal RePEc Archive
When measure matters: coresident
sample selection bias in estimating
intergenerational mobility in developing
countries
Emran, M. Shahe and Greene, William H and Shilpi, Forhad
30 July 2015
When measure matters: coresident sample selection bias in estimating
intergenerational mobility in developing countries
M. Shahe Emran1 IPD, Columbia University
William Greene New York University
Forhad Shilpi DECRG, World Bank
July 30, 2015
ABSTRACT
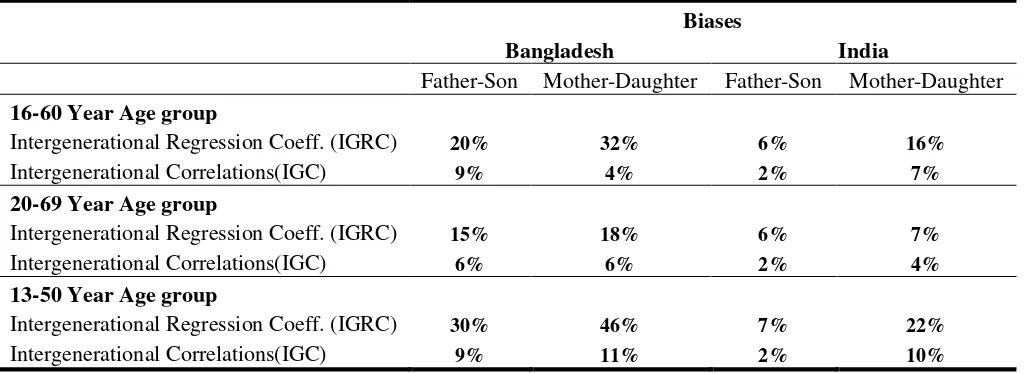
Potential biases from coresident sample selection have been a major stumbling block for research on intergenerational mobility in developing countries. We use two rich data sets from Bangladesh and India to provide evidence on the extent of coresidency bias in standard measures of intergenerational mobility: intergenerational regression coefficient (IGRC) and intergenerational correlation (IGC). Estimates for parents-children, father-son, and mother-daughter persistence in schooling show that the IGRC estimates are severely biased downward (average 30 percent). In contrast, the bias in IGC estimates is much lower (average less than 10 percent, in many cases less than 5 percent). Truncation due to coresidency criterion in a survey biases the IGRC estimate downward, but it also bi-ases upward the estimate of the ratio of the standard deviations of parental to children’s schooling. The IGC estimate suffers from lower bias because the upward bias in the esti-mate of the ratio of standard deviations partly cancels out the downward bias in the IGRC estimate. The evidence suggests that the available household surveys in developing coun-tries can be fruitfully used to understand intergenerational mobility if one focuses on IGC. The findings have important implications for cross-country comparison of intergenerational economic mobility.
Key Words: Coresidency, Sample Selection Bias, Intergenerational Mobility, Intergen-erational Regression Coefficient (IGRC), IntergenIntergen-erational Correlation (IGC), Bangladesh, India
JEL Codes: O12, J62
1
1. Introduction
There is a large and growing literature in economics on intergenerational persistence
in socio-economic status with a long and distinguished pedigree (see Becker and Tomes
(1979), Solon (1999), Arrow et al. (2000), World Development Report (2006), Black and
Devereux (2011), Corak (2013), Bjorklund and Salvanes (2011)). The focus on
intergen-erational mobility has, however, become much sharper over the last few decades, with a
heightened concerns about widening inequality despite significant growth and poverty
re-duction in many developed and developing countries (World Development Report (2006),
The Economist (2012)). But intergenerational economic persistence in developing countries
remains largely an under-researched area. An important constraint faced by a researcher
interested in intergenerational economic mobility in developing countries is the data
limi-tations. Although there are good quality household surveys available for almost all of the
developing countries now, the data may not be suitable for understanding intergenerational
persistence in income, education, and occupation.2
A major issue that has plagued progress in this research agenda is that the standard
household surveys suffer from sample selection, because coresidency is used as a criterion
to define the household membership. Thus a standard household survey such as the Living
Standard Measurement Survey (LSMS) done by the World Bank usually include only the
coresident parents and children. Some of the children of the household head may not be part
of the household at the time of the survey because they have left for higher eduction and
job, or because of marriage and household partition. Since the pattern of coresidence is not
random, but determined by economic and cultural factors, most of the studies suffer from
2
potentially serious sample selection bias when estimating intergenerational persistence in
economic status in developing countries. This has discouraged research on intergenerational
economic mobility in developing countries, even though there is a broad consensus that
inequality and economic mobility are central policy issues in most of these countries (World
Bank (2014), World Development Report (2006), The Economist (2012)).3
Although potential bias from coresidency restriction has been a major stumbling block,
curiously, there is no evidence on the magnitude of the coresidency bias in the standard
measures of intergenerational persistence in developing countries. Are the estimates from
the coresident sample biased to such an extent that they are not at all useful for
under-standing economic mobility? Are the different measures of intergenerational persistence
affected by coresidence bias to the same degree, or are some of the measures more robust
and can be relied upon to understand the persistence in economic status with relatively
small error (and little worry)? To the best of our knowledge, there is no analysis of these
interrelated questions in the existing literature. This paper provides a first analysis of these
questions using rich data sets from Bangladesh and India.
To understand the implications of coresident sample selection bias, it is necessary to
find surveys that include the children and parents irrespective of their residency status. We
also need to identify the subset of individuals coresident in a household at the time of the
survey. The full sample allows us to estimate measures of intergenerational persistence free
of coresidency bias, and then compare the unbiased estimates with the estimates from the
3
coresident sample. We take advantage of two high quality household surveys of villages in
India and Bangladesh, and estimate two most widely used measures of intergenerational
persistence in the literature: intergenerational regression coefficient (henceforth IGRC) and
intergenerational correlation (henceforth IGC). Since reliable income data are not available
for long enough time period, we focus on intergenerational educational mobility, using
years of schooling as the relevant indicator of economic status.4
This is motivated partly
by the recent research on intergenerational economic mobility in developing countries which
has concentrated largely on estimating educational persistence across generations (see, for
example, Lillard and Willis (1995), Binder and Woodruff (2002), Hertz et . al. (2007),
Behrman et al. (2001), Azam and Bhatt (2012), Jalan and Murgai (2008), Maitra and
Sharma (2010), Emran and Shilpi (2015)).5
The evidence presented below in this paper shows that IGRC (i.e., intergenerational
regression coefficient), the most widely used measure of intergenerational persistence, suffers
from significant coresidency bias; the estimates from coresident samples are consistently
smaller than those from the full samples. In contrast, the bias in the estimated IGC
(i.e., intergenerational correlation) in coresident samples is much smaller; in many cases,
less than one third of the bias in the corresponding IGRC estimate. In the sample of
household head’s children, the average bias in IGRC estimates is 29.7 percent in the case
of Bangladesh, while the corresponding bias in IGC estimates is only 8.7 percent. The
4
An extensive literature in the context of USA shows that data on income for more than a decade at appropriate stages of the life cycle are required to estimate the intergenerational persistence in income. See, for example, Solon (1992), Mazumder (2005). For an excellent discussion on education as a measure of socio-economic status and its relation to intergenerational income persistence, see Hertz et al. (2007). For a recent analysis that combines parents’ education and occupation as a broader measure of economic status in the absence of required income data, see Emran and Sun (2014).
5
extent of coresdient sample selection bias in India is smaller because of higher coresdiency
rates observed in the data. However, the IGRC estimates in India are also substantially
biased downward ; the average bias is 17.6 percent in the IGRC estimates. Again, the
corresponding bias in the IGC estimates is much smaller at 10.4 percent.
We put forth an explanation for the empirical findings that the IGC estimates suffer
from significantly less coresidency bias when compared to that in the IGRC estimates.
The intuition derives from the fact that IGRC (denoted as β) and IGC (denoted as ρ) are
related in a simple way: ρ = β
(
σp σc
)
, i.e, we can get the IGC estimate by multiplying
the IGRC estimate with the ratio of standard deviation of parent’s schooling to that of
children’s schooling. Coresidency restriction in the standard household surveys results in
a truncated sample, as the surveys do not gather any information on the family members
who do not satisfy the coresidency criterion. It is well-known that truncation biases the
estimate of β in an OLS regression (Hausman and Wise (1977)). An equally important
implication of truncation in our context is that it also affects the estimate of the ratio of
standard deviations in schooling of parents to children. The IGC estimate cancels out part
of the downward bias in IGRC by multiplying it with an upward biased estimate of the
ratio of standard deviation of parental schooling to that of children’s schooling.
The findings in this paper have important and wide ranging implications for the research
on inequality and economic mobility in developing countries. First, the evidence reported
here implies that much progress in understanding intergenerational mobility (and thus the
nature of inequality) can be made with the household surveys currently available in many
developing countries even though they suffer from coresidency restrictions. These data sets
are currently shun by most of the researchers because of the worry that the estimates from
the coresident sample may be misleading.6
The evidence reported in this paper shows that
6
the coresident sample bias is small, often ignorable, if one focuses on IGC rather than IGRC
as the measure of persistence. Second, the results in this paper can be helpful in sorting
out often conflicting evidence on intergenerational mobility in developing countries in the
existing literature where conclusions differ depending on whether one uses IGRC or IGC
as the measure. Our analysis suggests that one should focus on the IGC estimates in such
instances. Third, our results have important implications for cross-country comparison of
economic mobility. The extent of sample selection due to coresidency restriction is likely to
vary across countries significantly, and as a result, the ranking according to IGRC estimates
are more likely to be incorrect when making cross-country comparisons of intergenerational
mobility.7
The rest of the paper is organized as follows. Section 2 provides a brief discussion
on the related literature, especially focusing on developing countries, and thus puts the
contribution of this paper in perspective. The next section (section 3) discusses the data
sources and variables used in the analysis. Section (4) reports the estimate of IGRC and
IGC in educational attainment for Bangladesh and India data, both for the full and the
coresident samples. The next section (section (5)) provides an explanation for the findings
that the coresident sample bias in the IGC estimates is small, often ignorable, especially
when compared to the bias in the IGRC estimates. The paper concludes with a summary of
the results and their implications for the emerging literature on intergenerational mobility
in developing countries.
that the estimates from coresident samples are so biased as to be of little credibility. 7
2. Related Literature
The literature on intergenerational economic mobility in developed countries is vast,
but the corresponding literature on developing countries is limited at best. The economics
literature on intergenerational mobility in developed countries has focused on
intergenera-tional income correlations, with an especial emphasis on the link between fathers and sons
(see, for example, Solon (1992, 1999), Mazumder (2005), Blanden et al. (2005), Corak and
Heisz (1999), Bowles et al. (2005), Black et al. (2005)). The relative neglect of research
on developing countries is evident from the fact that, in his survey for the Handbook of
Labor Economics, Solon (1999) cites only two papers: Lam and Schoeni (1993) on Brazil,
and Lillard and Kilburn (1995) on Malaysia. Pranab Bardhan, the editor of Journal of
Development Economics for almost two decades (1985-2003), identified intergenerational
mobility as one of the underdeveloped research areas in development economics (Bardhan
(2005)).
The research on intergenerational economic persistence in developing countries has been
constrained primarily by two types of data limitations. First, the income data on parents
and children are not available for more than a few years to allow reliable estimation of
permanent income across generations. As shown by a substantial body of literature on
developed countries, it is necessary to have good quality income data over a period of
more than a decade to address the attenuation bias in the estimate of income persistence
(Solon (1992), Mazumder (2005)). The household surveys available in developing countries
usually provide income information only for a single year, and estimating individual income
may be a daunting task in rural areas where self employment, work sharing, and informal
activities predominate (Deaton (1997)). The second challenge which constitutes the focus
selection due to coresidency used to define household membership. As noted before, this
has been a strong discouraging factor for researchers worried about rejection by their peers,
journal referees and the editors.
The recent economics research on intergenerational economic mobility in developing
countries includes Behrman et. al. (2001), Hertz et al. (2007), Binder and Woodruff
(2002), Thomas (1996), Lillard and Willis (1995), Lam and Schoeni (1993), Daude (2011),
Asadullah (2012), Emran and Shilpi (2011, 2015), Emran and Sun (2011, 2014), Bossuroy
and Cogneau (2013), Maitra and Sharma (2010), Assad and Saleh (2013)). Most of the
studies on economic mobility in developing countries rely on education and occupation as
markers of economic status, because reliable data on income for long enough time periods
to calculate permanent income is not available.8
Most of them also use data selected
non-randomly due to residency requirement for household membership. There is, however, no
uniformity in the definitions of ‘household’ across different surveys, although all are
con-cerned with ‘living together’, ‘eating together’, and sometimes with the ‘pooling of funds’
(Deaton (1997)). Examples of household surveys that usually include coresidency as a
defining criteria include Household Income and Expenditure Survey (HIES), Demographic
and Health Survey (DHS), and Living Standard Measurement Survey (LSMS). There are
some household surveys which include limited information on the parents of household head
and spouse, but do not include the nonresident children of the household head. Hertz et
al. (2007) use household surveys from 21 developing countries (10 Asian, 4 African, and
7 Latin American) and 8 formerly Communist countries where household surveys provide
information on parents’ education for household head and spouse, but do not include the
8
nonresident children.9
When non-resident children are excluded from the survey, it results
in truncation of the sample, the information on both the dependent and explanatory
vari-ables for them is missing from the data set. This also implies that, in most of the cases,
it is not possible to estimate a sample selection equation (a la Heckman) to correct for
the biases, because it is not possible to identify if a household is missing children from the
survey. The maximum likelihood approach developed by Bloom and Killingsworth (1985)
can be applied in this case if multivariate normality is a reasonable assumption.
Although non-random sample selection due to coresidency has been a major
method-ological issue in the research on intergenerational mobility, evidence on the magnitude of
coresidency bias has been scarce, with the exception of the analysis of occupational
mo-bility in the UK by Francesconi and Nicoletti (2006). In an interesting paper, they use
British Household Panel Survey to estimate the extent of coresidency bias in the estimates
of intergenerational persistence in occupational prestige between father and son(s). They
use the occupational prestige index due to Goldthorpe and Hope (1974), and estimate
intergenerational elasticity as a measure of persistence. The evidence reported in their
pa-per shows that the coresidency bias is substantial, ranging between 20-40 pa-percent.10
They,
however, do not address the question whether intergenerational correlation (IGC) and
inter-generational regression coefficient (IGRC) are affected differently by the coresident sample
selection, which is the focus of our analysis.
We are not aware of any analysis of coresidency bias in the context of educational
mobility, either in developed or developing countries. Our analysis can also claim broader
9
Hertz et al (2007) are careful about sample selection bias, and they do not focus on the subsample of household head’s children as has been the case in many recent studies that rely on data without non-resident children. To the best of our knowledge, the only survey in Hertz et al. list of countries that cover all of the non-resident children in the survey is that for Bangladesh.
10
applicability as we use data from two developing countries with substantial differences in
the coresidency rates, and provide evidence on both father-son and mother-daughter links
in educational persistence.
3. Data and Variables
We use two rich data sets particularly suited for the analysis of the extent of coresident
sample bias in the standard measures of intergenerational persistence. The source of data
on India is the 1999 Rural Economic and Demographic Survey done by the National Council
for Applied Economic Research, and the data on Bangladesh comes from the 1996 Matlab
Health and Socioeconomic Survey (MHSS). The Bangladesh survey collected information
on three generations of individuals (household head and spouse’s all children, parents and
siblings) from 4538 households in Matlab thana of Chandpur district.11
This information
can be used to construct a family tree spanning two generations for each household including
any non-resident member. The India survey also collected information on all of household
head’s children from current marriage and on all siblings and fathers but not non-coresident
mothers of children from earlier marriage(s). We utilize these information to create data
sets containing education and other personal characteristics of parents and children. Both
of these surveys focus on rural areas in respective countries. The advantage of rural sample
is that the bias from censoring due to non-completion of younger children may not be as
important, because only few go on to have more than middle school (or high school). The
children who go for more than high school education (10 years of schooling in Bangladesh
and India) are also the children who leave the village household, because the “colleges” (for
grades 11 and 12) and universities (for three-four year undergraduate, and graduate study)
11
are not located in villages.
Our main sample consists of household head and spouse, and their children, including
those from other marriages in the case of Bangladesh. For the empirical analysis, we use
alternative samples defined by different age ranges for the children. Our main results are
based on a sample of children aged 13-60 years. To test the sensitivity of our conclusions
with respect to the specific age-cut offs, we estimate the IGRC and IGC for a number of
alternative age ranges; 16-60; 20-69 and 13-50 years. As part robustness checks, we carry
out all of the estimations for an extended family sample which includes household head
and spouse’s siblings and parents in addition to their children (i.e., all three generations)
also.
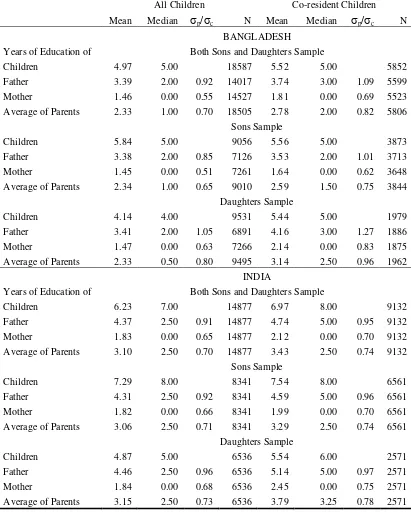
Table A.1 reports the summary statistics of the relevant variables for both the Bangladesh
and India data sets for our main estimation sample [children in the age range 13-60 year].
Several interesting observations and patterns are noticeable in our data sets.The average
schooling attainment remains low in rural areas of both Bangladesh and India at the time
of the survey years. The mean and median years of schooling are 4.97 and 5 respectively
for Bangladesh, and 6.23 and 7 for India. The relatively lower education attainments in
Bangladesh compared with India were present during parents’ generation as well: median
years of father’s education was 2 years in Bangladesh compared with 2.50 years in India.
The average number of children per household in Bangladesh is about 5.74 compared with
3.53 in India. Part of this difference reflects the fact that Bangladesh data include
informa-tion on children from other marriages while India data do not. There are some differences
in the age distribution of children also: median age for Bangladesh data is 30 years
com-pared with 33 years for India. The gender gap in education between boys and girls is about
Table A.1 also reports the ratio of standard deviation of parent’s education to that of
children’s education for both all and coresident children in columns 3 and 7. The ratio is
unambiguously smaller in the full sample (including both coresident and non-resident
chil-dren) compared with that in the coresident sample. This is consistent with the observation
noted above that a higher estimate of this ratio in a coresident sample is likely to partially
offset the biases in IGC estimates.
4. Empirical Results
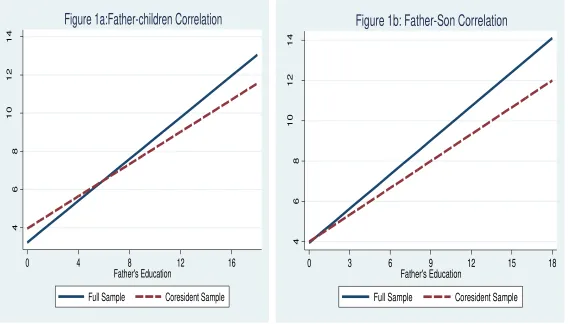
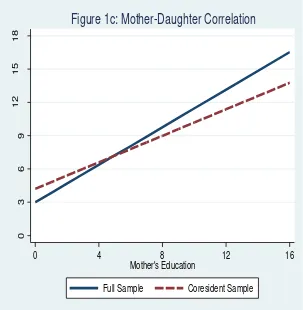
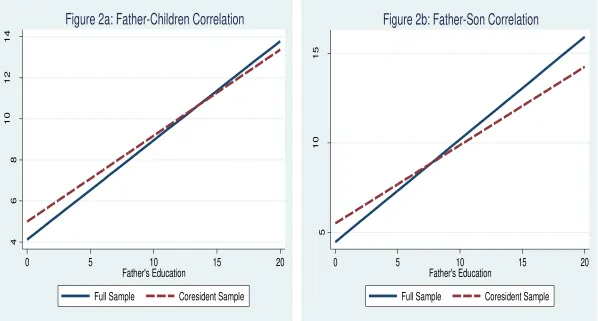
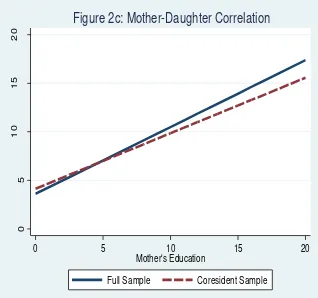
We begin the discussion with graphical presentation of the data, following the classic
analysis of truncation in Hausman and Wise (1977). Figures 1 and 2 report the bivariate
linear plots of children’s schooling against parents’ schooling for both the full and the
coresident samples for Bangladesh and India respectively. The coresidency rate is much
higher in India data compared to that in Bangladesh data, thus the implied sample selection
bias is likely to be relatively lower in India. For example, in the father sons sample the
coresidency rate is 79 percent in India, while the corresponding rate is only 52 percent in
Bangladesh. In the mother-daughter samples, the coresidency rates are lower: 39 percent
in India and 26 percent in Bangladesh, reflecting the fact that women leave the natal family
following marriage in both countries.
The graphs are generated from the sample of household head’s (and spouse’s) children
which is also the focus of the empirical analysis below. The corresponding graphs for the
extended family sample are similar and thus are omitted for the sake of brevity. For each
country we present three graphs: (i) son-father, (ii) daughter-mother, and (iii) all
children-father. If the coresident sample is missing children in a nonrandom fashion, it is likely to
affect the slope of the line fitted to the data. The figures show that the slope of the fitted
coresident sample which is consistent with Hausman and Wise (1977). The widely held
belief that the coresident sample bias in the estimate of IGRC is substantial thus appears
clearly visible in the data, especially in case of Bangladesh where coresidency rate is lower.
In the graphs for the “all children” sample (including both sons and daughters), the
coresident line intersects the full sample line from above (see Figures 1A for Bangladesh and
2A for India). This implies that the surveys miss less educated children from households
with low parental education, but miss better educated children from households with high
parental education. We thus have both truncation from above and from below.
A closer look at the other graphs reveal some interesting differences across gender and
countries. In Bangladesh, the fitted lines in father-son sample (see figure 1.B) intersect each
other at a very low level of father’s education, implying that most of the coresident line
lies below the full sample line. This implies that, for most of the distribution, the better
educated sons leave the parental household. For Mother-daughter sample in Bangladesh
(figure 1.C) the pattern of selection is different; the line for the coresident sample intersects
the full sample line from above at about 5 years of mother’s schooling which is very high
given that the average education for mothers is only 1.47 years. This implies that that
coresident line lies above the full sample line for most of the cases; the girls with relatively
lower education leave the parental household (presumably following marriage, they relocate
to husband’s house). Also, the gap between the coresident and full sample lines becomes
smaller as the parental education increases, which suggests that the probability of a less
educated girl leaving her parental household becomes smaller when parent’s education is
higher. This can be interpreted as suggestive evidence that better educated parents are
less likely to marry off their daughters without completing high school (10th grade in both
The figures for India are broadly similar, although the effect of non-random sample
selection on the slope is smaller compared to the case of Bangladesh, especially in
father-son sample, which reflects the fact that coresidency rate is very high for father-sons in India.
However, the graphs again tell a consistent story; in all three groups, the coresident fitted
line has lower slope than that in the fitted line in the full sample. The intersection points
of the coresident and full sample lines are, however, more centered, implying that for the
lower educated parents, it is the low educated children that leave the household, and for
the high educated it is the opposite. The intersection for the daughters’ is at a higher level
of father’s schooling, implying that the low educated daughters are non-resident for most
of the cases.
While the graphical exploration provides suggestive evidence that coresidency restriction
in the definition of household membership in the surveys can cause significant bias in the
estimate of the slope of the linear regression line, to get a measure of the extent of bias
in IGRC and IGC, we now turn to the estimates for both Bangladesh and India. We first
discuss the results for the all children sample (i.e, that includes both sons and daughters).
These provide average estimates across gender, and are useful as summary measures. We
then provide estimates for the father-son and mother-daughter intergenerational persistence
which have been the focus of most of the economics literature.
The regression specification used for estimating the IGRC and IGC is motivated by
Solon (1992) and includes age and age squared of both the child and the father.12 As
robustness checks, we also estimate a number of alternative specifications, starting with
a simple bivariate model where no controls are used. In addition to the quadratic age
formulation standard in the literature, we use a completely flexible specification of the
effects of age by including dummies for different years of age. The estimates are very
12
robust; the numerical magnitudes of IGRC and IGC estimates vary little, if at all, across
different specifications.
To help keep track of the discussion across different samples, we note here again the
terminology used. We call “all children” when the sample includes both sons and
daugh-ters. A “full sample” includes both coresident and non-resident members, and “coresident
sample” includes only the members coresident in the household at the time of the survey.
4.1 Estimates for All Children (Sons and Daughters)
Evidence from Bangladesh
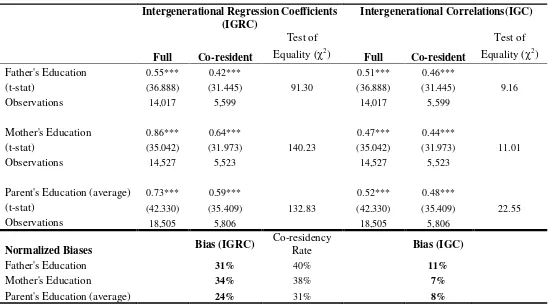
Table 1 reports the estimates of IGRC and IGC for all children in Bangladesh data,
i.e., sons and daughters combined together. The first two columns in Table 1 reports the
estimates of IGRC for the full and coresident samples (top panel) and the implied bias
(bottom panel) . We use three different measures of parental education: father’s schooling,
mother’s schooling, and the average of father’s and mother’s schooling. Note that some
researchers also use maximum schooling (of mother’s and father’s) as a measure of parental
education. In our data sets, the father has higher schooling in most of the cases, and the
correlation between the maximum parental schooling and father’s schooling is high enough
to yield virtually identical estimates of IGRC and IGC. In addition to the quadratic age
controls, we also include a dummy for gender of the child in the regression specification.13
This implies that any common factors (such as cultural norms) that might affect the average
schooling attainment of girls irrespective of parental socio-economic status are absorbed as
a shift in the intercept.
The estimates in the top panel of Table 1 provide strong evidence that the the coresident
sample selection bias in the IGRC estimates is substantial for all three definitions of parental
13
education. Consistent with the expectation based on the graphs discussed above, the IGRC
estimate in the coresident sample is significantly biaseddownward. The null hypothesis that
the estimate from the coresident sample is equal to the estimate from the full sample is
rejected unambiguously with P-values equal to 0.00 in all of the different cases.14 The
pattern is remarkably consistent, and justifies the widespread opinion that there are good
reasons to expect the IGRC estimates to be biased downward due to non-random sample
selection bias because of coresidency requirement used in the household surveys.
To get a better sense of the implied magnitudes, we report normalized bias defined as
follows (using IGRC as an example),
N ormalized Bias= (IGRCF −IGRCCR)×100
IGRCCR
where IGRCCR denotes the estimate from a coresident sample, while IGRCF is the
unbiased estimate from the corresponding full sample including non-resident household
members.
The first column in the bottom panel of Table 1 reports the normalized bias in the
IGRC estimates from the coresident sample. The evidence is clear: the estimate from
coresident sample is biased downward, and the magnitude of bias is substantial across all
three indicators of parental education.15
The bias is the highest when mother’s schooling
is the indicator of parental education (34 percent), and the lowest in the case of average
parental schooling (24 percent), with an average bias of 29.7 percent.16
A 30 percent bias
14
We, however, note here that the formal test of equality of estimates may not be very useful in our context. Even with very small numerical difference between the estimates from the full and coresident samples, one can reject the null of equality simply because the standard errors are extremely small (see, for example, the IGC estimates). So the focus should be on the magnitude of the bias not the statistical test of equality of estimates.
15
Since we report only the normalized biases in the tables, we will use “bias” and “normalized bias” interchangeably.
16
(normalized) on an average vindicates the unease among the researchers and editors of
journals that the available household surveys in developing countries may not be
particu-larly helpful in understanding the magnitude of intergenerational persistence in economic
status.
We now turn to the IGC estimates for Bangladesh reported in columns 4 (full sample)
and 5 (coresident sample) of Table 1. The estimated IGCs for three different indicators
of parental education are reported in the top panel and the implied normalized biases are
reported at the bottom. The evidence is strikingly different from the IGRC; the estimate
of IGC from the coresident sample is much closer to that from the full sample, and this
is true for all three different indicators of parental education (top panel). The average
normalized bias in the IGC estimates is 8.7 percent which is less than one third of the
average normalized bias in the IGRC estimates (29.7 percent). The highest magnitude of
bias is 11 percent in the case of IGC which is less than half of the lowest bias found in
the IGRC estimates (24 percent). A comparison of the estimates of IGRC and IGC for
Bangladesh in Tables 1 is revealing: it suggests that while the widespread caution about
the coresidency bias is right on target for the IGRC estimates, the coresidency bias may
not be a stumbling block when a researcher focuses on the IGC as the relevant measure of
intergenerational persistence.
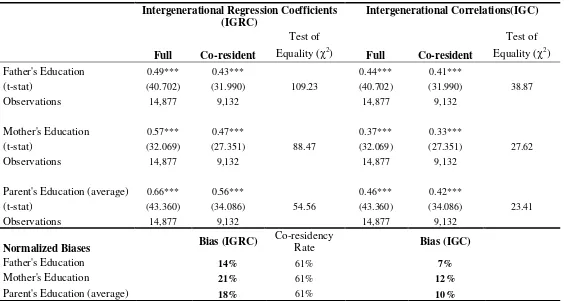
Evidence From India
Tables 2 reports estimates of IGRC and IGC from India data for three different
indica-tors of parental education (father’s schooling, mother’s schooling, and average schooling of
mother and father). We begin the discussion with the estimates of IGRC and the implied
bias (normalized). The difference between the IGRC estimates from the coresident and
Bangladesh (compare top panel of Table 1 to that of Table 2). The average normalized
bias is about 17.6 percent. While the extent of bias is not as dramatic as in the Bangladesh
data, the evidence still indicates that the coresident sample selection causes downward bias
in the IGRC estimates and the magnitude of bias is substantial. The relatively lower
selec-tion bias in the India estimates reflects the fact that the proporselec-tion of coresident children
is higher in India compared to Bangladesh as discussed before (61 percent in India and
about 40 percent in Bangladesh).
The IGC estimates in columns (4) and (5) in Table 2 show that the coresident sample
selection bias in IGC estimates is significantly smaller. The average bias in IGC for India is
10.4 percent which is much smaller than the 17.6 percent average bias found in the IGRC
estimates. The evidence in Table 2 thus supports the conclusions from Bangladesh data that
(i) the selection due to coresidency restriction in a survey can cause significant downward
bias in the estimates of IGRC, and (ii) the corresponding bias in the IGC estimates is
substantially lower.
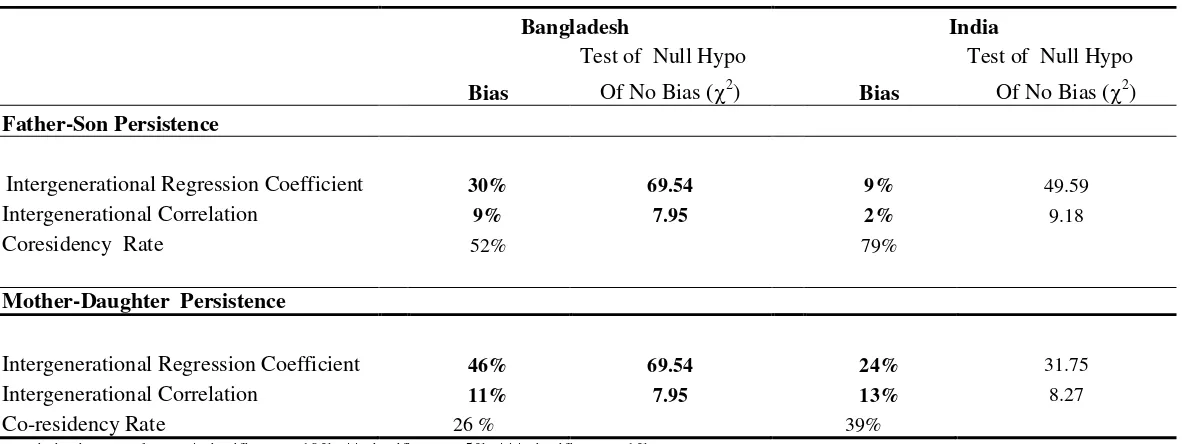
4.2 Estimates of Father-Son and Mother-Daughter Schooling Persistence
In this subsection, we discuss the biases in the IGRC and IGC estimates for the
in-tergenerational link between the father and sons, and the mother and daughters. While
father-son intergenerational persistence in economic status has been the most widely
re-searched topic both in developed and developing countries, it is probably equally (if not
more) important from a policy perspective to understand the barriers faced by the girls in
education. The results on father-son linkage are reported in the upper panel of Table 3, and
the bottom panel contains the corresponding estimates for mother-daughter persistence in
schooling. We report the estimates of bias, and test the null hypothesis of zero bias (i.e.,
brevity, we omit the underlying estimates of IGRC and IGC. The estimates for Bangladesh
are in the first two columns, and the last two columns refer to the corresponding results
for India.
Bangladesh
The estimates of father-son intergenerational link in schooling for Bangladesh shows
that the IGRC estimate in the coresdient sample suffers from strong downward bias; the
bias is 29.5 percent (see (row 1, column 1) in the top panel of Table 3). The bias in
father-son IGRC estimate is thus similar to the average bias for the all children sample discussed
above: 29.7 percent. The corresponding bias in the estimated IGC is much smaller: only
8.9 percent (row 2, column 1). Thus the coresidency bias in the IGC estimate is less than
one third of that in the IGRC estimate in the case of father-son link.
The results for mother-daughter in Bangladesh are reported in columns 1 and 2 of the
lower panel of Table 3. Consistent with the results for father-son sample, the estimate of
IGRC from the coresident sample is much smaller compared to the unbiased estimate from
the full sample; the bias in the IGRC estimate from the coresident sample is 45.6 percent, a
very high magnitude indeed. This illustrates starkly that relying on the coresident sample
can lead to grossly misleading picture of intergenerational persistence between mother and
daughter(s). This reflects the fact that the degree of sample selection is very high in the
daughters’ case; only 25 percent of the full sample satisfies the coresidency restriction in
Bangladesh data (for sons it is 52 percent of the full sample). The bias in the IGC estimate
from coresident sample is again much smaller in magnitude: 10.6 percent.
India
The estimates of father-son schooling persistence for India are reported in columns (3)
bias due to coresidency is substantial; the unbiased estimate from the full sample is 29.5
percent higher than the estimate in the coresident sample.17
The bias in the father-son
sample is thus significantly larger than the average bias we found earlier for the sample of all
children across different measures of parental education (17.6 percent). In sharp contrast,
the IGC estimate suffers from very little coresidency bias: 2.4 percent only. The estimated
bias in the IGC estimate for father-son in India is thus ignorable, while the IGRC estimate
suffers from strong downward bias from coresident sample selection.
The bias estimates for mother-daughter schooling persistence in India are reported in
columns (3) and (4) of the lower panel of Table 4. The bias in the IGRC estimate for
mother-daughter is smaller for India when compared to Bangladesh, but the magnitude
of bias is still substantial 21.8 percent. The corresponding biases in IGC estimates is 9.7
percent which is less than half of the bias in the IGRC estimate.
5. Additional Evidence
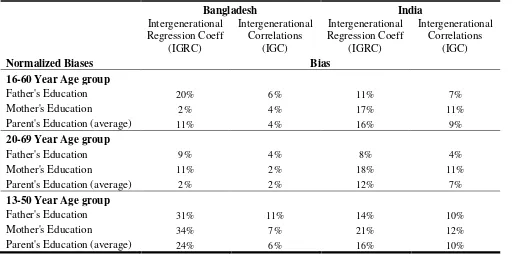
(5.1) Alternative Age Ranges for the Children
In this section, we discuss the estimates of IGRC and IGC for coresident and full
samples using alternative age ranges of the children. We estimate the IGRC and IGC for
both India and Bangladesh and for the three different cases discussed above: all children,
father-son, and mother daughter. The age range used so far in Tables 1-4 is 13-60 years.
This is motivated by the fact that the average schooling attainments in rural Bangladesh
and India remain low in the survey years. In Bangladesh, the average years of schooling is
only 4.43 years; for sons it is 5.5 years and for daughters 3.4 years. The average schooling
in India is 5 years, and for sons it is 7 years and for daughters 3.7 years. To explore the
sensitivity of the conclusions with respect to the age range of children, we estimate the
17
IGRC and IGC across a number of different age ranges. For the sake of brevity, we report
estimates from the following age ranges: (i) 13-50 years, (ii) 16-60, and (iii) 20-69 years.
Since many children start first grade at age 6, a 13 years age cut-off implies 7 years of
potential schooling as the minimum threshold in our sample (primary schooling is 5 years).
The observed schooling attainment, however, may vary across 13 year old children for a
variety of reasons. For example, children from poor households may start schooling later
than usual, and they may also have to interrupt schooling because of negative economic
shocks.18
The variations in schooling attainment at age 13 (or even younger) can thus
provide us useful evidence on the role played by family background. However, one might
worry that some children at age 13 have not yet completed schooling, and it is important
to check if the results hold when the lower threshold for children’s schooling is raised. We
thus estimate the IGRC and IGC in a series of samples, starting with 14 years and raising
the lower threshold incrementally by one year at a time up to 20 years. The evidence from
this exercise is very reassuring; while the magnitudes differ across the samples, the main
conclusions reached on the basis of 13-60 years age range remain intact. For the sake of
brevity we report estimates for 16 and 20 years as the lower age threshold for children. A
16 year age cut-off implies potentially 10 years of schooling which coincides with one of the
most important public examination in both Bangladesh and India (called Secondary School
Certificate (S.S.C) or ‘Matriculation’ examination). After 12 years of schooling (18 years
of age cut-off), the students sit for a second important public examination, called Higher
Secondary Certificate (H.S.C) or Intermediate examination. In our Bangladesh data, about
10 percent of 20 years of age or older has 10 years or more schooling, and 5 percent has 12
years or more schooling.
18
For each age range, we present the bias estimates and omit the underlying estimates
of IGRC and IGC for full and coresident samples. This allows us to reduce the number
of tables by putting together the relevant estimates for both Bangladesh and India in a
single table. However, all of the underlying estimates are available from the authors upon
request.
The estimates for three different age ranges for the all children sample including both
sons and daughters are presented in Table 4. Following the earlier results, we report
estimates of bias for three alternative indicators of parental education: father’s schooling,
mother’s schooling, and the average of father’s and mother’s schooling. The estimates,
both for India and Bangladesh, lead to the same set of conclusions derived from the 13-60
years age range in section (4). The IGRC estimates, in general, suffer from substantial
downward bias because of coersident sample selection. In Bangladesh, the bias in the
coresident sample estimate of IGRC is more than 10 percent in seven out of nine cases,
with an average bias of 18.35 percent. Consistent with the earlier evidence, the extent of
bias in the case of India is smaller, the average is 14.7 percent, but still the bias is more
than 10 percent in seven out of nine cases. In contrast, the coresidency bias in the IGC
estimates are again much smaller, in only one out of nine cases the bias is more than 10
percent in Bangladesh (10.9 percent when father’s age is the indicator of parental education
and the age range for children is 13-50 years). The average bias in the IGC estimate for
Bangladesh is only 5 percent, less than one third of that in the IGRC estimates (18.35
percent). The estimates for India are similar; in three out of nine cases the bias is more
than 10 percent, the highest being 12.1 percent, and the average is 8.9 percent, significantly
smaller than the corresponding average for IGRC (14.7 percent).
school-ing attainment for different age ranges of children. As to be expected, the magnitudes of
the estimates vary across different age ranges, but the main conclusions of the paper remain
valid. The coresident sample bias in the IGRC estimates is very high in the estimates for
Bangladesh; the lowest bias is 15 percent and the highest 45.6 percent, with an average of
27.5 percent, a very high bias by any standard. The bias estimates for India are smaller
in magnitude consistent with its higher coresidency rates. However, the average bias in
IGRC is still more than 10 percent (10.6 percent). More important for the research on
intergenerational mobility in developing countries constrained by the coresident samples is
the clear evidence that in all 16 cases reported in Table 5, the bias in the IGC estimate is
much smaller than that in the corresponding IGRC estimate. The average normalized bias
in the IGC estimates is only 7.3 percent in Bangladesh (27.5 percent for IGRC), and 4.6
percent in India (10.6 percent for IGRC).
5.2 Extended Family Sample
The evidence discussed above comes from samples where household head and his/her
family is the focus (spouse and their children). This is motivated by the fact that most of
the household surveys in developing countries contain information on coresident children
of household head, and thus the results are relevant for the analysis of inequality and
mobility in a large number of developing countries. However, some household surveys may
also include information on the extended family members if they are coresident at the time
of the survey, including grandparents (parents of household head and spouse) and siblings of
household head and spouse. In this section, we check if the main conclusions regarding the
coresdiency bias hold in a sample that includes extended family members. The estimates
for the ‘all children’ group (including both male and female) are presented in the top panel
schooling persistence. Again, for the sake of brevity, we only report the bias estimates for
IGRC and IGC, both for India and Bangladesh in each Table. The underlying estimates
of IGRC and IGC are available from the authors.
The estimates for the extended family in Bangladesh provide dramatic confirmation of
the conclusions reached above on the basis of the sample of children of household head
and spouse. The IGRC estimates suffer from strong downward bias; the lowest bias is 21
percent, and the average is 27 percent. Consistent with the evidence from household head’s
children sample in Tables 1-3, the magnitude of bias in the IGRC estimates is somewhat
smaller in the case of India; but it is still large enough to justify the worry that coresident
sample selection can result in misleading estimates of intergenerational persistence. The
lowest estimate of bias in the IGRC is 14 percent, and the average is 19 percent in the case
of India.
5.3 Coresidency Rates and The Extent of Bias
An interesting aspect of the results presented above is that there is significant variation
in the coresidency rates across Bangladesh and India data, and the bias estimates reflect
the differences in the severity of selection. Since we estimated the bias in IGRC and IGC
for a number of different samples including the extended family sample, one might wonder
how the magnitude of the bias relate to the degree of selection (or alternatively coresidency
rates) across different samples. Figure 3 shows the relation between the coresidency rate
and the estimated bias for both IGRC and IGC estimates. There is a clear negative
relation between coresidency rate and the magnitude of bias, implying that comparing
IGRC estimates from different data sets may be inappropriate. In contrast, there is no
6. Towards an Understanding of the Results: Why is the Bias in IGC
Estimates So Low?
The evidence presented above is strikingly consistent and clear: when a researcher
works with a data set from a survey that uses coresidency for defining the household, the
IGRC estimates are likely to be seriously biased downward; but the estimates of IGC in
coresident samples are, in general, much closer to the unbiased estimates from the full
sample. The estimates of IGC in schooling attainment for Bangladesh and India presented
and discussed above show that the widely available household surveys such as LSMS and
HIES that use coresidency criterion to define household membership can be profitably used
to understand intergenerational economic mobility as long as the researchers move away
from the current emphasis on estimating IGRC. If one focuses on the IGC as a measure of
mobility, these data sets could be relied upon to provide credible evidence on the magnitude
of intergenerational economic persistence in a large number of developing countries.
It is important to appreciate that the coresident sample bias common in the household
surveys in developing countries is best modeled as a truncation, not censoring. The most
common problem in the context of household surveys in developing countries is that there
is no information (on both dependent and independent variables) for the the non-resident
children resulting in truncation of the sample. The evidence presented above suggests that
the non-resident children are not randomly distributed, both in Bangladesh and India:
they come mostly from the tails of the schooling distribution. The truncation can be from
below, especially for the daughters, if the more educated daughters marry late and thus
are more likely to be observed as household member given a specific residency criterion in
a survey. On the other hand, truncation can also be from above, because in the context of
migration is a positive function of education. This would imply that most of the missing
children (especially sons) due to the residency requirement belong to the right tail of the
distribution. However, the result that the bias in IGC is much smaller does not depend on
whether the coresidency criterion in a survey cuts out children from the upper or lower tail
of the schooling distribution (or both tails).
6.1 Coresidency Restriction and Truncation Bias in a Simple Model
6.1.1 Bias in the IGRC Estimate
Consider the standard model of sample truncation widely discussed in the econometrics
and statistics literature, as adapted to our application (for the econometric literature see
Heckman (1979), Greene (2012), and for a statistical treatment, see Cohen (1991)). The
truncation is from below and based on a level of schooling of the children T >0; so a girl
i with schooling level Sic ≦ Ti leaves the household for marriage, for example, and thus is
not included in the survey. A simple model of the marriage decision is as follows (assuming
parent’s decide marriage for girls):
Mi =
1 if
0
vi−wSic >0
otherwise
(1)
where vi is payoff (indirect utility) from marrying off child i , wSic is the labor market
earnings forgone as a girl leaves the natal family after marriage, and Sc
i is the schooling
level of girl i. The marriage decision Mi is a binary indicator that takes on the value of 1
when a girl is married (and lives in a separate household).
Denote the set of individuals included in the survey by D. So child i is unmarried and
holds:
Sic > vi w ≡Ti
So we have the following model of the population relation and data generation:
Sic =β0+βSip+ϵi; i∈D, if Sic > Ti >0 (2)
where Sip denote years of schooling of parents. We assume thatϵi ∼N(0, σ 2 c).
For simplicity of exposition, we ignore other control variables such as age of parents
and child. A standard result in the literature is that OLS regression in the coresident
sample suffers from omitted variables bias, because the conditional expectation function is
not linear (Greene (2012), Heckman (1979)):
Sic =β0+βSip+
σvϵ σv
λi+ϵi (3)
where σvϵ is the covariance between vi and ϵi, and σv is the standard deviation of vi.
The error term in the OLS regression is not ϵi, but µi = σvϵ
σv
λi+ϵi which is correlated
with Sip causing omitted variables bias. The omitted variableλi is called the inverse Mills
ratio and given as follows:
λi =λ(αi)≡
ϕ(αi) 1−Φ (αi)
, αi =
Ti−β0−βSip
σc
As discussed by Greene (2012), although the bias depends on the correlations in the
data, a robust empirical regularity widely observed in the literature is that the OLS estimate
is biased downward to zero (see also Hausman and Wise (1977), Cohen (1991)).19
Denoting
19
the OLS estimate in the coresident sample by ˆβT, the attenuation bias due to truncation
in the OLS estimate can be approximated by the following relationship:20
plim(βˆT −β
)
≈(δ−1)β <0 (4)
where
δ =[1−αλ(α)−(λ(α))2]∈(0,1)
and α is the mean of αi. Our estimates of IGRC
(
ˆ βT
)
for Bangladesh and India show
that the bias implied by inequality (4) above can be serious.
6.1.2 Bias in the IGC Estimate
The IGC can be estimated from a regression where the variables are normalized so
that their mean is zero and variance is 1. Denote the IGC (correlation coefficient) between
father’s schooling and children’s schooling byρ. The we have the following regression model
for estimation of IGC:
Zic =ρZip+σηϑλei+ηi i∈D, if Zic >T˜i ≡
(
Ti−S¯c σc ) (5) where Zc i = Sc i −S¯c
σc
; Zip = S
f i −S¯f
σf
e
λi =λ( ˜αi) ; ˜αi = ˜T −ρZip , ηi = ϵi σc
ϑi = vi σc
where a bar on a variable denotes the sample mean, andσc and σf are standard deviation
of children’s and father’s schooling, and σηϑ is the covariance between the error terms in
the children’s schooling and marriage selection equation with the schooling variables
stan-Wise (1977). 20
dardized. The truncation point in the standardized model is ˜Ti =
Ti−S¯c σc
. A comparison
of equations (2) and (5) shows that the truncation points are different, and thus the extent
of bias due to truncation may be different.
To see that the truncation bias is lower in OLS estimate of equation (5), note that
similar to equation (4) above, we have the following approximate relation for model (5):
plim(ˆρT −ρ)≈
( e
δ−1)ρ <0 (6)
where
e
δ=[1−αλ˜ (˜α)−(λ(˜α))2]
It is easy to check that eδ > δ, if ˜α < α. By using the relation that β = ρσf σc
, we can
rewrite ˜αi as follows:
˜ αi =
(
T −β0−βSip
σc
)
−
( ¯
Sc −β
0−βS¯f
σc
)
=αi−
( ¯
Sc−β
0−βS¯f
σc
)
(7)
Now ˜αi < αi follows from the observation that
(¯
Sc−β
0−βS¯f
)
> 0 in a truncated
sample because ¯Sc =E(Sc
i |Sic > Ti) = β0+βS¯f +E
(
ϵi |ϵi > Ti−β0−βS f i
)
and E(ϵi |ϵi > Ti−β0−βSif
)
>0.
6.2 Discussion
The preceding section shows that the attenuation bias due to truncation of the sample
caused by coresidency restriction is likely to be smaller when we estimate IGC as a measure
of intergenerational persistence instead of the IGRC which has been by far the most widely
used measure in economics literature. This provides a conceptual basis for the empirical
discuss alternative ways to think about the coresidency bias in the IGC and IGRC estimates
which may provide additional intuitions.
We focus on the following relationship between IGRC and IGC widely known in the
literature (see, for example, Solon (1999)):
ρ=βσp σc
(8)
A simple way to understand the evidence presented in this paper is that truncation
biases the estimate of β downward, but it also results in upward bias in the estimate of
ratio of standard deviations in schooling σp σc
. As a result, the net bias in IGC (ρ) is smaller
than the bias in IGRC (β ) estimate. Estimate of the ratio of the standard deviations in
our data sets confirms that the magnitude is larger in the truncated samples (see Table
A.1).
A standard result from the literature is that truncation reduces the variance of a variable
(Greene (2012)). Since truncation is based on children’s schooling, it affects the variance
of children’s schooling directly :
P lim(ˆσc) =
√
δ(σc) (9)
If the estimate of standard deviation of parental education is not biased significantly when
truncation is based on children’s schooling, we can put together the relations in inequality
(4), and equations (8) and (9) to derive the following approximate relation:
P lim(ˆρT −ρ)≈
(√
δ−1)ρ (10)
right hand side of approximation (10) is much smaller than the bias in approximation (4).
To give a sense of the magnitudes, δ = 0.9 implies a value of √δ = 0.949 , and δ = 0.8
implies √δ = 0.90. Thus the IGC estimates from coresident sample suffer from much
less bias when compared to the most widely used measure of intergenerational persistence:
IGRC. If the bias in IGRC is 10 percent, the corresponding bias in IGC is half of that (5
percent), and when the IGRC estimate is biased downward by 20 percent, the corresponding
bias in IGC is about 10 percent. The actual biases estimated in the data, however, would
also reflect sampling variability, and thus we are not likely to see the square root relation
between the bias factors to be exactly borne out. However, the important point here is
that we should expect the bias in the IGC estimates to be lower, in general.
Note that the standard household surveys in developing countries include a random
sample of parents, and thus the bias in the estimate of the standard deviation of parents
schooling is not likely to be substantial. In contrast, the standard deviation of the children’s
schooling is affected directly by coresidency in the survey as truncation is based primarily
on children’s schooling. Also, note that truncation based on children’s education is
un-likely to affect the variance of parents schooling in a significant way even when the focus
is on household head and spouse as children in the older generation (i.e.,
grandparents-parents intergenerational persistence). Most of the grandparents-parents in a developing country such as
Bangladesh and India live with their adult children, as the market for old-age home and
assisted living for seniors is limited and underdeveloped at best. This is especially true in
the rural areas where such markets are virtually non-existent.21
The scarcity of land and
high costs of housing also preclude independent living by the ageing parents of household
head and spouse in India and Bangladesh (cost of health care is also important). When
21
a significant proportion of the parents of household head and spouse live in retirement
villages and old-age homes as is the case in a developed country such as USA and UK,
the sample of parents (i.e., grandparents) captured in a randomly selected cross-section
of households may suffer from selection bias. In the context of developing countries, the
sample of parents of household head and spouse in a cross-section survey can be treated as
approximately random, but the sample of children they coreside with is clearly a selected
sample. As noted above, the income of children is an important consideration in a parent’s
coresidency, and a positive correlation between income and education implies that we would
likely to miss lower educated children when we focus on the coresident sample of household
head, his/her spouse and their parents.22
Figures 4.A (Bangladesh) and 4.B (India) plot the probability of nonresidency at the
time of the survey against the schooling of children. The graphs in both Bangladesh and
India show that probability of nonresidence is higher in the tails, as noted before. Also,
the probability of nonresidence is higher for girls at any given level of schooling, although
the gender gap closes substantially at the right tail in the case of Bangladesh.
7. Implications for the Existing Studies and the Debate on Economic
Mo-bility in Developing Countries
In the introduction, we briefly mentioned that it is not uncommon in the literature to
find that conclusions regarding intergenerational mobility in economic status in developing
countries depend on the measure used. A survey of the literature shows that the studies
that rely on IGRC as the metric, in general, conclude that economic mobility has increased
substantially over time (see, for example, Jalan and Murgai (2008) on India, and Hertz
et al. (2007) for cross-country evidence) . The evidence based on IGC on the other hand
22
tend to find much more stickiness in social mobility, and conclude that mobility has not
improved in any significant way (Emran and Shilpi (2015) on India, and Hertz et al. (2007)
for cross-country evidence).
Hertz et al. (2007) in a sample of 42 countries (21 of them developing countries) report
a sustained and significant decline in the magnitudes of the estimated IGRC in schooling
over time. They also report IGC estimates which show a very different picture: there is
no discernible trend in the estimates; the slope of the fitted line is, in fact, close to zero.
Hertz et al. (2007) are very much aware of the critical role played by the differences in
the variance in schooling across generations; they emphasize the fact that the variance of
children’s schooling relative to the variance of parent’s schooling has gone down over the
years in the data they use, and that explains the divergence between the IGRC and IGC
estimates. They, however, do not note the possible connection between the variance of the
children’s schooling and the selection bias due to coresidency restriction in the survey, as the
educated children are more likely to move out of parental home in the younger generations,
because of improved labor market opportunities, increased geographic mobility of labor,
and changes in cultural norms about age at marriage, and extended family (in favor of
nuclear family) in many developing countries. Our results indicate that at least part of
the declining variance may reflect the sample selection due to coresidency. A related point
relevant for cross country comparisons is that the coresidency bias in the IGRC estimates
is likely to vary across different countries which would depend on a variety of economic and
cultural factors such as labor market opportunities for children, costs of housing, availability
of public welfare schemes for ageing poor parents, among other things. As we discussed
in section (5.3) above the magnitude of bias in IGRC estimate seems to vary substantially
3). An immediate and important implication of this observation is that one should be
cautious about the IGRC estimates for cross-country comparison of economic mobility,
the focus instead should be on the estimates of IGC, especially when the conclusions are
contradictory from these alternative measures.
Similar evidence can be found in recent studies on intergenerational mobility in other
developing countries. Consider the case of India as an example. The extent of and trend
in economic mobility in India has attracted attention of the researchers given the evidence
that economic liberalization might have contributed to increased inequality while it has led
to growth in income and poverty reduction. The existing estimates of intergenerational
educational persistence in India lead to opposing conclusions depending on whether IGRC
or IGC is used as a measure; persistence has gone down substantially according to the IGRC
estimates, but it has remained largely unchanged in recent decades according to the IGC
estimates (Maitra and Sharma (2010), Jalan and Murgai (2008), Emran and Shilpi (2015)).
These studies focus on the parents (household head and spouse) and his/her children, and
the data used in all of these studies are constrained by the coresidency restriction in the
survey definition of household membership. The evidence presented in this paper implies
that the widely discussed improvements in educational mobility in India in last few decades
should be interpreted with due caution because they are based on IGRC estimates from
coresident samples, and thus are likely to be substantially biased downward.
8. Conclusions
This paper provides an analysis of the implications of coresident sample selection for two
widely used measures of intergenerational mobility: intergenerational regression coefficient
(IGRC) and intergenerational correlation (IGC). Even though there has been an
persistence in economic status in developing countries, a major stumbling block for this
research agenda has been the lack of appropriate data. Most of the household surveys on
developing countries use coresidency as a criterion to define household, and thus estimates
of intergenerational persistence from such data could potentially be severely biased as they
miss children who left the parental household for education, work, or marriage, for example.
We take advantage of two rich data sets from Bangladesh and India to explore the
magnitude of coresident sample selection bias in IGRC and IGC. In fact, IGRC is by far
the most popular measure of intergenerational economic mobility in development economics
literature. The evidence reported in this paper shows that the worry about the coresidency
bias is well-justified when the focus is on estimating IGRC.23
The IGRC estimates, in
general, suffer from substantial downward bias in a coresident sample vindication the worry
among researchers about usefulness of data that are constrained by coresidency restriction.
The bias in IGC estimates is, however, much smaller, less than one third of that in the IGRC
estimates in many cases. The lower bias in IGC estimates reflects the fact that selection due
to coresidency causes downward bias in the estimate of IGRC, but it also biases upward the
estimate of the ratio of variances of parent’s schooling to that of children’s. The downward
bias in the IGRC estimate is thus partly offset in the case of IGC by the upward bias in
the estimate of the relative standard deviations of schooling across generations.
The evidence and analysis in this paper thus provide a strong rationale for focusing on
the IGC as a measure of intergenerational mobility in the context of developing countries.
Perhaps, the most important implication of our analysis is that the available household
surveys in developing countries that use coresidency as a criterion to define household
membership are not worthless in analyzing the pattern and strength of intergenerational
23
economic persistence. Much progress can be made if the researchers move away from the
current emphasis on IGRC, and use IGC as the appropriate measure instead. Our analysis
also provides guidance for interpreting the conflicting evidence on intergenerational mobility
in developing countries. Since the degree of selection bias from coresidency varies across
countries substantially, the IGC estimates are likely to be more reliable for cross-country
comparisons of intergenerational mobility.
References
Arrow, K, S. Bowles, S. Durlauf (2000). Meritocracy and Economic Inequality,
Prince-ton University Press.
Asadullah, M Niaz, 2012. Intergenerational Wealth Mobility in Rural Bangladesh,
Journal of Development Studies, Taylor & Francis Journals, vol. 48(9), pages 1193-1208,
September.
Asadullah, M. Niaz, and Y. Gaston, 2012. Inequality of Educational Opportunity in
India: Changes Over Time and Across States, World Development, Elsevier, vol. 40(6),
pages 1151-1163.
Assaad R. and Saleh M. (2013), Does Improved Local Supply of Schooling Enhance
Intergenerational Mobility in Education? Evidence from Jordan, Working Paper 788, The
Economic Research Forum, Egypt.
Bardhan, P (2010). Awakening Giants, Feet of Clay: Assessing the Economic Rise of
China and India, Princeton University Press.
Bardhan, P (??), The State of Indian Economic Statistics: Data Quantity and Quality
Issues, Mimeo, Berkeley, CA.
Becket, Gary S. and Nigel Tomes (1979), An equilibrium theory of the distribution of