Persistent Performance of Fund
Managers: An analysis of selection and
timing skills
Pandow, Bilal
Middle East College
25 November 2017
Online at
https://mpra.ub.uni-muenchen.de/82975/
Persistent Performance of Fund Managers: An analysis of selection and timing skills
Bilal Ahmad Pandow
Senior Lecturer, Middle East College, Sultanate of Oman ([email protected])
Abstract
The persistence in manager’s ability to select stocks and to time risk factors is a vital issue for accessing the performance of any asset management company. The fund manager who comes out successful today, whether the same will be able to sustain the performance in the future is a matter of concern to the investors and other stake holders. More than the stock picking ability of fund managers, one would be interested in knowing whether there is consistency in selectivity and timing performance or not. If a fund manager is able to deliver better performance consistently i.e. quarter-after-quarter or year-after-year, then the mangers’ performance in selecting the right type of stocks for the portfolio would be considered satisfactory. This paper has attempted to analyze the persistence in both stock selection and timing
performance of mutual fund managers in India through Henriksson & Morton; Jenson, and Fama’s model over a period of five years. It
is found that the fund managers present persistence in selection skills however, the sample funds haven’t shown progressive timing skills in Indian context.
Keywords:
Persistence, selectivity, timing, performance, mutual funds1.
Introduction
The performance of mutual funds have been researched extensively in financial studies. Most of the studies like (Sharpe, 1966 & Jensen, 1968) observed that the net performance of mutual funds is lesser compared to their respective proxy markets.
While, Hendricks et.al. (1993), Goetzmann & Ibbotson (1994) and Brown & Goetzmann (1995) examined and
found persistence in fund mangers’ performance over short-term horizons. Some studies like Carhart (1997), explains this effect to modest momentum strategies, and not to outstanding expertise of fund managers.
The main contribution of this paper is to elaborate performance persistence measurement in Indian context. While the stock selection skills of the mangers are of utmost importance at the same time the performance of fund managers are also accessed on their market timing skills as well. The hypothesis of persistence for both skills are tested separately using t test and hypothetical deductive approach is used in the study.
The stock selection is the center of the investment management and involves identification and selection of belittled scrips. It also includes other like successful forecasting of the company specific to envisage the general behavior of scrip values in the prospect. This skill of the fund manager to be capable of identifying and selecting the undervalued scrips for the portfolio would increase the returns of the mutual fund schemes and vice versa. (Pandow, 2016). Apart from the scrip selection skills, the performance of fund managers also depends on the market timing skills. Timing the markets correctively produces higher performance and forecasting the market movements to revise the portfolio either to drive the maximum from the thriving market and to limit losses in falling market (Pandow, 2016).
The study use Henriksson and Merton (1981) hereafter referred to as HM; Jenson, and Fama’s model for a period of
2.
Literature Review
Based on the benchmarks, characteristic timing and characteristic selectivity, researchers used measures to check whether portfolio managers successfully time their portfolio weightings on these characteristics and whether managers can select stocks that outperform the average stock having the same characteristics. The researchers apply these measures to a new database of mutual fund holdings covering over 2500 equity funds from 1975 to 1994. The results show that mutual funds, particularly aggressive-growth funds, exhibit some selectivity ability, but that funds exhibit no characteristic timing ability (Daniel, et.al. 1997).
In a latest research by Rao, et.al. (2017) it is observed that the Chinese equity funds are successful in providing higher than market returns and fund managers possess positive market timing ability. They also found that Chinese equity funds do not show persistence in performance as witnessed in developed markets. Well performing funds (worst funds) of last year do not continue to provide higher (lower) return in the following year. Moreover, they also
observed a positive relationship of fund size, age and expense ratio with the fund’s performance. Overall results suggest that emerging market equity funds show better performance than that of developed markets.
Also, the researcher found that stock-implied volatility innovations forecast mutual fund performance. Specifically, mutual funds investing in fewer option-able stocks with favorable information outperform other funds. In addition, mutual fund managers overall do not trade on past options information. However, well-performing fund managers use that information to decrease their holdings in poorly performing stocks. Moreover, well-performing mutual funds containing strong options information tend to increase their holdings in option able stocks in subsequent periods (Chung, Wang, & Zykaj 2017).
Also one of the studies examine the short-term persistence in performance of equity mutual funds globally between 1990 and 2013. Using a sample of 35 countries, the study observed strong evidence of persistence in daily mutual fund returns over quarterly measurement periods. They also analyzed that the post-ranking abnormal return disappears when performance is examined over longer time periods. The study results confirm that superior performance is a short-lived phenomenon (Vidal, et.al. 2016).
These findings are also substantiated in a study were evidence of underperformance of Hong Kong mutual funds relative to the market were found. There was no significant selectivity and timing ability in the results of the actively managed mutual funds. Also, persistence was identified for the performance of both winners and losers in the short run (Abdel & Qing 2007).
Also, a similar kind of the study reveals that using a large sample of pension funds over the period 1983-97 in which there is less survivorship bias, the researchers found strong evidence of persistence in abnormal returns generated by fund managers over one year time horizons (Tonks, 2005).
The mutual funds have a lot of potential to grow but to capitalize the potential fully, however, the need is to create and market innovative products and frame distinct marketing strategies. Moreover, the equity culture has not yet developed fully in India as such, investor education would be equally important for greater penetration of mutual funds. As such mutual funds are expected to perform better than the market, therefore calls for a continuous evaluation of the performance of funds (Pandow & Butt, 2017).
Similar results by Bollen & Busse, (2005) suggest that superior performance is a short-lived phenomenon that is observable only when funds are evaluated several times a year. However, as against these observations in a study conducted by Christensen, (2005) analyzed that performance persistence using parametric as well as non-parametric methodologies. The study conclude by mentioning that in general Danish mutual funds perform neutrally, returns are non-persistent and Danish mutual funds have no timing ability.
3.
Methodology
daily returns for each of the sample schemes and the market portfolio have been calculated and due care has been taken for proper adjustments for the dividend, if any, paid by the schemes, as follows:
Return (Rpt) = (NAV_t - NAV_(t-1))/NAV_(t-1) Where: Rpt = Return of a scheme at the end of day t NAVt = Net assets value of the scheme at the end of day ‘t’ NAVt-1 = Net assets value of the scheme at the beginning of day ‘t’
Similarly the daily returns for the market Index i.e. for S&P CNX Nifty have been calculated using the following formula:
Market Return (Rmt)= (MI_t - MI_(t-1))/〖S&P CNX Niftyt〗_(t-1) Where:
Rmt = Return of the market Index for the day ‘t’ MIt = Market value of the market index at the end of day ‘t’
MIt-1= Market value of the market index at the beginning of day ‘t’
The daily returns are then annualized to obtain mean annual daily returns of each sample scheme and the market Index as follows:
Mean Annual Daily Portfolio Return (Rpt-a) = (Rp1+Rp2+Rp3+……….Rpn)/N Mean Annual Daily Market Return (Rmt-a) = (Rm1+Rm2+ Rm3…….Rmn)/N
3.1.
Excess return
On the basis of mean annual daily return, excess return and abnormal excess return the overall performance of the sample schemes was assessed, defined as under:
Excess Fund Return (ERP) = (R pt-a – R ft-a) Where: ERP = Excess mean annual daily fund return
R Pt-a = Mean annual daily return of the scheme for five years
R ft-a = Mean annual daily return of the 91, days treasury bills for five year study period
3.2.
Selectivity performance measurement model
Stock selectivity skills of sample fund managers were tested by using Jensen’s Alpha and Fama’s net selectivity
measure. Jensen (1968) developed an absolute measure based on Capital Asset Pricing Model (CAPM) to regress the excess returns of a portfolio on the market factor. Assuming that market beta or slope co-efficient is constant then the unconditional Alpha is a measure of average performance as in Jensen (1968). The absolute regression equation
is based on the assumption that the funds systematic risk is stationary over time. Owing to this assumption, Jensen’s
measurement model attributes funds overall performance to manager’s selectivity performance exclusively. This model is shown by the following regression specifications:
Rpt - Rft= α + β (Rmt– Rft) +et
Where: Rpt= The average return of the fund at time ‘t’
Rft= The risk-free return at time ‘t’
α = The Jensen performance co-efficient
β = The estimate co-efficient for the systematic risk level of the fund Rmt = Average return on the market portfolio
et = An error term
Here, the intercept α in the above equation is the Jensen’s performance co-efficient indicating risk-adjusted
selectivity performance of the fund. A positive and significant Alpha (α) indicates average extra return yielded by a scheme over the benchmark market portfolio return after considering the level of systematic risk of the scheme, thus
3.3.
Market timing performance measurement model
Henriskson and Merton (1981) developed a model that allows evaluation market timing and selectivity skill
simultaneously. It removes the biases in Jensen’s performance co-efficient which ignores market timing activities of fund managers. Hence, it is important to consider timing and selectivity performance simultaneously in fund performance evaluation which is the important feature of HM Model. According to HM model, the fund beta would take only two values, large value when the market is expected to do well (Rm› Rf) and a small value otherwise. This in other words means that the fund manager is expected to increase its exposure to equities when the market performs well, otherwise reduce its exposure to equities when the market is expected to do poorly. The relationship is estimated by using a dummy variable in the regression equation which is given as under:
Rpt - Rft= α+ β (Rmt–Rft) + γ [Dt(Rmt– Rft) ] + ept Where: Rpt= Mean annual daily return of the scheme
Rft= Mean annual weekly risk-free rate of return Rmt = Mean annual daily return of the market portfolio
Dt = Dummy variable that is taken equal to zero when (Rm› Rf) and (-1) otherwise ept = The random error term
Here, α, β, and γ are the parameters of the above stated regression equation. The ‘α’ which is called the intercept measures the stock selection skills of fund managers. A positive and statistically significant ‘α’ indicates a superior
stock selection performance of fund managers and vice versa.
The above regression gives two betas (β), one for the up-market and the other for the down market, Therefore, ‘γ’ co-efficient, refers to the beta differentials in the above equation, Hence the intercept of the quadratic regression ‘γ’ co-efficient which is also referred to as Gamma, captures market timing performance of fund managers. A
statistically significant positive ‘γ’ co-efficient implies superior marketing performance. While a statistically
insignificant negative value of ‘γ’ co-efficient indicates failure on the part of fund managers to time market
correctively. Conversely, a statistically significant negative ‘γ’ co-efficient implies that the fund manager has timed the market but in a wrong direction.
The hypothesis test is performed on the data set collected from the database of Association of Mutual Funds in India for Net Asset Value (NAV), National Stock Exchange (NSE) for S&P CNX Nifty and Reserve Bank of India (RBI) for risk free rate. The fund returns were calculated on the basis of daily NAVs for the reason that the past research has revealed that the high frequency data such as daily NAVs have more revealing power than less frequency data.
Also, the daily yields obtained were annualized using geometric averaging to obtain average annual fund return. The yields on 91-day treasury bills issued by RBI have been used as a proxy for risk-free return. Besides, S&P CNX Nifty is used as surrogate for the market return as well as for bench-mark variability.
The fact that there were huge number of schemes in existence through the period of the study, it was not possible to study all the schemes. In view of this fact, an adequate and representative sample was drawn from the universe using convenience sampling technique.
Besides, the availability of consistent data during the study period from 1st April 2007 to 31st March 2011 was available for forty schemes out of five hundred eighty seven schemes that accounts for around seventy percent of the total schemes. The schemes belong to nineteen fund houses consisting of all the three sectors i.e. public, private and foreign sector funds.
time performance. The period of study is five years. The rationale for selecting the study period of 5-years is because of two reasons. During this period, the stock market experienced higher volatility, as such chosen to find-out whether the funds have succeeded in surpassing the market performance even under depressed market conditions. Also, the five years are long enough to capture different market phases and to draw meaningful conclusions.
3.4.
Objectives of the Study
The study is aimed to achieve the following specific objectives:
To study the consistency in the selection performance of fund managers To study the consistency in the timing performance of fund managers.
3.5.
Hypothesis
In line with the above stated objectives, the following hypotheses are set to provide a direction to the study: H1: There exists persistence in the timing performance of fund managers
H2: There exists persistence in the selection performance of fund managers .
4.
Discussion And Findings
In the present study, the phenomenon of performance persistence in mutual funds using a sample that contains the schemes that belong to 19 fund houses involving all the three sectors i.e. public, private, and foreign sector. The analysis is conducted through two dimensional approach i.e. assessing the persistence in selectivity performance and measuring persistence in terms of timing skills of the fund managers. For the selectivity two models are used one by Fama and another by Jensen.
4.1. Persistence in Selectivity Performance
To comment about the selectivity performance of fund managers using mean Jensen Alpha or mean Fama’s net
selectivity for the study period as a whole is meaningful. But more important issue is the persistence in manager’s ability to select stocks and to time risk factors. A fund manager who comes out successful today, whether he/she will be able to repeat the same performance in future consistently, is a matter of concern to the fund investors and other stake holders.
Rather to conclude about the stock picking ability of fund managers, one would be interested in knowing whether there is consistency in selectivity performance or not. If a fund manager is able to deliver better performance consistently i.e. quarter-after-quarter or year-after-year, then his or her performance in selecting the right type of stocks for the portfolio would be considered satisfactory.
[image:6.595.65.553.649.726.2]Conversely if the fund manager’s performance varies significantly from period to period, then it would be an indication that there is something wrong with his/her stock selection skills or market timing ability. As per the standard practice, a fund manager is expected to perform better than the market and more importantly perform consistently. Hence it is imperative to analyze the persistence in the stock selection performance of fund managers.
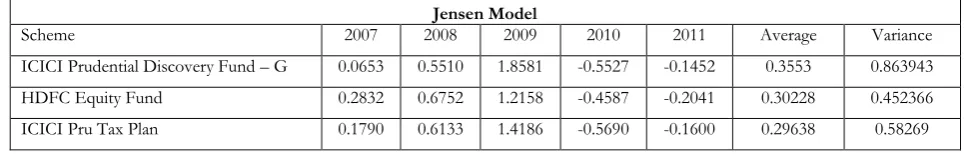
Table 1: Persistence in selectivity performance of sample fund managers
Jensen Model
Scheme 2007 2008 2009 2010 2011 Average Variance ICICI Prudential Discovery Fund – G 0.0653 0.5510 1.8581 -0.5527 -0.1452 0.3553 0.863943 HDFC Equity Fund 0.2832 0.6752 1.2158 -0.4587 -0.2041 0.30228 0.452366
Reliance Growth Fund 0.3920 0.5733 1.3139 -0.6307 -0.1846 0.29278 0.552982
Franklin India Bluechip Fund 0.2566 0.8182 1.0142 -0.5342 -0.1483 0.2813 0.418903
Baroda Pioneer Growth 0.4731 0.8285 0.9159 -0.5911 -0.2545 0.27438 0.446714
Reliance Regular Savings Fund 0.2963 0.7375 1.0888 -0.5985 -0.1567 0.27348 0.456496
Birla Sun Life Frontline Equity 0.2520 0.7401 1.0576 -0.5324 -0.1855 0.26636 0.423223
HDFC Tax Saver Fund 0.2202 0.6212 1.1964 -0.5451 -0.1816 0.26222 0.463017
Tata Pure Equity Fund 0.3556 0.6783 0.9619 -0.6182 -0.1522 0.24508 0.404202
Tata Tax Advantage Fund 0.3562 0.5946 0.9392 -0.5268 -0.1428 0.24408 0.34064
Principal Index Fund 0.3243 0.8755 0.7372 -0.5528 -0.1794 0.24096 0.36565
Quantum Long-Term Equity Fund 0.1459 0.4503 1.0377 -0.4478 0.0095 0.23912 0.3039
Sundaram Growth Fund 0.3984 0.6005 0.9542 -0.5768 -0.1970 0.23586 0.380794
UTI - Opportunities Fund 0.4719 0.1874 1.0678 -0.5344 -0.0160 0.23534 0.35173
Fidelity Equity Fund 0.1644 0.7111 0.9713 -0.4881 -0.1955 0.23264 0.370492
L&T Growth Fund 0.2107 0.7761 0.8958 -0.5355 -0.1850 0.23242 0.375018 ING Core Equity Fund –Growth 0.2148 0.7515 0.8770 -0.5294 -0.1947 0.22384 0.361918 Birla Sun Life Top 100 Fund – Growth 0.1131 0.6959 0.9134 -0.5134 -0.1540 0.211 0.349015 Sundaram Select Focus 0.4836 0.6001 0.7937 -0.6077 -0.2206 0.20982 0.355448
Morgan Stanley Growth Fund 0.1657 0.7097 1.0100 -0.6142 -0.2399 0.20626 0.443327
ING Tax Savings Fund 0.0028 0.5740 1.1793 -0.5002 -0.2322 0.20474 0.453689
Baroda Pioneer ELSS 0.3099 0.6164 0.9686 -0.6539 -0.2245 0.2033 0.421376
UTI - Growth Retail 0.2348 0.5806 0.8917 -0.5186 -0.1805 0.2016 0.321417
HSBC Equity Fund 0.4195 0.6708 0.6449 -0.5682 -0.2050 0.1924 0.305409
LIC Nomura Mf Equity Fund 0.1117 0.8036 0.7742 -0.5572 -0.2220 0.18206 0.362916
Sahara Growth Fund 0.2827 0.6151 0.7923 -0.6433 -0.2101 0.16734 0.350993
ING Balanced Fund (D) 0.2667 0.6385 0.6575 -0.5827 -0.1773 0.16054 0.288307
LIC Nomura Mf India Vision Fund (D) 0.4904 0.5047 0.5528 -0.5890 -0.2078 0.15022 0.269518
SBI Magnum NRI-Flexi Asset (D) B 0.2205 0.5622 0.7168 -0.5802 -0.2162 0.14062 0.290749
SBI One India Fund -0.0542 0.5556 0.8404 -0.6320 -0.1764 0.10668 0.347885
Kotak 50 Growth 0.3298 0.6074 0.7128 -0.9292 -0.2164 0.10088 0.461286
JM Balanced Fund - (D) 0.0896 0.4635 0.4940 -0.6130 -0.1695 0.05292 0.214348
Principal Personal Tax Saver Fund -0.1842 0.4525 1.0608 -0.9938 -0.2761 0.01184 0.606788 Quantum Liquid Fund – Growth 0.1687 0.4055 0.1604 -0.5981 -0.1425 -0.0012 0.14916 Kotak Equity Arbitrage Growth 0.1867 0.3730 0.1698 -0.5934 -0.1454 -0.00186 0.144016
Templeton India TMA 0.1712 0.4012 0.1586 -0.6040 -0.1440 -0.0034 0.15023
SBI Arbitrage Opportunities Fund 0.1845 0.3694 0.1692 -0.6007 -0.1403 -0.00358 0.144896
Source: AMC reports, NSE historical data and RBI reports
Table 1.1: ANOVA single factor test (Jensen model)
Source of Variation SS Df MS F P-value F critical Between Groups 2.0853694 39 0.053471 0.142557 1 1.475066 Within Groups 60.013624 160 0.375085
Total 62.098994 199
The above mentioned table 1.1 of ANOVA single factor test shows the F critical value 1.475 and F value is 0.1425 which means that F value is less than F critical value which depicts that the means of the five populations are almost
equal. It also reveals that there is consistency in the fund manager’s skills of selectivity according to the Jensen’s
[image:8.595.70.563.339.723.2]model so we accept the hypothesis: H2: There exist persistence in the selection performance of fund managers.
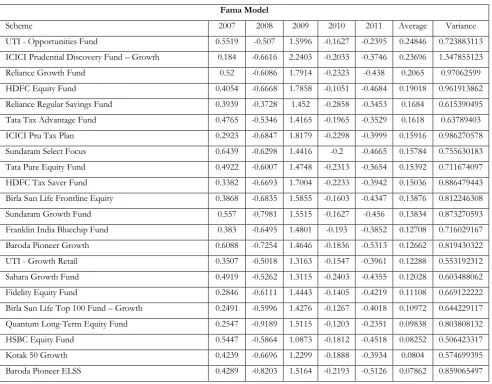
Table 2: Persistence in selectivity performance of sample fund managers
Fama Model
Scheme 2007 2008 2009 2010 2011 Average Variance
UTI - Opportunities Fund 0.5519 -0.507 1.5996 -0.1627 -0.2395 0.24846 0.723883113 ICICI Prudential Discovery Fund – Growth 0.184 -0.6616 2.2403 -0.2033 -0.3746 0.23696 1.347855123 Reliance Growth Fund 0.52 -0.6086 1.7914 -0.2323 -0.438 0.2065 0.97062599
HDFC Equity Fund 0.4054 -0.6668 1.7858 -0.1051 -0.4684 0.19018 0.961913862
Reliance Regular Savings Fund 0.3939 -0.3728 1.452 -0.2858 -0.3453 0.1684 0.615390495
Tata Tax Advantage Fund 0.4765 -0.5346 1.4165 -0.1965 -0.3529 0.1618 0.63789403
ICICI Pru Tax Plan 0.2923 -0.6847 1.8179 -0.2298 -0.3999 0.15916 0.986270578
Sundaram Select Focus 0.6439 -0.6298 1.4416 -0.2 -0.4665 0.15784 0.755630183
Tata Pure Equity Fund 0.4922 -0.6007 1.4748 -0.2313 -0.3654 0.15392 0.711674097
HDFC Tax Saver Fund 0.3382 -0.6693 1.7004 -0.2233 -0.3942 0.15036 0.886479443
Birla Sun Life Frontline Equity 0.3868 -0.6835 1.5855 -0.1603 -0.4347 0.13876 0.812246308
Sundaram Growth Fund 0.557 -0.7981 1.5515 -0.1627 -0.456 0.13834 0.873270593
Franklin India Bluechip Fund 0.383 -0.6495 1.4801 -0.193 -0.3852 0.12708 0.716029167
Baroda Pioneer Growth 0.6088 -0.7254 1.4646 -0.1836 -0.5313 0.12662 0.819430322
UTI - Growth Retail 0.3507 -0.5018 1.3163 -0.1547 -0.3961 0.12288 0.553192312
Sahara Growth Fund 0.4919 -0.5262 1.3115 -0.2403 -0.4355 0.12028 0.603488062
Fidelity Equity Fund 0.2846 -0.6111 1.4443 -0.1405 -0.4219 0.11108 0.669122222 Birla Sun Life Top 100 Fund – Growth 0.2491 -0.5996 1.4276 -0.1267 -0.4018 0.10972 0.644229117 Quantum Long-Term Equity Fund 0.2547 -0.9189 1.5115 -0.1203 -0.2351 0.09838 0.803808132
HSBC Equity Fund 0.5447 -0.5864 1.0873 -0.1812 -0.4518 0.08252 0.506423317
Kotak 50 Growth 0.4239 -0.6696 1.2299 -0.1888 -0.3934 0.0804 0.574699395
Source: AMC reports, NSE historical data and RBI reports
The issue of persistence in fund manager’s ability to select undervalued stocks has two dimensions. First, one can ask
if some managers who did particularly well or poorly in the past quarter/year continues to do so in the next, that is, one can examine if there is persistence in general. The second question is if managers exhibit persistence in general, that is, no matter what the performance over the previous quarter/year was, it remains unchanged or is better in the next. In this study we check persistence by addressing both of these questions.
To test for persistence in the stock selectivity performance of sample fund managers, across the two measurement criterion namely Jensen (1968) and Fama (1972), we have calculated yearly Alpha’s and also assigned ranks to each fund on the basis of the excess return (Alpha)- The said data is presented in table 1, the perusal of which reveals short term persistence (i.e. in the first three years) in terms of first question defined above i.e. whether the managers repeat the past performance with positive selectivity performance, in case of all the sample forty funds except three funds namely, SBI One India, Principal Personal Tax Saver Fund and Sahara Growth Fund-Div. However, with respect to the long term persistence i.e. for all the five years, none of the sample funds have shown persistence in
their performance as during the first three years most of the sample funds have reported positive alpha’s and in the
last two years of the period under study i.e. for 2010 and 2011, all the sample funds have reported negative alpha’s. As such it can be inferred that fund managers have failed to perform well consistently in the long run.
As already stated that the other way to look into the persistence in performance is that if managers exhibit persistence in performance in general i.e. no matter what the performance over the previous year was, it improves or remains unchanged in the next, In terms of this question, during the short run i.e. first 3- years of the period under
Morgan Stanley Growth Fund 0.2967 -0.7946 1.5467 -0.2028 -0.4685 0.0755 0.835954945
L&T Growth Fund 0.3625 -0.8747 1.4664 -0.1492 -0.4325 0.0745 0.807100235
Principal Index Fund 0.4675 -0.8154 1.3121 -0.1351 -0.4645 0.07292 0.703116362
ING Tax Savings Fund 0.1339 -0.9205 1.6704 -0.1207 -0.4468 0.06326 0.962418803
ING Core Equity Fund -Growth 0.3523 -0.8214 1.3472 -0.1413 -0.4433 0.0587 0.703253305
SBI Magnum NRI Investment Fund-Flexi Asset (D) B 0.3281 -0.7255 1.2858 -0.2642 -0.3416 0.05652 0.614450287 Sahara Growth Fund – Div 0.1003 -0.5236 1.3108 -0.2118 -0.4211 0.05092 0.552908477 ING Balanced Fund (D) 0.3678 -0.4882 1.0184 -0.325 -0.351 0.0444 0.40743096
LIC Nomura Mf Equity Fund 0.2766 -0.8012 1.3256 -0.1457 -0.4881 0.03344 0.682380823
LIC Nomura Mf India Vision Fund (D) 0.6523 -0.8912 1.0179 -0.1696 -0.4951 0.02286 0.631782103
SBI One India Fund 0.0598 -0.797 1.4278 -0.2464 -0.396 0.00964 0.723615548
Equity Arbitrage Growth 0.1899 0.3506 0.184 -0.5557 -0.1608 0.0016 0.131871175
SBI Arbitrage Opportunities Fund 0.1872 0.3505 0.1786 -0.5602 -0.1534 0.00054 0.131786548
Quantum Liquid Fund – Growth 0.1694 0.3992 0.1625 -0.5928 -0.1449
-0.00132
0.146715597
Templeton India TMA 0.1719 0.3952 0.1607 -0.5988 -0.1465 -0.0035 0.147879895
Principal Personal Tax Saver Fund -0.0377 -0.794 1.4852 -0.2181 -0.4756
-0.00804
0.777779023
HSBC Cash Fund 0.1719 0.3778 0.1431 -0.5994 -0.158 -0.01292
0.144042447
JM Balanced Fund - (D) 0.1928 -0.7073 0.985 -0.2569 -0.3668
-0.03064
study 30 sample funds i.e. 75 percent of the sample fund have exhibited persistence in general. But in the long run i.e. during the entire study period, none of the sample funds have exhibited persistence in general as in case of all the
sample funds the alpha’s were positive in the first three years then negative in the last two years. What emerges from
the above is that 75 percent of the sample funds have exhibited persistence in general in first three years of the time series but no such persistence for the entire time series.
The table 2 presents year-wise Fama’s Net Selectivity along with the ranks occupied by each fund. It can be observed from the data contained in the above referred table that all the sample 40 funds except four funds namely SBI Arbitrage Opportunity Fund, HSBC Cash Fund, Templeton India TMA and Quantum Liquid Fund- Growth have reported neither short term (2007-09) nor long run i.e. for the entire study period persistence in stock selectivity performance based on Fama’s Net Selectivity. The above mentioned four sample funds have reported persistence only for the first three years of the study period. However, when one looks into the entire period of study, these four funds have also exhibited either little or no persistence. With respect to the persistence in general terms; none of the funds have exhibited persistence in general terms (i.e. no matter what the performance over the previous year was, it remains unchanged in the next). It can also be seen from the above referred table that on the basis of Fama’s Net Selectivity, none of the sample funds have shown persistence in selectivity performance but during the last two years of time series, all the sample funds have consistently reported negative net selectivity performance.
What emerges from the above discussion on persistence of selectivity performance is that on the basis of Jensen Alpha majority of the funds reported persistence in selectivity performance in the short run. But in the longer run i.e. for the entire time series no such persistence in selectivity performance has been observed for the sample funds.
However, on the basis of Fama’s Net selectivity, no persistence neither in the short run nor in the long run in the
selectivity of performance of fund managers of sample funds has been observed. Lack of persistence is indicative of the fact that the fund managers have failed in picking up under -valued stocks consistently which in turn implies poor selectivity performance on the part of sample fund managers during the period under study.
Short run persistence was observed on the basis of Jensen alpha but no such persistence has been found with respect
to Fama’s Net Selectivity, as such the hypothesis set in this regard for the study is rejected. Besides, no relative persistence over the longer run has been observed across both the measurement criterion, therefore the hypothesis that there is no persistence in the selectivity performance of fund managers across both the criterion is accepted. The finding about the existence of short term persistence in selectivity performance based on Jensen alpha corresponds with the findings of Benjamini and Hochberg (1995); Benjamini and Yekutieli (2001); and Storey (2002). A common conclusion in the literature, however, is that expect for the very best fund managers, persistence primarily exists among poor performers Carhart (1997). The similar finding emerges from the present study i.e. poor performers namely HSBC Cash, Quantum Liquid fund-growth, SBI Arbitrage opportunity fund and Templeton India. TNA which have performed poorly compared to other sample funds, have been found to report persistence in selectivity performance, however, in the short run only.
Table 2.1: ANOVA single factor test (Fama Model)
Source of Variation SS df MS F P-value F critical Between Groups 0.990902 39 0.025408 0.03826 1 1.475066 Within Groups 106.2519 160 0.664075
Total 107.2428 199
The above mentioned table 2.1 of ANOVA single factor test shows the F critical value 1.475 and F value is 0.0382 which means that F value is less than F critical value which depicts that the means of the five populations are almost
equal. It also reveals that there is consistency in the fund manager’s skills of selectivity as per the Fama’s model so we
accept the hypothesis: H2: There exist persistence in the selection performance of fund managers.
4.2. Persistence in Timing Performance
Showing timing performance persistently is the real test for a fund manager. A fund manager is expected to time the market successfully every time. Only such managers would be able to deliver superior abnormal returns to unit holders, who perform consistently. A fund manager who comes out successful once, whether to maintain same standard is of prime concern to different stake holders. Therefore, if one has to comment on the timing ability of fund managers, one should see that whether the manager has been able to time the market successful, if not every time but at least most of the times. It is in view of this fact that an effort has been made to also study the persistence in the timing performance of sample fund managers by assessing the consistency in their timing abilities. The table 3
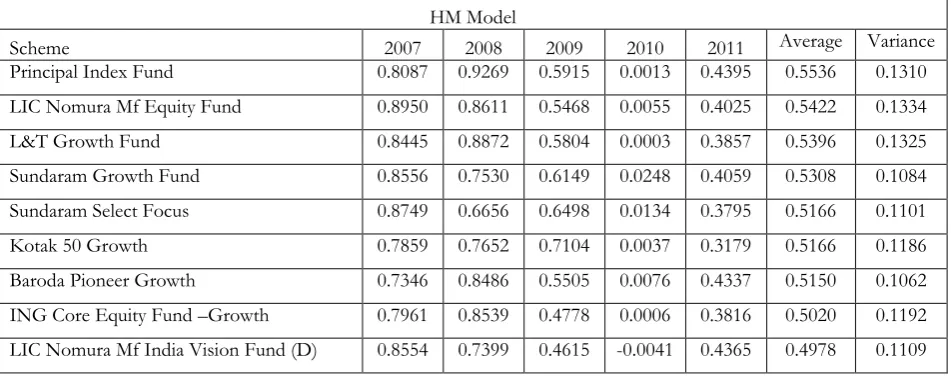
presents the ‘y’ co-efficient of each sample fund on yearly basis. It becomes clear from the above referred table that 33 funds or 82.5 percent of the sample funds have shown positive ‘γ co-efficient’ for all the five years. Three funds namely LIC Nomura MF India Vision Fund (D), HDFC Equity Fund and SBI Magnum NRI Investment Fund-
Flexi Asset (D) Balanced have reported positive ‘ γ’ co-efficient in all the years except in 2010. During 2010, ‘γ’ co -efficient were very low for all the sample funds as compared to other years. This is perhaps that like other world equity markets, Indian equity market was in deep recession in the year 2010 due to global economic crisis. It can be seen that the performance of the sample funds was at its best in the year 2007 and 2008, which declined in 2009 and reached at its lowest level in 2010, however, shown marked improvement in 2011 across the board.
Table 3: Persistence in market timing performance of sample fund managers
HM Model
[image:11.595.61.537.525.713.2]Source: AMC reports, NSE historical data and RBI reports
Principal Personal Tax Saver Fund 0.8592 0.7269 0.4862 0.0137 0.3832 0.4938 0.1077 SBI One India Fund 0.6491 0.7319 0.7118 0.0379 0.3336 0.4929 0.0905 Baroda Pioneer ELSS 0.6407 0.7780 0.5581 0.0295 0.4567 0.4926 0.0809 HDFC Equity Fund 0.6703 0.6913 0.6807 -0.0032 0.4141 0.4906 0.0896 Birla Sun Life Frontline Equity 0.7483 0.7686 0.5220 0.0053 0.3905 0.4869 0.0975 Morgan Stanley Growth Fund 0.7267 0.8138 0.5322 0.0306 0.3239 0.4854 0.1003 Sahara Growth Fund 0.8942 0.5748 0.5124 0.0670 0.3297 0.4756 0.0937 Birla Sun Life Top 100 Fund – Growth 0.7574 0.6908 0.5208 0.0119 0.3872 0.4736 0.0876 Franklin India Bluechip Fund 0.7062 0.7987 0.4698 0.0146 0.3735 0.4726 0.0951 Tata Pure Equity Fund 0.7535 0.6937 0.5111 0.0290 0.3294 0.4633 0.0865 HDFC Tax Saver Fund 0.6417 0.6886 0.6059 0.0151 0.3352 0.4573 0.0800 Quantum Long-Term Equity Fund 0.6068 0.7040 0.5600 0.0258 0.3779 0.4549 0.0716 ING Tax Savings Fund 0.6968 0.7797 0.4746 0.0011 0.3187 0.4542 0.0972 Fidelity Equity Fund 0.6923 0.7212 0.4790 0.0076 0.3523 0.4505 0.0846 HSBC Equity Fund 0.6931 0.6808 0.4573 0.0195 0.3835 0.4468 0.0755 Reliance Growth Fund 0.6885 0.6274 0.4688 0.0246 0.3911 0.4401 0.0682 SBI Magnum NRI Investment Fund-Flexi
Asset (D) Balanced 0.5986 0.6891 0.6940 -0.0014 0.1675
0.4296 0.1051
During the study all the sample funds recorded neither increasing nor decreasing trend in ‘γ’ co-efficient but a fluctuating trend. The other thing that can be observed from the above table is that five funds namely Templeton India TMA, Quantum Liquid Fund- Growth, HSBC cash Fund, Kotak Equity Arbitrage - Growth and SBI
Arbitrage opportunities Fund have reported negative ‘γ’ co-efficient for all the five years of study period. This in other words means that these funds have performed badly throughout the study period.
[image:13.595.89.508.327.390.2]What emerges from the above is that majority of the sample funds have shown persistence in their superior performance during the entire period of study, compared to the consistent timing performance, the sample fund managers have failed to report consistency in their selectivity performance. The γ co-efficient were positive and statistically significant even at 1 percent level for all the five years which reinforces the above finding of persistence in market timing performance of sample fund managers. Thus the hypothesis that the Indian Fund Managers lack persistence in market timing performance is accepted. The finding of not persistence of market timing performance is in not in conformity with the findings of a study viz. Chance and Hemler, (2001) but similar to the study like Bollen and Busse (2001).
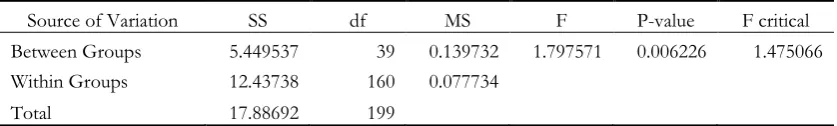
Table 3.1: ANOVA single factor test (HM Model)
Source of Variation SS df MS F P-value F critical Between Groups 5.449537 39 0.139732 1.797571 0.006226 1.475066 Within Groups 12.43738 160 0.077734
Total 17.88692 199
The above mentioned table 3.1 of ANOVA single factor test shows the F critical value 1.475 and F value is 1.797 which means that F value is more than F critical value which depicts that the means of the five populations are not equal. It also reveals that there is no consistency in the fund manager’s skills of timing as per the HM model so we
don’t accept the hypothesis: H1: There exist persistence in the selection performance of fund managers.
5.
Conclusion
The primary focus of the study is the performance persistence of the fund managers taken into account both selection and timing skills of mutual fund. Using the models by Jensen (1968), Fama (1972) and Henriksson & Merton (1981) for calculations of five years yield of alpha and gamma for the select sample. The year wise returns were tested to check the hypothesis using ANOVA single factor test for all the three models were used. And it was found that the sample fund do possess the persistence in selectivity skills while checking for both Jensen and Fama model. While as the same funds failed to keep the consistency in terms of the timing skills for the duration of the study into consideration. So it is comprehended that the fund managers possessing selectivity skills consistently, need necessarily not possess the timing skills and vice versa. The study implies that the fund mangers in India should stress more on timing skills and exhibit consistency in the performance. Though the paper has limitations in terms of the scope of the study restricted to forty schemes and time period of the research is five years which the future researchers can take into consideration.
References
Benjamini, Y., & Hochberg, Y. (1995). Controlling the false discovery rate: a practical and
powerful approach to multiple testing. Journal of the royal statistical society. Series B
(Methodological), 289-300.
Benjamini, Y., & Yekutieli, D. (2001). The control of the false discovery rate in multiple testing
under dependency. Annals of statistics, 1165-1188.
Berk, J. B., & Green, R. C. (2004). Mutual fund flows and performance in rational markets.
Journal of political economy, 112(6), 1269-1295.
Bollen, N. P., & Busse, J. A. (2001). On the timing ability of mutual fund managers. The Journal
of Finance, 56(3), 1075-1094.
Bollen, N. P., & Busse, J. A. (2005). Short-term persistence in mutual fund performance. Review
of Financial Studies, 18(2), 569-597.
Brown, S. J., & Goetzmann, W. N. (1995). Performance persistence. The Journal of finance,
50(2), 679-698.
Carhart, M. M. (1997). On persistence in mutual fund performance. The Journal of finance,
52(1), 57-82.
Chance, D. M., & Hemler, M. L. (2001). The performance of professional market timers: daily
evidence from executed strategies. Journal of Financial Economics, 62(2), 377-411.
Christensen, M. (2005). Danish mutual fund performance-selectivity, market timing and
persistence.
Chung, C. Y., Ryu, D., Wang, K., & Zykaj, B. B. (2017). Optionable Stocks and Mutual Fund
Performance. Journal of Futures Markets.
Daniel, K., Grinblatt, M., Titman, S., & Wermers, R. (1997). Measuring mutual fund performance
with characteristic
‐
based benchmarks. The Journal of finance, 52(3), 1035-1058.
Elton, E. J., Gruber, M. J., & Blake, C. R. (1995). The persistence of risk-adjusted mutual fund
performance.
Fama, E. F. (1972). Components of investment performance. The Journal of finance, 27(3),
551-567.
Goetzmann, W. N., & Ibbotson, R. G. (1994). Do winners repeat?. The Journal of Portfolio
Management, 20(2), 9-18.
Hendricks, D., Patel, J., & Zeckhauser, R. (1993). Hot hands in mutual funds: Short
‐
run
persistence of relative performance, 1974
–
1988. The Journal of finance, 48(1), 93-130.
Henriksson, R. D. (1984). Market timing and mutual fund performance: An empirical
investigation. Journal of business, 73-96.
Jensen, M. C. (1968). The performance of mutual funds in the period 1945
–
1964. The Journal of
finance, 23(2), 389-416.
Pandow, B. (2016). Market Timing Ability of Fund Managers in India: An Analysis. Journal of
Accounting, Finance and Auditing Studies 2(4), 172-194.
Pandow, B. (2016). Selection Abilities of Select Indian Mutual Fund Managers. Global Journal of
Management And Business Research, 16(8).
Pandow, B. A., & Butt, K. A. B. (2017). Risk and Return Analysis of Mutual Fund Industry in
India. International Research Dynamics of Economics, 1(1), 8-19.
Rao, Z. U. R., Tauni, M. Z., & Iqbal, A. (2017). Emerging market mutual fund performance:
Evidence for China. Journal of Asia Business Studies, 11(2).
Sharpe, W. F. (1966). Mutual fund performance. The Journal of business, 39(1), 119-138.
Storey, J. D. (2002). A direct approach to false discovery rates. Journal of the Royal Statistical
Society: Series B (Statistical Methodology), 64(3), 479-498.
Tonks, I. (2005). Performance persistence of pension
‐
fund managers. The Journal of Business,
78(5), 1917-1942.