Thermoelectric and Magnetic Properties of Pr
1¹xSr
xMnO
3(0.1
³
x
³
0.7)
Hiroshi Nakatsugawa
1,+1, Masaki Kubota
1,+2and Miwa Saito
21Graduate School of Engineering, Yokohama National University, Yokohama 240-8501, Japan
2Department of Materials and Life Chemistry, Faculty of Engineering, Kanagawa University, Yokohama 221-8686, Japan
In this study, polycrystalline samples of Pr1¹xSrxMnO3(0.1¼x¼0.7) were synthesized using a conventional solid-state reaction method. We investigated crystal structure, magnetic susceptibility (»), and thermoelectric properties, such as electrical resistivity (μ), Seebeck coefficient (S), and thermal conductivity (¬), as a function of temperature (T) or Sr content (x). The crystal structure at room temperature changed from orthorhombicPbnmphases, withx¼0.4, to tetragonalI4/mcmphases, withx½0.5. The samples forx¼0.5 showed the ferromagnetic-like ground state below Curie temperature. Conversely, the samples forx=0.5, 0.6, and 0.7 showed the charge-ordering ground state below 160 K, the A-type antiferromagnetic ground state below 310 K, and the C-type antiferromagnetic ground state below 318 K, respectively. Above room temperature, all the samples exhibited adiabatic small polaron conduction in a competition between the double exchange interaction and the Jahn-Teller distortion. Although the samples forx=0.1 and 0.2 showed a large positiveSbelow room temperature, the carrier type changed from hole-like to electron-like behavior above 1000 K and 500 K, respectively. Thus, all the samples for 0.1¼x¼0.7 showed a negativeSat a high temperature. The largest dimensionlessfigure of merit (ZT) of all the samples above room temperature was 0.085 at 1073 K forx=0.7, by a decrease in bothμand lattice¬, and an increase inS. In addition, we obtained the largestZTin the p-type specimens forx=0.1, thus, attaining a maximum value of 0.0035 at 468 K. We discuss this behavior in terms of the potentiality to fabricate the oxide thermoelectric modules consisting of the same type of elements. [doi:10.2320/matertrans.E-M2015807]
(Received December 8, 2014; Accepted March 24, 2015; Published May 25, 2015)
Keywords: thermoelectric properties, magnetic properties, adiabatic small polaron conduction, double exchange interaction, Jahn-Teller distortion, Heikes formula
1. Introduction
Thermoelectric energy conversion technology attracts renewed interest as a new energy resource.1)Thermoelectric
materials can directly convert waste heat from automobiles, facilities, and power plants into electrical energy. Since electrons in solids carry electricity together with thermal entropy, there is a finite coupling between the electrical and heat currents, which is known as the thermoelectric phenomena. The potentiality of thermoelectric materials is indicated in terms of the dimensionless figure of merit, i.e., ZT=S2·T/¬, where S, ·, ¬, and T are the Seebeck coefficient, the electric conductivity, the thermal conductivity, and the absolute temperature, respectively. In addition, the thermoelectric energy conversion generates energy from the temperature gradient and the heat flow. The thermoelectric energy conversion efficiency © is defined by the ratio between the output electrical powerP with the heatfluxQ, i.e., ©=P/Q. By optimizing the efficiency with respect to load resistance, the maximum efficiency©maxis obtained as a
monotonically increasing function of ZT and increases with increasing a temperature difference at a high temperature. In this respect, therefore, oxides are quite attractive because they are thermally and chemically stable for long time use at high temperatures in air for thermoelectric conversion.
Recently, oxides have been studied extensively as a possible candidate for thermoelectric materials at high temperatures (above 1000 K) since the discovery of large Seebeck coefficient (S=100 µV/K) and low electric resis-tivity (μ=20m³m) at room temperature in the layered cobalt oxide NaxCoO2.2) Furthermore, the misfit-layered
cobalt oxide Ca3Co4O9 has been studied as a candidate for
p-type thermoelectric materials and typically exhibits S=
130 µV/K, μ=150m³m, and ¬=1.0 W/mK at room temperature.3) For instance, fabrication of power generation using oxide thermoelectric module consisting of p-type Ca2.7Bi0.3Co4O9 and n-type La0.9Bi0.1NiO3 bulks have been
reported.4)In fact, power charging a portable phone has been
successful using this oxide thermoelectric module though the maximum efficiency ©max was as low as 1.4%.5) To
enhance©max, Urataet al.6)have built thermoelectric modules
consisting of p-type Ca2.7Bi0.3Co4O9 and n-type CaMn0.98
-Mo0.02O3 bulks and calculated ©max to be 2.0% from ZT
values. However, the n-type elements were damaged by thermal stress between the alumina substrate and the element.6)To overcome such a lack of oxide thermoelectric materials, we have paid attention to perovskite-type oxides which can form both n-type and p-type conductors with the general formula ABO3.
Perovskite-type oxides such as titanate,7) manganate,8) ferrate,9) and cobaltate10) phases reveal a large Seebeck
coefficient, S, which is one of the essential prerequisites for potential thermoelectric materials. The large S values are caused by a strong interplay between charges, orbital, spin states, and crystal structure. Koshibaeet al.11)proposed that
the high-temperature limit ofS values in 3d transition metal oxides is given by Heikes formula from a localized picture. When a degeneracy of spin and orbital degrees of freedom in 3d transition metal ions gives large value, the largeScan be expected. Therefore, control of spin and orbital states of 3d transition metal ions would improve the ZT values of thermoelectric oxides. In this sense, electron-doped manga-nates showed promising n-type thermoelectric properties at high-temperatures,8,1218) although perovskite-type Mn ox-ides have been already widely studied due to their colossal magnetroresistance (CMR) at low-temperature,19,20) which
was explained by a competition between the double exchange (DE) interaction21) and the Jahn-Teller (JT) distortion of
MnO6 octahedra.22) For polycrystalline n-type Ca0.9Yb0.1
-+1Corresponding author, E-mail: naka@ynu.ac.jp
MnO3, D. Flahaut et al.17)reported the ZT value of 0.16 at
1000 K in air. However, there is remarkably little known about the p-type thermoelectric properties in manganates. In the present study, we prepared polycrystalline samples of Pr1¹xSrxMnO3(0.1¼x¼0.7), and investigate p- and n-type
thermoelectric properties by taking account of the effect of Sr-doping on both crystal structures and magnetic properties in order to clarify theZTvalues of the materials.
2. Experimental Procedure
Polycrystalline samples of Pr1¹xSrxMnO3 (0.1¼x¼0.7)
were synthesized by a conventional solid-state reaction method. The compounds starting from stoichiometric mix-tures of Pr6O11 (99.9%, Wako Pure Chemical Industries,
Ltd.), SrCO3(99.99%, Wako Pure Chemical Industries, Ltd.),
and Mn2O3(99.9%, Kojundo Chemical Laboratory Co., Ltd.)
in an agate mortar with ethanol were calcinated at 1373 K for 24 h in air. The calcined powders were pressed into pellets under a pressure of 16 MPa and sintered in pure flowing nitrogen gas at 1673 K for 48 h. The pellets were cooled down to room temperature in the furnace. Powder X-ray diffraction (XRD) data were collected with a diffractometer (RINT2500, Rigaku Co.) using CuK¡ (=1.542¡) radia-tion with a pyrolytic graphite monochromator at room temperature. Crystal structure parameters were refined by the Rietveld analysis using the RIETAN-FP program23)with
XRD data in 2ª range from 10° to 90° with a scan step of 0.02°.
The resistivity μ was measured by a van der Pauw technique in the temperature range from 80 to 395 K using a commercial apparatus (ResiTest8300, TOYO Co.) and by the direct-current four-probe method in the temperature range from 373 to 1073 K using a ZEM-3 apparatus (ULVAC-RIKO Co.). The Seebeck coefficientSwas measured using a steady-state technique in the temperature range from 80 to 395 K by the ResiTest8300 apparatus (TOYO Co.) and in the temperature range from 373 to 1073 K by the ZEM-3 apparatus (ULVAC-RIKO Co.). S was determined by the least-squares approximation from a plot of the thermal electromotive force against the temperature difference, where the contribution of lead wires was subtracted. The Hall coefficientRHat room temperature was measured using the
ResiTest8300 apparatus (TOYO Co.) under a magnetic field of 0.85 T using the van der Pauw technique. In the evaluation of carrier concentration n, the Hall scattering factor was assumed to obey a single carrier model. Thus, n was calculated from 1/e«RH«, where e is the elementary electric
charge, and the Hall mobility ® was also calculated from
«RH«/μ.
The thermal conductivity ¬ was calculated from the thermal diffusivity ¡, the specific heat at constant volume CV, and the bulk densitydusing the relationship:¬=d¡CV.
The bulk density was measured by the Archimedes method at room temperature using a specific gravity measurement kit (SMK-401, SHIMADZU Co.). The relative density for all the samples was measured in the range about 9095%. The specific heat was determined by differential scanning calorimetry (DSC) using in the temperature range from 303 to 323 K using an X-DSC7000 apparatus (Hitachi High-Tech
Science Co.). The specific heat for all the samples was measured in the range 300700 J/(kg K). In addition, the thermal diffusivity was measured in air from 573 to 1073 K with step of 100 K, using a laser flash method (TC-7000, ULVAC-RIKO Co.). This apparatus uses both a solid-state laser (=1.06 µm) to heat one side of the polycrystalline sample and an InSb infrared detector to measure the corresponding heat increase on the back side. The method is based on the laser flash technique invented by Parker et al.24)
The magnetic susceptibility » was measured in the temperature range 5 K to room temperature using a super-conducting quantum interference device (SQUID) magne-tometer (MPMS, Quantum Design, Inc.) under zero-field cooling (ZFC) condition at a magneticfield of 0.1 T or 1 T in a warming process.
3. Results and Discussion
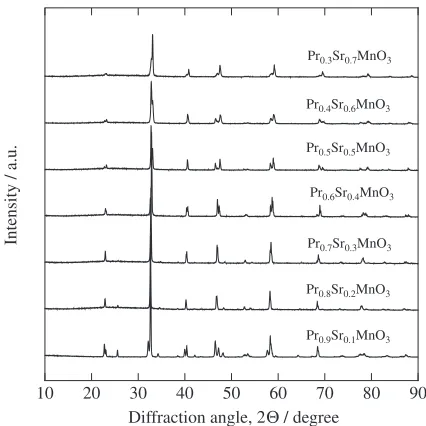
The XRD data confirm that all samples are the single phase with an orthorhombic perovskite structure of Pbnm space group for x¼0.4 and with a tetragonal perovskite structure of I4/mcm space group for x½0.5 (see Fig. 1). Tokura et al.25) reported that the three-dimensional (3D)
ferromag-netic (FM) metallic ground state shows up forx½0.3, yet the insulating charge ordering (CO) ground state sets in below the CO temperature for x=0.5. On the other hand, the ground states of samples for x>0.5 are both the A-type antiferromagnetic (AFM) ground state forx³0.550.57 with the metallic two-dimensional (2D) FM coupling in the MnO2
layers and the C-type AFM insulating ground state for x>0.6 with polaronic conductivity along the one-dimen-sional (1D) FM coupling, i.e., MnO chains.2628) Further-more, above room temperature, the crystal structure changes from orthorhombicPbnmphases with x¼0.4 to orthorhom-bic Ibmmphases with 0.4<x<0.5 and tetragonalI4/mcm phases withx½0.5.2628)Our results are consistent with prior
studies,2628)as shown in Fig. 1 and Table 1.
10 20 30 40 50 60 70 80 90
Diffraction angle, 2Θ / degree
Intensity / a.u.
Pr0.9Sr0.1MnO3
Pr0.8Sr0.2MnO3
Pr0.7Sr0.3MnO3
Pr0.6Sr0.4MnO3
Pr0.5Sr0.5MnO3
Pr0.4Sr0.6MnO3
Pr0.3Sr0.7MnO3
[image:2.595.320.533.68.281.2]The structural parameters were determined by Rietveld refinement method by using the profile analysis program RIETAN-FP23) (see Table 1). In this work, the isotropic
atomic displacement parametersBin the analysis werefixed, both of Pr/Sr sites and Mn sites were 0.5, and both of apical oxygen (O1) sites and equatorial oxygen (O2) sites were 1.0, respectively. A split pseudo-Voigt function was used tofit the Bragg peak shapes. The weighted profile reliability factors of the Rietveld refinementRwpwere in the range from about 7 to
14%. This means there is goodfitting between observed and calculated intensities. It can be seen that lattice parameters a, b, and c and unit cell volume V=abc decrease with increasing Sr content x. This is mostly because substituting Sr2+ for Pr3+ introduces Mn4+ sites in the Mn3+ matrix,
whereas the ionic radius of Mn4+ion in the high-spin (HS)
state is much smaller than that of Mn3+ ion in the HS state,
i.e., 0.530¡for Mn4+and 0.645¡for Mn3+, respectively.29)
The orthorhombic distortions, characterized by the Mn-O1 and Mn-O2 distances and the distortion angles (Mn-O1-Mn and Mn-O2-Mn), are also listed in Table 1 along with the Goldschmidt tolerance factor30) and the orthorhombicity
factor. The Goldschmidt tolerance factor for the perovskite structure ABO3 is defined by ðrAþrOÞ=pffiffiffi2ðrBþrOÞ and
represents a structural parameter describing geometric distortion. For 0.1¼x¼0.4, an increase in the tolerance factor with increasing x was observed, indicating that the MnO6octahedral distortion is suppressed with increasing x.
This distortion is also confirmed by the simultaneous decrease of the orthorhombicity factor and the fact that the crystal structure changes from the orthorhombicPbnmphases to the tetragonalI4/mcmphases.
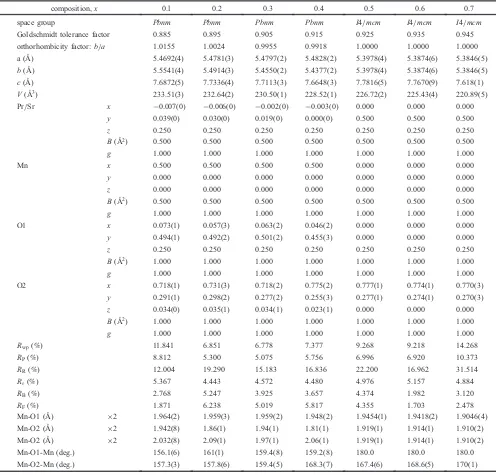
[image:3.595.48.544.84.559.2]Figure 2 shows the temperature variation of dc-suscepti-bility » under a magnetic field of 0.1 T or 1 T for 0.1¼ x¼0.7, measured in the warming process up to room Table 1 Crystal structure parameters of Pr1¹xSrxMnO3(0.1¼x¼0.7) at room temperature.
composition,x 0.l 0.2 0.3 0.4 0.5 0.6 0.7
space group Pbnm Pbnm Pbnm Pbnm I4/mcm I4/mcm I4/mcm
Goldschmidt tolerance factor 0.885 0.895 0.905 0.915 0.925 0.935 0.945
orthorhombicity factor:b/a 1.0155 1.0024 0.9955 0.9918 1.0000 1.0000 1.0000 a (¡) 5.4692(4) 5.4781(3) 5.4797(2) 5.4828(2) 5.3978(4) 5.3874(6) 5.3846(5) b(¡) 5.5541(4) 5.4914(3) 5.4550(2) 5.4377(2) 5.3978(4) 5.3874(6) 5.3846(5) c(¡) 7.6872(5) 7.7336(4) 7.7113(3) 7.6648(3) 7.7816(5) 7.7670(9) 7.618(1) V(¡3) 233.51(3) 232.64(2) 230.50(1) 228.52(1) 226.72(2) 225.43(4) 220.89(5)
Pr/Sr x ¹0.007(0) ¹0.006(0) ¹0.002(0) ¹0.003(0) 0.000 0.000 0.000
y 0.039(0) 0.030(0) 0.019(0) 0.000(0) 0.500 0.500 0.500
z 0.250 0.250 0.250 0.250 0.250 0.250 0.250
B(¡2) 0.500 0.500 0.500 0.500 0.500 0.500 0.500
g 1.000 1.000 1.000 1.000 1.000 1.000 1.000
Mn x 0.500 0.500 0.500 0.500 0.000 0.000 0.000
y 0.000 0.000 0.000 0.000 0.000 0.000 0.000
z 0.000 0.000 0.000 0.000 0.000 0.000 0.000
B(¡2) 0.500 0.500 0.500 0.500 0.500 0.500 0.500
g 1.000 1.000 1.000 1.000 1.000 1.000 1.000
O1 x 0.073(1) 0.057(3) 0.063(2) 0.046(2) 0.000 0.000 0.000
y 0.494(1) 0.492(2) 0.501(2) 0.455(3) 0.000 0.000 0.000
z 0.250 0.250 0.250 0.250 0.250 0.250 0.250
B(¡2) 1.000 1.000 1.000 1.000 1.000 1.000 1.000
g 1.000 1.000 1.000 1.000 1.000 1.000 1.000
O2 x 0.718(1) 0.731(3) 0.718(2) 0.775(2) 0.777(1) 0.774(1) 0.770(3)
y 0.291(1) 0.298(2) 0.277(2) 0.255(3) 0.277(1) 0.274(1) 0.270(3)
z 0.034(0) 0.035(1) 0.034(1) 0.023(1) 0.000 0.000 0.000
B(¡2) 1.000 1.000 1.000 1.000 1.000 1.000 1.000
g 1.000 1.000 1.000 1.000 1.000 1.000 1.000
Rwp(%) 11.841 6.851 6.778 7.377 9.268 9.218 14.268
RP(%) 8.812 5.300 5.075 5.756 6.996 6.920 10.373
RR(%) 12.004 19.290 15.183 16.836 22.200 16.962 31.514
R¾(%) 5.367 4.443 4.572 4.480 4.976 5.157 4.884
RB(%) 2.768 5.247 3.925 3.657 4.374 1.982 3.120
RF(%) 1.871 6.238 5.019 5.817 4.355 1.703 2.478
Mn-O1 (¡) ©2 1.964(2) 1.959(3) 1.959(2) 1.948(2) 1.9454(1) 1.9418(2) 1.9046(4)
Mn-O2 (¡) ©2 1.942(8) 1.86(1) 1.94(1) 1.81(1) 1.919(1) 1.914(1) 1.910(2)
Mn-O2 (¡) ©2 2.032(8) 2.09(1) 1.97(1) 2.06(1) 1.919(1) 1.914(1) 1.910(2)
Mn-O1-Mn (deg.) 156.1(6) 161(1) 159.4(8) 159.2(8) 180.0 180.0 180.0
temperature after ZFC down to 5 K. The temperature dependence of»suggests that the data of all samples under a magnetic field of 1 T are suppressed rather than under a magnetic field of 0.1 T. This implies that both ferromagnet-ism and antiferromagnetferromagnet-ism coexists in all samples. The samples have a Curie temperatureTCof 145, 168, 271, 310,
and 310 K forx=0.1, 0.2, 0.3, 0.4, and 0.5, respectively. In particular, the samples for x=0.2, 0.3 and 0.4 have a clear FM ground state below TCwhile the sample for x=0.5 has
an additional transition below 160 K which is attributed to the charge ordering (CO) ground state25) arising due to a
competition between the MnO6 octahedral distortion
(toler-ance factor is 0.900) and the nominal concentration of x=0.5. In addition, the ground state ofx=0.1 sample is the spin-canted insulating state below 100 K.25)Forx=0.5, the ferromagnetism exists at intermediate temperature between 160 and 310 K. For x>0.5, the ferromagnetism disappears almost entirely and the ground state forx=0.6 and 0.7 is the A-type AFM with 2D FM coupling in MnO2 layers below
TN(A)=310 K and the C-type AFM with 1D FM coupling
along MnO chains belowTN(C)=318 K.26)
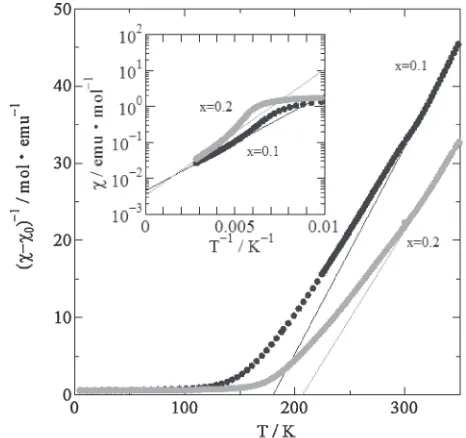
Figure 3 shows the plots of the inverse dc-susceptibility (»¹»0)¹1 for the specimens of x=0.1 and 0.2 versus
temperature T, where»0 is the contribution of
temperature-independent magnetic susceptibility. The curves are strictly linear in the high-temperature paramagnetic (PM) range. As shown in Fig. 3, the PM properties are best manifested by the plot of reciprocal susceptibilities. The PM properties can be expressed as: »=»0+C/(T¹©), whereCis the Curie
constant and © is the paramagnetic Curie temperature. The effective magnetic moment of each Mn site ®eff is then
determined using the obtainedCin the equation
®eff¼2
ffiffiffiffiffiffiffiffiffiffiffiffiffiffiffiffiffi
SðSþ1Þ
p
®B¼
ffiffiffiffiffiffiffiffiffiffiffiffi
3kBC
NA r
; ð1Þ
wherekB,®B,NA, andSare the Boltzmann constant, the Bohr
magnetron, the Avogadro’s number, and the spin quantum
number, respectively. Since the Mn3+(t2g3eg1) and Mn4+(t2g3)
ions in the perovskite-type Mn oxides are in the HS state, the valence state of each Mn ion can be directly derived from eq. (1). Table 2 summarizes the Temperature-independent magnetic susceptibilities, paramagnetic Curie temperatures, Curie constants, effective magnetic moments, and valence state of Mn ions for Pr0.9Sr0.1MnO3and Pr0.8Sr0.2MnO3. The
nominal valence state of Mn ions for both specimens is 3.1 for x=0.1 and 3.2 for x=0.2, respectively. From the C, however, the valence state of Mn ions is 2.6 forx=0.1 and 2.8 for x=0.2, respectively. This discrepancy is eliminated by measuring dc-susceptibility above 350 K.
Temperature dependence of the electrical resistivityμ for the specimens of 0.1¼x¼0.7 measured in the temperature range from 80 to 1073 K are summarized in Fig. 4. The samples forx=0.1 and 0.2 show a semiconducting behavior over the whole temperature range. In particular, the samples have theTCof 168, 271, 310, and 310 K forx=0.2, 0.3, 0.4,
and 0.5, respectively. Besides,x=0.3 and 0.4 have a clear metal-insulator (M-I) transition due to a competition between the DE interaction21) and the JT distortion of MnO
6
[image:4.595.56.286.66.273.2]octahedra.22) at 271 K and 310 K, respectively. For x=0.2,
Table 2 Temperature-independent magnetic susceptibilities (»0), paramag-netic Curie temperatures (#), Curie constants (C), effective magnetic moments (®eff), and valence state of Mn ions for Pr0.9Sr0.1MnO3(x=0.1) and Pr0.8Sr0.2MnO3(x=0.2).
composition,x 0.1 0.2
»0(emu/mol) 0.004 0.003
©(K) 190 238
C(emu K/mol) 3.58 3.31
®eff(®B) 5.35 5.14
valence state of Mn ion 2.6 2.8
Fig. 2 Temperature (T) dependence of magnetic dc-susceptibility (») for Pr1¹xSrxMnO3 (0.1¼x¼0.7) under zero-field cooling condition at a magneticfield of 01 T (solid circles and squares) or 1 T (open circles and squares) in a warming process. Arrows show the magnetic transition temperatures.
[image:4.595.309.542.70.289.2] [image:4.595.304.550.410.489.2]on the other hand, there is no transition into a metallic state despite the FM ground state below 168 K because of a competition between the DE interaction and the super-exchange interaction which favors an AFM spin state, rendering both a canted magnetic structure and an insulating ground state.31) Also for the specimens of x½0.5 the
insulating ground states, i.e., CO ground state25)forx=0.5
belowTCO=160 K, the A-type AFM with 2D FM coupling
in MnO2layers26)forx=0.6 belowTN(A)=310 K, and the
C-type AFM with 1D FM coupling along MnO chains26)for
x=0.7 belowTN(C)=318 K are obtained, respectively.
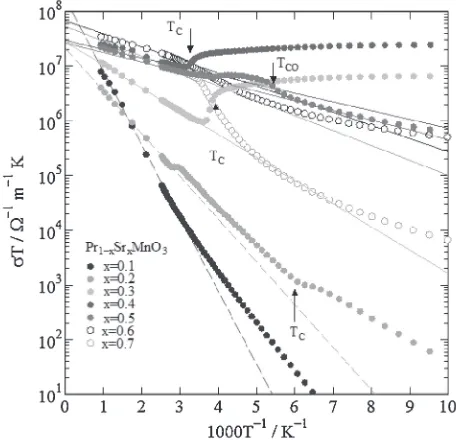
All samples exhibited an adiabatic small polaron behavior in the conduction mechanism above room temperature. For small polaron hopping conduction, in which the carrier mobility ® obeys thermally activated temperature depend-ence, rather than the carrier concentration n, with the activation energy, i.e., the small polaron binding energy. Therefore, the temperature dependence of the electrical conductivity · predicted using the polaron theory is as follows:3234)
· ¼en®
¼en0e½LOa 2
kBT exp
WHþEg=2
kBT
;
¼·T0exp kE·
BT
ð2Þ
where n¼n0expðEg=2kBTÞ denotes the number of
hopping small polarons per unit volume, n0 is the
concen-tration of Mn4+ sites per unit volume, ½LO is the
optical-phonon frequency, a is the characteristic intersite hopping distance that corresponds to a typical Mn-O-Mn distance of our samples,WHis the hopping energy of small polarons,·0
is the pre-exponential term, andE·is the activation energy of the conduction process. As is clearly shown in Fig. 5, all the electrical conductivities above room temperature are well described by the activated conduction process. The Arrhenius relation of·Tagainst 1/Tabove room temperature plotted in
Fig. 5 yield well straight lines with E· of 0.27, 0.16, 0.08, 0.03, 0.04, 0.05, and 0.05 eV for x=0.1, 0.2, 0.3, 0.4, 0.5, 0.6, and 0.7, respectively. Furthermore, as listed in Table 3, the least mean square fitting yields ·0 in the range 107
108³¹1m¹1K by extrapolating ·T at 1=T !0 in Fig. 5.
Employing½LOµ10THz,aµ4.0¡which is the mean
Mn-O-Mn distance determined by Rietveld refinement method listed in Table1, and n0µ10271028m¹3 calculated from
lattice parameters in Table 1,·0is also calculated to be in the
range 106107³¹1m¹1K as summarized in Table 3. Taking
into account of the effect of polycrystallinity in samples and the uncertainty in the value employed for ½LO, the
agree-ments are good.
Figure 6 shows the temperature dependence of the Seebeck coefficient S for the specimens of 0.1¼x¼0.7 measured in the temperature range up to 1073 K. The sample forx=0.1 shows a large positiveSbelow room temperature and a sharp fall above room temperature. The positive S for x=0.2 decreases gradually below TC. The samples for
x=0.3 and 0.4 show a small positive S below TC and a
negativeS aboveTC. The samples for x=0.5 and 0.6 show
a negative S over the whole temperature range. For high-temperature extrapolation, we assumed the expression for the temperature dependence of S above room temperature with T¹1dependence according to the following equation
S¼S1þkeBkES
BT; ð3Þ
where ES(E·ºES) is a characteristic energy for S, and S¨
is a temperature independent term, i.e., the thermopower in the high-temperature limit.31) Table 3 lists the experimental values of ES and S¨ for the specimens of 0.1¼x¼0.7
obtained from these least-mean-squarefits. If we assume that the values of EScorrespond toEg/2 in eq. (2), the hopping
energy can be expressed asWH=E·¹ES. The values ofWH
for 0.1¼x¼0.7 are also listed in Table 3.
0 200 400 600 800 1000
10−6 10−5 10−4 10−3 10−2 10−1 100 101 102
T / K
ρ
/
Ω
m
Pr1−xSrxMnO3
x=0.1 x=0.2 x=0.3 x=0.4 x=0.5 x=0.6 x=0.7 TC
TC
TC
TCO
Fig. 4 Temperature (T) dependence of electric resistivity (μ) for Pr1¹xSrx -MnO3 (0.1¼x¼0.7), where arrows show the magnetic transition temperatures ofx=0.2, 0.3, 0.4, and 0.5.
[image:5.595.64.280.70.283.2] [image:5.595.312.540.71.291.2]Koshibae et al.11) have proposed that S
¨ of the 3d
transition-metal oxides is described by an extended Heikes formula.35)According to their theoretical predictions,S
¨ of
Pr1¹xSrxMnO3is expressed as
S1¼ keBln gMn3þ gMn4þ
x 1x
; ð4Þ
where x is the concentration of Mn4+ ions, and the ratio gMn3þ=gMn4þ means an unbalance of the degeneracy of the spin and the orbital degrees of freedom between Mn3+and Mn4+. Since Mn3+and Mn4+ions are in the high spin state, gMn4þis equal to 4 owing only to the spin degeneracy oft2g3
and gMn3þ is equal to 10 owing to both the spin and orbital degeneracy oft2g3eg1. As listed in Table 3,S¨is evaluated to
be
S1¼SA¼ 79:0V=KkeBln1x x: ð5Þ
However,SAis not in good agreement with the experimental
values ofS¨. The samples forx=0.1 and 0.2 are evaluated a positiveSA, whereas, negativeS¨is obtained by
extrapolat-ingS at1=T !0 in Fig. 6. We do not have a clear answer for this yet, but suggest a possible scenario that the thermopower forx=0.1 and 0.2 changes sign from apparent holelike to electronlike behavior above 1000 K and 500 K, respectively. The samples forx>0.3 are evaluatedSAto be
¹44.0 µV/K for x=0.4, ¹79.0 µV/K for x=0.5, ¹113.9 µV/K for x=0.6, and ¹152.0 µV/K for x=0.7, respec-tively. By contrast, the experimental values ofS¨are¹31.7 µV/K forx=0.4,¹40.5 µV/K forx=0.5,¹55.8 µV/K for x=0.6, and¹82.2 µV/K forx=0.7, respectively. Since the
JT distortion is gradually effective for the polaron formation in the samples forx>0.3, theeg level splitting is valid (no
orbital degeneracy in Mn3+), and g
Mn3þ is equal to 5 owing only to the spin degeneracy of t2g3eg1. Then thermopower
in the high-temperature limit is evaluated to be SB¼
kBln½5=4x=ð1xÞ=e. Therefore, S¨ for x>0.3 is
[image:6.595.46.549.143.381.2]evaluated to be
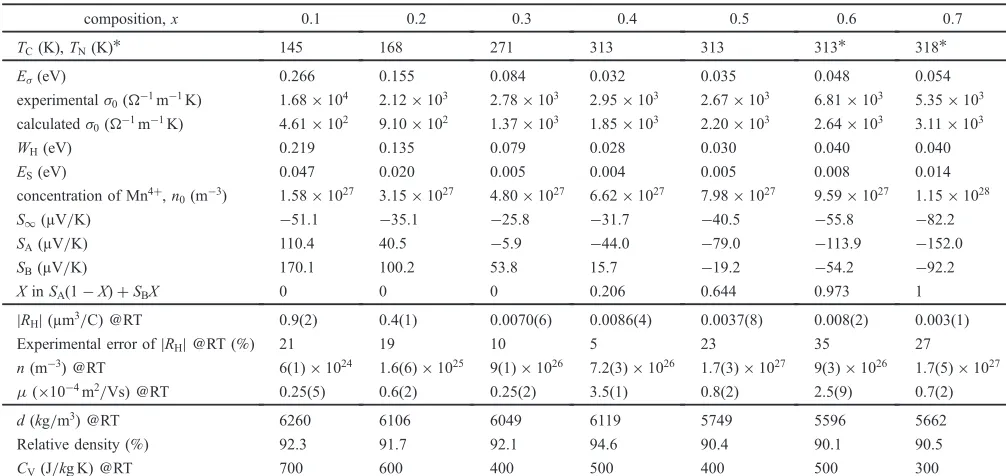
Table 3 Magnetic transition temperatures (TCandTN), activation energy of electric conduction (E·), experimental pre-exponential term
(·0), calculated pre-exponential term (·0), hopping energy of small polarons (WH), characteristic energy of Seebeck coefficient (ES), concentration of Mn4+ sites per unit volume (n0), Seebeck coefficient in the high-temperature limit (S¨), S¨ evaluated to be
kBln½10=4x=ð1xÞ=e, i.e.,SA, S¨evaluated to be kBln½5=4x=ð1xÞ=e, i.e., SB, X in the relation ofSA(1¹X)+SBX, absolute value of Hall coefficient at room temperature («RH«), experimental error of«RH«at room temperature, carrier concentration at room temperature (n), Hall mobility at room temperature (®), bulk density at room temperature (d), relative density at room temperature, and specific heat at room temperature (CV) for Pr1¹xSrxMnO3(0.1¼x¼0.7).
composition,x 0.1 0.2 0.3 0.4 0.5 0.6 0.7
TC(K),TN(K)* 145 168 271 313 313 313* 318*
E·(eV) 0.266 0.155 0.084 0.032 0.035 0.048 0.054
experimental·0(³¹1m¹1K) 1.68©104 2.12©103 2.78©103 2.95©103 2.67©103 6.81©103 5.35©103 calculated·0(³¹1m¹1K) 4.61©102 9.10©102 1.37©103 1.85©103 2.20©103 2.64©103 3.11©103
WH(eV) 0.219 0.135 0.079 0.028 0.030 0.040 0.040
ES(eV) 0.047 0.020 0.005 0.004 0.005 0.008 0.014
concentration of Mn4+,n0(m¹3) 1.58©1027 3.15©1027 4.80©1027 6.62©1027 7.98©1027 9.59©1027 1.15©1028
S¨(µV/K) ¹51.1 ¹35.1 ¹25.8 ¹31.7 ¹40.5 ¹55.8 ¹82.2
SA(µV/K) 110.4 40.5 ¹5.9 ¹44.0 ¹79.0 ¹113.9 ¹152.0
SB(µV/K) 170.1 100.2 53.8 15.7 ¹19.2 ¹54.2 ¹92.2
XinSA(1¹X)+SBX 0 0 0 0.206 0.644 0.973 1
«RH«(µm3/C)@RT 0.9(2) 0.4(1) 0.0070(6) 0.0086(4) 0.0037(8) 0.008(2) 0.003(1)
Experimental error of«RH«@RT (%) 21 19 10 5 23 35 27
n(m¹3)@RT 6(1)©1024 1.6(6)©1025 9(1)©1026 7.2(3)©1026 1.7(3)©1027 9(3)©1026 1.7(5)©1027
®(©10¹4m2/Vs)@RT 0.25(5) 0.6(2) 0.25(2) 3.5(1) 0.8(2) 2.5(9) 0.7(2)
d(kg/m3)@RT 6260 6106 6049 6119 5749 5596 5662
Relative density (%) 92.3 91.7 92.1 94.6 90.4 90.1 90.5
CV(J/kg K)@RT 700 600 400 500 400 500 300
Fig. 6 Temperature (T) dependence of Seebeck coefficient (S) for Pr1¹xSrx -MnO3(0.1¼x¼0.7) above 100 K, where the straight lines represent the theoretical relation of eq. (3). The plots atT¼ ¨representSA(1¹X)+
[image:6.595.314.541.413.635.2]S1¼SAð1XÞ þSBX; ð6Þ
which is in good agreement with the experimental values, where X=0.206 for x=0.4, X=0.644 for x=0.5, X= 0.973 for x=0.6, and X=1.000 for x=0.7, respectively. This means that the JT distortion is gradually effective for polaron formation with increasing x, so that the crystal structure above room temperature changes from the ortho-rhombicPbnmphases withx¼0.4 to the tetragonalI4/mcm phases withx½0.5. Similar results for La1¹xCaxMnO3were
reported by Palstra et al.31)
The Hall coefficientRHfor the specimens of 0.1¼x¼0.7
at room temperature was measured to evaluate the carrier concentration n and the Hall mobility ® under a magnetic
field of 0.85 T. The experimental error of the measured RH
was 535% for each sample. In the calculation of carrier concentrationn, the Hall scattering factor was assumed to be 1 and to obey a single carrier model. Table 3 lists the absolute value of Hall coefficient«RH«, experimental error of«RH«, the
carrier concentration n=1/e«RH«, and the Hall mobility
®=«RH«/μ, respectively. As summarized in Table 3, n
[image:7.595.318.534.71.280.2]increased with increasing Sr content for 0.1¼x¼0.3, and remained constant for 0.3¼x¼0.7. On the other hand, ® maintained small values for 25350 µm2/Vs over the whole Sr contents at room temperature.
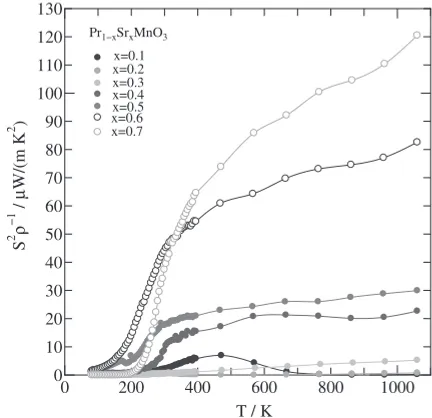
Figure 7 shows the power factor S2/μ for 0.1¼x¼0.7 measured in the temperature range from 80 to 1073 K. The temperature dependence of S2/μ of Pr
1¹xSrxMnO3 (0.1¼
x¼0.7) calculated from the data in Fig. 4 and 6 is plotted in Fig. 7. Obviously, the specimen ofx=0.7 shows the largest power factor of all the samples above room temperature. On the other hand, the specimen of x=0.1 shows the largest S2/μ in the p-type Pr
1¹xSrxMnO3 specimens. The power
factor forx=0.1 increases up to 400500 K and then rapidly decreases, attaining a maximum value of 7©10¹6W/mK2at 468 K.
Figure 8 shows the total thermal conductivities ¬, i.e., ¬=¬L+¬eand the lattice thermal conductivity¬L=¬¹¬e,
where the electric thermal conductivity¬eis calculated from
the data in Fig. 4 in the temperature range from 573 to 1073 K. After subtracting¬efrom total thermal conductivity
using well-known the Wiedemann-Frantz law (¬e=L0·T),
therefore, ¬L is plotted by the dashed line against the
temperature in Fig. 8. Here, we assumed that the Lorenz numberL0is equal to 2.45©10¹8V2/K2. Although the value
of ¬e increased with increasing temperature, the influence
of ¬e on the total thermal conductivity is very small in
comparison with that of ¬L. For all specimens, ¬L is more
important than ¬e, and therefore, the total thermal
conduc-tivity is mainly ascribed to ¬L. As shown in Fig. 8, ¬L
increased with increasing temperature for 0.1¼x¼0.3, and maintained small values for 12 W/mK over the whole temperature range measured for 0.4¼x¼0.7.
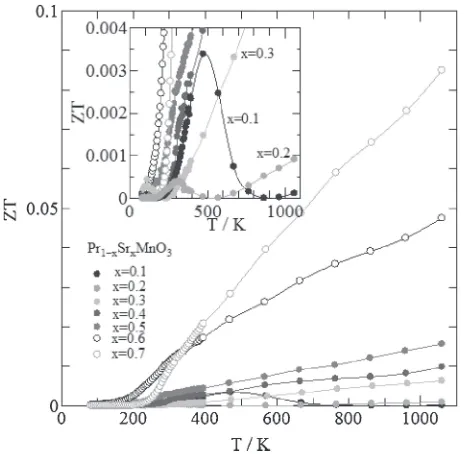
Finally, we present the estimated dimensionless figure of merit ZTas a function of temperature for 0.1¼x¼0.7. As shown in Fig. 9, the ZT value increased with increasing temperature for 0.3¼x¼0.7. Clearly, the n-type specimen ofx=0.7 shows the largestZTof all the samples above room temperature. In particular, the largestZTvalue forx=0.7 is 0.085 at 1073 K. On the other hand, the specimen ofx=0.1
shows the largestZTin the p-type Pr1¹xSrxMnO3specimens,
attaining a maximum value of 0.0035 at 468 K.
4. Conclusions
In this study, polycrystalline samples of Pr1¹xSrxMnO3
(0.1¼x¼0.7) were synthesized using a conventional solid-state reaction method, and their crystal structures, magnetic properties and thermoelectric properties were investigated. The crystal structure at room temperature changed from orthorhombic Pbnm phases, with x¼0.4, to tetragonal I4/mcm phases, with x½0.5. With increasing x, the Goldschmidt tolerance factor increases and the MnO6
octahedra distortion is suppressed because of the JT distortion. The samples forx¼0.4 show the FM like ground
0 200 400 600 800 1000 0
10 20 30 40 50 60 70 80 90 100 110 120 130
T / K
S
2 ρ
−1
/
μ
W/(m K
2 )
Pr1−xSrxMnO3
x=0.1 x=0.2 x=0.3 x=0.4 x=0.5 x=0.6 x=0.7
Fig. 7 Temperature (T) dependence of power factor (S2/μ) for Pr 1¹xSrx -MnO3(0.1¼x¼0.7).
Fig. 8 The plots and solid lines show temperature (T) dependence of total thermal conductivity (¬L+¬e) above 500 K for Pr1¹xSrxMnO3 (0.1¼
[image:7.595.312.542.321.536.2]state belowTC=145, 168, 271, and 310 K forx=0.1, 0.2,
0.3, and 0.4, respectively. For x=0.5, the ferromagnetism exists in the temperature range between TCO=160 K and
TC=310 K. Forx>0.5, the ground state forx=0.6 and 0.7
is the A-type AFM belowTN=310 K and the C-type AFM
belowTN=318 K. Above room temperature, all the samples
exhibit adiabatic small polaron conduction in a competition between the DE interaction and the JT distortion which is effective for the polaron formation. We found that the samples for x=0.1 and 0.2 show a large positive S below room temperature and change sign from apparent holelike to electronlike behavior above 1000 K and 500 K, respectively. Thus, all the samples show a negativeSat a high temperature and S¨ defined by an extended Heikes formula is in good agreements with the experimental values for x½0.4 by taking account of their JT distortions. We also confirmed that ¬ is mainly ascribed to ¬L which increases with increasing
temperature forx¼0.3 and maintains constant of small value (12 W/mK) for x½0.4. We obtained the largest ZTof all the samples above room temperature is 0.085 at 1073 K for x=0.7. In addition, the largestZTin the p-type specimens is obtained for x=0.1, thus, attaining a maximum value of 0.0035 at 468 K. These results suggest that the potentiality to fabricate the oxide thermoelectric modules consisting of the same type of elements is valid.
Acknowledgements
The authors are very grateful to Y. Watanabe for useful discussion and assistance in the preparation of this manu-script.
REFERENCES
1) G. M. Mahan:Solid State Phys.51(1997) 81.
2) I. Terasaki, Y. Sasago and K. Uchinokura: Phys. Rev. B56(1997) R12685.
3) Y. Miyazaki, K. Kudo, M. Akoshima, Y. Ono, Y. Koike and T. Kajitani: Jpn. J. Appl. Phys.39(2000) L531.
4) R. Funahashi, S. Urata, K. Mizuno, T. Kouuchi and M. Mikami:Appl. Phys. Lett.85(2004) 1036.
5) R. Funahashi, M. Mikami, T. Mihara, S. Urata and N. Ando:J. Appl. Phys.99(2006) 066117.
6) S. Urata, R. Funahashi, T. Mihara, A. Kosuga, S. Sodeoka and T. Tanaka:Int. J. Appl. Ceram. Technol.4(2007) 535.
7) S. Ohta, H. Ohta and K. Koumoto:J. Ceram. Soc. Jpn.114(2006) 102. 8) M. Ohtaki, H. Koga, T. Tokunaga, K. Eguchi and H. Arai:J. Solid State
Chem.120(1995) 105.
9) M. Iijima and N. Murayama: Proc. Int. Conf. on Thermoelectrics, (1998) p. 598.
10) K. Iwasaki, T. Ito, T. Nagasaki, Y. Arita, M. Yoshino and T. Matsui: J. Solid State Chem.181(2008) 3145.
11) W. Koshibae, K. Tsutsui and S. Maekawa:Phys. Rev. B62(2000) 6869.
12) L. Pi, C. Martin, A. Maignan and B. Raveau:Phys. Rev. B67(2003) 024430.
13) P. X. Thao, T. Tsuji, M. Hashida and Y. Yamamura:J. Ceram. Soc. Jpn. 111(2003) 544.
14) B. T. Cong, T. Tsuji, P. X. Thao, P. Q. Thanh and Y. Yamamura: Physica B352(2004) 18.
15) G. Xu, R. Funahashi, Q. Pu, B. Liu, R. Tao, G. Wang and Z. Ding: Solid State Ionics171(2004) 147.
16) M. Miclau, S. Hebert, R. Retoux and C. Martin:J. Solid State Chem. 178(2005) 1104.
17) D. Flahaut, T. Mihara, R. Funahashi, N. Nabeshima, K. Lee, H. Ohta and K. Koumoto:J. Appl. Phys.100(2006) 084911.
18) L. Bocher, M. H. Aguirre, D. Logvinovich, A. Shikabko, R. Robert, M. Trottmann and A. Weidenkaff:Inorg. Chem.47(2008) 8077. 19) R. von Helmolt, J. Wecker, B. Holzapfel, L. Schultz and K. Samwer:
Phys. Rev. Lett.71(1993) 2331.
20) A. Urushibara, Y. Morimoto, T. Arima, A. Asamitsu, G. Kido and Y. Tokura:Phys. Rev. B51(1995) 14103.
21) C. Zener:Phys. Rev.82(1951) 403.
22) A. Maignan, C. Martin, F. Damay and B. Raveau:Phys. Rev. B58 (1998) 2758.
23) F. Izumi and K. Momma:Solid State Phenom.130(2007) 15. 24) W. J. Parker, R. J. Jenkins, C. P. Butler and G. L. Abbott:J. Appl. Phys.
32(1961) 1679.
25) Y. Tokura, Y. Tomioka, H. Kuwahara, A. Asamitsu, Y. Moritomo and M. Kasai:Physica C263(1996) 544.
26) Z. Jirák, J. Hejtmánek, E. Pollert, C. Martin, A. Maignan, B. Raveau, M. M. Savosta, Y. Tomioka and Y. Tokura:J. Appl. Phys.89(2001) 7404.
27) O. Chmaissem, B. Dabrowski, S. Kolesnik, J. Mais, J. D. Jorgensen and S. Short:Phys. Rev. B67(2003) 094431.
28) K. Knížek, J. Hejtmánek, Z. Jirák, C. Martin, M. Hervieu, B. Raveau, G. André and F. Bourée:Chem. Mater.16(2004) 1104.
29) R. D. Shannon:Acta Crystallogr. Sect. A32(1976) 751. 30) V. M. Goldschmidt:Natuwissenschaften14(1926) 477.
31) T. T. M. Palstra, A. P. Ramirez, S.-W. Cheong, B. R. Zegarski, P. Schiffer and J. Zaanen:Phys. Rev. B56(1997) 5104.
32) D. Emin and T. Holstein:Ann. Phys.53(1969) 439. 33) I. G. Austin and N. F. Mott:Adv. Phys.18(1969) 41.
34) L. Murawski, C. H. Chung and J. D. Mackenzie:J. Non-Crystalline Solids32(1979) 91.
35) R. R. Heikes and R. W. Ure: Thermoelectricity: Science and Engineering, (Interscience Publishers, New York-London, 1961). Fig. 9 Temperature (T) dependence of dimensionlessfigure of merit (ZT)
[image:8.595.54.286.69.296.2]