Development of Micro Tensile Testing Method in an FIB System
for Evaluating Grain Boundary Strength
Katsuhiko Fujii and Koji Fukuya
Institute of Nuclear Safety System, Inc., Mihama, Fukui 919-1205, Japan
A micro tensile testing method for evaluating grain boundary strength was developed. Specimens of2210mmhaving one grain boundary were made by focused ion beam (FIB) micro-processing and tensioned in an FIB system. The load was measured from the deflection of the Si cantilever and the displacement was also monitoredin situ. The method was applied to aged and unaged Fe-Mn-P alloy specimens with different grain boundary P segregation. The load at intergranular fracture decreased with increasing P segregation.
[doi:10.2320/matertrans.M2010320]
(Received September 14, 2010; Accepted October 21, 2010; Published December 8, 2010)
Keywords: grain boundary strength, grain boundary segregation, ion alloys, micro tensile test, focused ion beam micro-processing
1. Introduction
The degradation of grain boundary strength induced by corrosion, thermal ageing and irradiation is one of the causes of intergranular cracking. The decrease in grain boundary strength or grain boundary cohesion could occur due to (1) the grain boundary segregation of impurities or solute elements, including hydrogen, helium and oxygen atoms; (2) oxide formation; (3) vacancies and micro-void formation; and (4) helium bubble formation. However, it is difficult to measure properties such as micro compositions and micro-structures and strength of an individual grain boundary at the same time by using conventional measurement techniques for chemical composition, microstructure and mechanical prop-erties. The direct measurement of a quantitative relation between characteristics and strength of the individual grain boundary has been rarely preformed.
Recently, measurements of mechanical properties of small dimension materials have become possible by improvement of the focused ion beam (FIB) technique and advancement of test techniques for specimens sized in the micrometer and sub-micrometer range.1)The frequently used techniques are nano-indentation, atomic force microscopy (AFM) and their combination, based mainly on their relatively simple setup and commercial availability. However, computer simulations such as finite element analysis are often necessary for the evaluation of strain and stress distributions in bent or compressed specimen. Technological developments of the micro- and nano-scale tensile testing, which provides a simpler method evaluating stress and strain in specimens and can correlate easily with macroscopic mechanical testing, have been advanced, and the tensile and compressive mechanical responses of various materials in the micrometer and sub-micrometer size volumes have been determined.2,3)
Micro- and nano-scale tensile testing has helped further understanding of how small volumes of materials deform. The microscopic mechanical properties of biological attach-ment devices have been studied using an FIB system as an in situ laboratory for specimen preparation, fixation, and testing at the micrometer scale, and the Young’s modulus and ultimate strength have been reported.4) In the present
study, a method to measure the strength of an individual grain boundary together with its detailed characteristics was developed using FIB micro-processing for specimen preparation.
2. Experimental Procedure
2.1 Material and grain boundary characterization
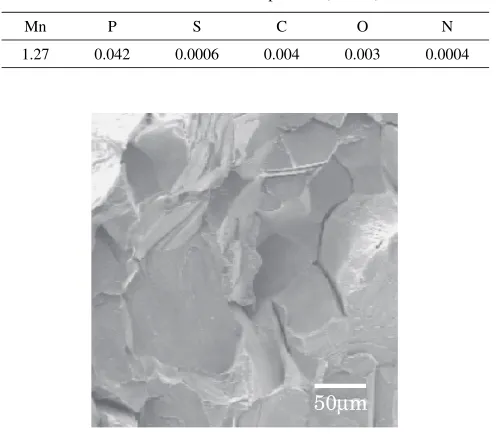
[image:1.595.304.552.308.525.2]The alloy of Fe-1.27Mn-0.042P was used as a test alloy material for intergranular fracture. Its chemical composition is shown in Table 1. The average grain size was 84mm. Phosphorous is one of the most well known embrittling elements that segregate to a grain boundary of iron and thereby cause intergranular fracture. Figure 1 shows a scanning electron microscopy (SEM) micrograph of the fracture surface of the test alloy material in the as-annealed condition (800C30min). The specimen was broken in an Auger Electron Spectroscopy (AES) chamber (ULVAC-PHI,
Table 1 Chemical composition (mass%).
Mn P S C O N
1.27 0.042 0.0006 0.004 0.003 0.0004
50µm
Inc. Model SAM640) at around 100C in a vacuum of
1108Pa. Intergranular fracture surface can be seen. The
AES measurements were carried out for the intergranular fracture surface to obtain the concentration of phosphorus at grain boundaries. The average concentration of phosphorus at the grain boundaries was 0.18 phosphorus monolayer coverage. In order to examine the relation between the phosphorus concentration and grain boundary strength, unaged and aged condition (475C1000h) specimens were used.
SEM, electron backscattering diffraction (EBSD) meas-urements, transmission electron microscopy (TEM), and energy dispersive spectroscopy (EDS) were used for the selection of a grain boundary and determination of its characteristics. A high-angled grain boundary was selected by the SEM and EBSD measurements. A small sample block (about20205mm) containing the selected grain bound-ary was cut by FIB micro-processing with Ga ions of 30 kV. This block was further separated into two smaller sample blocks by FIB micro-processing. One was used for TEM and EDS measurements and the other was used for a micro tensile test in the FIB system (Hitachi FB-2000A). Specimens for TEM and EDS measurements were also prepared by FIB micro-processing, and the microstructure and composition of the grain boundary were analyzed by using a TEM (Hitachi HF-3000) equipped with a field emission gun of 300 kV and a Noran EDS detector.
2.2 Micro tensile testing method 2.2.1 Specimen preparation
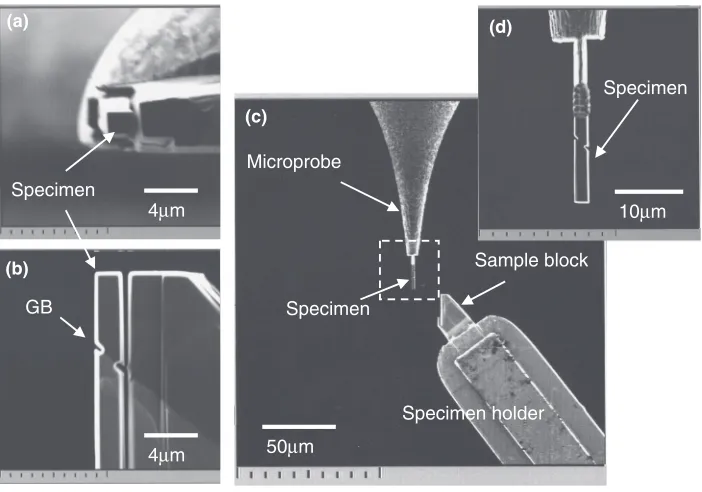
Rectangular-shaped specimens, each containing one grain boundary, were made by FIB micro-processing with Ga ions of 30 kV. Maximum ion beam current of the FIB micro-processing was 12 nA. The preparation is shown in Fig. 2.
Each specimen had a 22mm cross section and 10mm
length. While geometrical arrangement of the grain boundary in the specimen could be freely controlled, in the present study, the grain boundary was 45to the tensile axis. This is because the shearing load normal to the grain boundary acts in the maximum. The line-shape notches along the grain boundary were introduced by FIB micro-processing to reduce the ratio of the area of the grain boundary to the cross-sectional area of the specimen. After the preparation, the micro-tensile specimen was fixed to the microprobe of the micro-sampling unite in the FIB system by tungsten deposition, and was cut from the sample block.
2.2.2 Micro tensile test in a FIB system
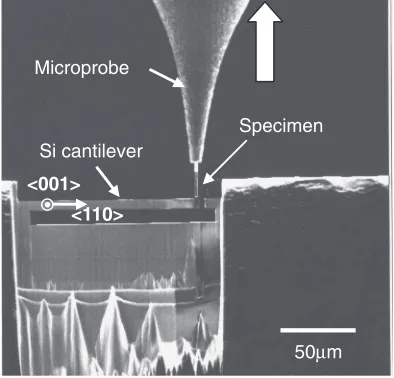
The micro tensile specimen was fixed to a single-crystal silicon cantilever beam by tungsten deposition, and anin situ micro tensile test was done in the FIB system at room temperature. The specimen was tensioned by moving the microprobe of the micro-sampling unite in the FIB system, and the load was measured from the deflection of the single-crystal silicon cantilever beam. The setup of the micro tensile test is shown in Fig. 3. Figure 4 shows the scanning ion microscopy (SIM) images of anin situmicro tensile test. The microprobe was moved upwards continuously while the SIM image was monitored. The specimen was pulled in the vertical direction, and the displacement of the cantilever beam was measured by monitoring the change in the distance between points A and B shown in Fig. 4(a). Although the measurement precision of the displacement of the cantilever beam depended on the resolution in SIM images, the measurement precision in the present micro tensile tests was about 0.1mm.
The load applied to the specimen,F, was calculated from the displacement of the cantilever beam from the initial position, d, by using the simple equation, F¼Ewt3d=4l3,
4µm
4µm GB
Specimen
(a)
(b)
10µm
50µm
Specimen
Specimen Microprobe
Specimen holder
(c)
(d)
Sample block
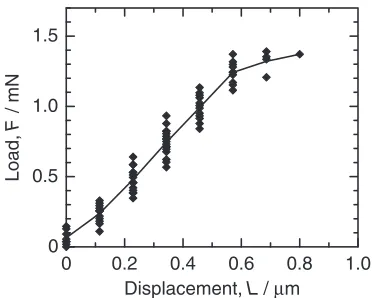
[image:2.595.123.474.71.317.2]based on linear elasticity theory, wherel,w,tandEare the length, width, thickness and Young’s modulus of the canti-lever beam, respectively. Single-crystal canticanti-lever beams were made from a silicon wafer by FIB micro-processing and then their dimensions were measured by SEM observations. Average dimension of the cantilever beams was 120mmlong, 15mmwide and 6mmthick. The direction of the cantilever beams along these length and width was the same as the h110iandh001iorientation, and thus the Young’s modulus of pure silicon was 170 GPa.5) The ratio of the load versus displacement of each cantilever beam was calculated by its own dimension, and was estimated to be 80–90mN/mm. The calibration of the ratio of the load versus displacement was carried out for a cantilever beam experimentally using an ultra-micro hardness tester (Elionix ENT1100). Figure 5 shows results of the load versus displacement measured by indenting the position at 5mmfrom the point of the cantilever beam. The straight line was fitted to the points, to obtain the ratio of the load versus displacement of the cantilever beam form its slope. The ratio of the load versus displacement of the cantilever beam was measured to be 170mN/mmin the displacement range from 1 to 5mm. This result was twice the value of 80mN/mmestimated using the Young’s modulus of pure silicon, and indicated a large Young’s modulus of the silicon wafer in the present study. Thus the value that doubled the estimated ratio for each cantilever beam by linear
elasticity theory was used. However a new calibration needs for cantilever beams in which dimensions and materials differ from the present one.
3. Results and Discussion
Figure 6 shows the SIM images before and after the micro tensile test for the aged condition specimen having the high-angled grain boundary of 39rotation angle. Figure 7 shows the result of the load versus displacement curve of the micro tensile test. The displacement was measured by monitoring the change in the length of the specimen. The specimen fractured at the grain boundary in a brittle manner while slight plastic deformation was observed in the grains. The part where the final fracture occurred, as shown in Fig. 6(b), was flat and kept the original length of the grain boundary. The displacement of the cantilever beam at the specimen fracture was 8.6mm and the corresponding load was calculated as 1380mN. The cantilever beam was broken due to impact at the time of the specimen fracture. The micro tensile test of the unaged condition specimen having the high-angled grain boundary of 51rotation angle was carried out for the same specimen shape and setup as the aged condition specimen. The displacement of the cantilever at the specimen fracture was 15.0mm and the corresponding load was calculated as 2640mN. While the amount of the plastic 50µm
Si cantilever
Specimen Microprobe
<110> <001>
Fig. 3 Setup of a micro tensile test.
10µm
(c) (b)
(a)
GB Specimen
Microprobe
Cantilever A B
Fig. 4 SIM images of anin situmicro tensile test.
0 1 2 3 4 5 6
0 0.5 1.0
Displacement, d / µm
Load,
F
/ mN
[image:3.595.345.509.67.219.2] [image:3.595.70.267.74.263.2] [image:3.595.115.483.299.427.2]strain was larger than that of the aged condition specimen, the part where the final fracture occurred was flat. The specimen fractured at the grain boundary in a brittle manner although plastic strain appeared in the grains to a larger extent. In the setup of the micro tensile tests, the shift of the tensile axis along the cantilever length inevitably occurred when the cantilever deflection became larger, since the specimen was fixed at both top and bottom positions. This applied a bending load to the specimen and thus there was an error in the calculated fracture load. In the present experiments, it was estimated that the cantilever beam was bent to an angle of 4 and 8 degrees for the aged and unaged condition, respec-tively. Thus the bending load to the specimen for the aged and unaged condition was estimated to be 7% and 13% of the corresponding load, respectively, and the load along the specimen length was estimated to be over 99% of the corres-ponding load in both cases. Although it is necessary to consider the bending moment which was imposed during loading to the evaluation of an exact stress in the specimen, in the present study the stress in the specimen was evaluated from the load calculated by the displacement of the cantilever beam.
The values of the nominal stress and the stress normal to the grain boundary in the aged and unaged specimens are summarized in Table 2, together with the phosphorus concentration of the grain boundaries measured by TEM
and EDS analyses. The grain boundary was 45 degrees to the tensile axis, and the notches along the grain boundary were introduced. In the geometry, the load with which mode I and II mixed was applied to the grain boundary. The contribu-tions of mode I and II for the loading were the same level. The loading as mode I decreases with increasing the angle of grain boundary whereas that as mode II increases. After the micro tensile tests, the angle of the grain boundary was larger than 45 degrees, thus this suggested effects of the plastic deformation of the specimens by the loading included the bending moments. A finite element analysis needs for the accurate stress evaluation that considered the geometry of the notches, the presence of bending moments in the loading and the discontinuous elastic response at the grain boundary. However the specimen fractured at the grain boundary in a brittle manner and the fracture surface indicated the fracture by the loading of mode I. Therefore, assuming only the loading of mode I to apply, the stress normal to the grain boundary was calculated preliminary. The stress normal to the grain boundary is likely to be a direct measure of the grain boundary strength, since in the present study, the final fracture occurred in a brittle manner. The intergranular fracture occurred at 540 MPa in the aged Fe-M-P alloy specimen with 0.98 mass%P at the grain boundary while it occurred at 1020 MPa in the unaged alloy specimen with 0.26 mass%P at the grain boundary. It was suggested that the increased phosphorus segregation weakened the grain boundary strength.
Phosphorous is a well known embrittling element that segregates to grain boundaries in iron and thereby causes intergranular fracture. Many studies have been done to clarify the effect of phosphorous on the embrittlement in iron alloys
2µm
10µm
GB
GB fracture
(a) (b)
t = 1.7 2.4 1.1
45°
(µm)
(c)
Fig. 6 SIM images (a) before and (b) after micro tensile test of the aged condition specimen. Image (b) clearly shows the cantilever was broken in the test. (c) Geometry and dimensions of the specimen.
0 0.2 0.4 0.6 0.8 1.0 0
0.5 1.0 1.5
Displacement, L / µm
Load,
F
/ mN
[image:4.595.94.502.72.228.2]Fig. 7 Load versus displacement curve of micro tensile test of the aged condition specimen.
Table 2 Micro tensile test results.
Unaged Aged
GB P concentration,CP/mass% 0.26 0.98
CP/P monolayer coverage 0.08 0.31
Load at fracture,FF/mN 2640 1380
Nominal stress,/MPa 680 360
[image:4.595.75.261.277.426.2] [image:4.595.302.550.291.370.2]and steels. It was reported from impact tests on Fe-P alloys that the phosphorous-induced grain boundary embrittlement of iron occurred when the bulk phosphorous concentration was more than900at ppm.6)In the present study, Fe-Mn-P
alloy (0.042 mass%P, 0.076 at%P) in the unaged condition was susceptible to intergranular fracture in the micro tensile test at room temperature. These results indicate that bulk phosphorous concentration of1at% is a common threshold condition for causing intergranular fracture in not only impact tests but also the micro tensile tests.
The relationship between intergranular fracture stress and phosphorus grain boundary concentration of Mn-Ni-Mo steels has been reported by Naudim et al.7) They showed that the amount of intergranular fracture increased with phosphorus monolayer coverage and that there existed a threshold value in phosphorus monolayer coverage (5 to 10%) at temperatures below60C. They also showed that the intergranular fracture stress linearly decreased with phosphorus monolayer coverage from cleavage fracture stress (2300 MPa) at the threshold value in phosphorus monolayer coverage. Nakataet al.8)have also reported that
the fracture stress decreased due to non-hardening embrittle-ment on thermally aged material with high proportion of intergranular fracture and that a threshold value for the intergranular fracture phenomenon existed around the P/Fe peak height ratio of 0.1 (corresponding to the phosphorus monolayer coverage of 0.16). In the present study, the fracture at the grain boundaries of 0.08 and 0.31 phosphorus monolayer coverages occurred during the micro tensile test at room temperature. The level of these phosphorus monolayer coverages causing the grain boundary fracture was consistent with the reported level. However the intergranular fracture stress presented by Naudim et al.7) was 2300 MPa to
1700 MPa for the phosphorus monolayer coverage of 0.1 to 0.4, and was much larger than those obtained in the present
study. This difference may be due to the effects of specimen shape and constraint by surrounding grains depending on the specimen size. In the present study, notches were introduced into the specimen along the grain boundary. The notches were likely to enhance the stress concentration at the grain boundary, resulting in a fracture at a lower load.
4. Summary
A method was developed to measure the strength of an individual grain boundary together with its detailed charac-teristics by using a specimen prepared with an FIB micro-processing. The micro tensile test in an FIB system was applied to measure the grain boundary strength of aged and unaged Fe-Mn-P alloy specimens with different grain boundary phosphorus segregations. The intergranular frac-ture occurred at 540 MPa in the aged condition specimen with 0.98 mass%P at the grain boundary while it occurred at 1020 MPa in the unaged condition specimen with 0.26 mass%P at the grain boundary. It was suggested that the increased phosphorus segregation weakened the grain boundary strength.
REFERENCES
1) K. J. Hemker and W. N. Sharpe Jr.: Ann. Rev. Mater. Res.37(2007) 93– 126.
2) D. Kiener, C. Motz and G. Dehm: Mater. Sci. Eng. A505(2009) 79–87. 3) D. S. Gianola and C. Eberl: JOM61(2009) 24–35.
4) S. Orso, U. G. Wegst, C. Eberl and E. Arzt: Adv. Mater.18(2006) 874– 877.
5) J. J. Wortman and R. A. Evans: J. Appl. Phys.36(1965) 153–156. 6) K. Abiko, S. Suzuki and H. Kimura: Trans. Jpn. Inst. Met.23(1982) 43–
52.
7) C. Naudin, J. M. Frund and A. Pineau: Scr. Mater.40(1999) 1013–1019. 8) H. Nakata, K. Fujii, K. Fukuya, R. Kasada and A. Kimura: J. Nucl. Sci.