Formation of Amorphous TiO
2Film on Ti Using Anodizing
in Concentrated H
3PO
4Aqueous Solution and Its Osteoconductivity
Dai Yamamoto
1,+, Takanori Iida
1,+, Kensuke Kuroda
1,
Ryoichi Ichino
2, Masazumi Okido
1and Azusa Seki
31Department of Materials Science & Engineering, Graduate School of Engineering, Nagoya University,
Nagoya 464-8603, Japan
2EcoTopia Science Institute, Nagoya University, Nagoya 464-8603, Japan 3Hamri Co., Ltd., Tokyo 110-0005, Japan
Anodizing of Ti specimens were performed in concentrated H3PO4aqueous solutions with a purpose to incorporate a large amount of phosphate ion into anodized coatings, and their osteoconductivity was evaluated inin vivotest. Ti specimens were anodized in 0.111 M H3PO4 aqueous solutions up to 200 V at a rate of 0.1 V s¹1. Anodized coatings were evaluated with SEM, TEM, XRD, XPS, and laser microscope. Anodized specimens were implanted in rats’tibia for 14 d, and then extracted.
When anodized in concentrated (²2 M) H3PO4aqueous solutions under spark discharge, crystallized anatase transformed to amorphous anatase by containing a large amount of PO43¹in crystal lattice of TiO2. The amorphous anatase coatings had better osteoconductivity than the crystallized anatase coatings. It is not exactly clear what was the intrinsic factor for the high osteoconductivity, but the crystallinity of anatase and/or PO43¹in thefilm is considered to be responsible for the difference in bone-forming ability of TiO2films.
[doi:10.2320/matertrans.M2011234]
(Received August 1, 2011; Accepted November 25, 2011; Published February 25, 2012)
Keywords: titanium, anodizing, phosphoric acid, titanium dioxide, amorphous, osteoconductivity
1. Introduction
Titanium is widely used in dental and orthopedic implants because of its good biocompatibility and high corrosion resistance. The long-term success rates of Ti implants have
been well documented by some reseachers.1,2) However,
many failures occur when the bone is of poor quality.3,4)
Various methods have been assessed to improve the clinical performance of Ti implants in poor-quality bone and to shorten the healing period. For example, hydroxyapatite (HAp), which is the main inorganic component of natural bone, is usually used in the form of a coating on a metallic substrate to compensate for its poor intrinsic mechanical properties. In our previous studies, HAp with various surface
morphologies,59) carbonate apatite (CO3Ap), CO3Ap/
Ca-CO3 composite films,10) HAp/collagen, and HAp/gelatin
compositefilms11)were fabricated on Ti substrates using the
thermal substrate method, and we have investigated their
osteoconductivity inin vivotests in rats’tibia. These studies
have revealed that a specific surface morphology strongly
accelerates calcification in the cancellous bone part.
Titanium dioxide is receiving much attention as an
osteoconductive substance, similar to HAp. TiO2 has been
shown to exhibit strong physicochemical bonding with living
bone.12) Therefore, optimization of the surface properties
of TiO2 coatings is a key technology in improving the
osteoconductivity of implants. There are many types of TiO2-coating methods for Ti substrates, such as thermal
oxidation,13) chemical methods,1416) physical vapor
deposi-tion,17,18)and anodizing.1922)Anodizing is a popular
hydro-process used to form TiO2 coatings because it can give
various surface properties on TiO2 by controlling the
oxidizing conditions.19,21,23,24)Many researchers have formed
TiO2 coatings by anodizing in P-containing aqueous
solu-tions and studied their surface properties because phospho-rus, which is one of the important elements composing bone,
is contained as phosphate ion in anodized coatings.23,25)Lee
et al. reported that higher nucleation ability of bioactive
CaP compounds was shown on the anodic coating formed
in solutions containing phosphate as the concentration of
phosphoric acid was increased below 0.9 M.25) In our
previous studies, the TiO2 coating formed by anodizing in
0.1 M H3PO4 aqueous solution induced a high level of
bone formation on the substrates in in vivo testing.26) We
hypothesized that more phosphate ion could be incorporated
when much more highly concentrated H3PO4 aqueous
solutions were used for the electrolyte, and much more bone could be formed on the coatings. However, to our knowledge,
TiO2 coatings anodized in concentrated H3PO4 aqueous
solutions above 3 M have not been reported. In this study, Ti
specimens were anodized in concentrated H3PO4 aqueous
solutions with a purpose to incorporate a large amount of phosphate ion into anodized coatings, and their
osteocon-ductivity was evaluated inin vivotest.
2. Materials and Methods
2.1 Preparation of the Ti substrates
CpTi plates (for evaluating the coatings, area=1.13 cm2)
and rods (for in vivo testing, dimensions=º2 mm©5 mm)
were used as the substrates, and were covered with epoxy resin, except for the face that would be in contact with the aqueous solution. The substrates were polished with emery
paper followed by buffing using Al2O3 particles (particle
size=0.05 µm). Then, the substrates were cleaned and then
degreased with ethanol. +Graduate Student, Nagoya University
2.2 Anodizing in aqueous solutions
Ti substrates were used as the working electrode, and a Pt coil was used as the counter electrode. The aqueous solution was stirred while anodizing and was kept at a constant
temperature (298 K) in a water bath. Aqueous 0.111 M
H3PO4 solutions were used as electrolytic baths. The
anodizing potential was increased up to 200 V at a rate of
0.1 V s¹1. After reaching a potential of 200 V, the applied
voltage was quickly stopped and the specimen was cleaned with distilled water and dried in air.
2.3 Analysis of the coatings
All of the specimens were sterilized using an autoclave unit at 394 K for a period of 20 min before analysis. The surface morphology and cross-sectional image of the substrates were observed using a scanning electron micro-scope (SEM) and a transmission electron micromicro-scope (TEM).
The coated films were identified using thin-film X-ray
diffraction (XRD), electron beam diffraction (ED), and X-ray photoelectron spectroscopy (XPS). The surface roughness measurements were conducted using a confocal laser scanning microscope with a measurement area of
150 µm©112 µm. The arithmetical means of the surface
roughness (Ra) was used, because this value was not distorted by any local scarring of the specimen.
2.4 In vivotests
Because the experimental procedure for ourin vivo study
was almost the same as described in previous reports,9)it is
described only briefly here. Before surgery, all of the
implants were cleaned in distilled water and immersed in a
chlorhexidine gluconate solution. Ten-week-old male
Sprague Dawley rats (Charles River Japan, Inc., Japan) were used in our experimental procedures. The specimens were implanted in the tibial metaphysis of the rats. A slightly oversized hole, which did not pass through to the rear side of the bone, was created using a low-speed rotary drill. Subsequently, the implants were inserted into these holes, and then the subcutaneous tissue and skin were closed and sterilized.
The rats were sacrificed after a period of 14 d, and
the implants with their surrounding tissue were retrieved.
The specimens were fixed in a 10% neutral buffered
formalin solution, dehydrated in a graded series of ethanol, and embedded in methylmethacrylate. Following poly-merization, each implant block was sectioned into 20 µm thick slices. These sections were then stained with toluidine blue.
The sum of the linear bone contact with the implant surface was measured and was expressed as a percentage over the entire implant length (the bone-implant contact
ratio,RB-I) in the cancellous bone and the cortical bone parts.
Significant differences in the bone-implant contact ratio were
analyzed statistically using the TukeyKramer method.27)
Differences were considered statistically significant at the
p<0.05 level. This animal study was conducted in the
laboratory of AAALAC International (Association for Assessment and Accreditation of Laboratory Animal Care International).
3. Results and Discussion
3.1 Surface properties of TiO2coatings
The XRD patterns of the anodized specimens are shown in Fig. 1, and the variations of full width at half maximum (FWHM) of the anatase peak, detected in the XRD pattern at
2ª (deg.)=25.2, are shown in Figs. 2(a) and 2(b) as a
function of H3PO4 content in the bath and applied voltage.
In the same way as FWHM, variations in the PO43¹content
in the oxide films, which were represented as the intensity
ratio of P 2p/Ti 2p obtained in the XPS spectra, are shown in
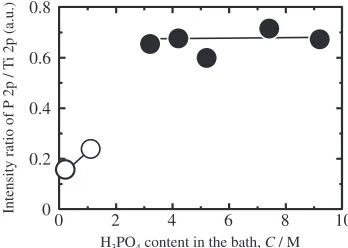
Fig. 3 as a function of H3PO4 content in the bath. Figure 4
shows the cross-sectional brightfield image and ED image of
the oxidefilm anodized up to 200 V in 9 M H3PO4. Figure 5
shows the surface SEM images of the substrate before and after anodizing.
The XRD patterns of the anodized specimens showed anatase peaks with different FWHM values. One was
crystallized anatase with low FWHM values (<1 deg.)
20
anatase (a)
(b)
(d) (c)
Intensity (a. u.)
(e)
25 30
(f) 20 25 30
(A)
(B)
(D) (C)
Intensity (a. u.)
(1) (2)
anatase
2θ (deg.,CuKα)
2θ (deg.,CuKα)
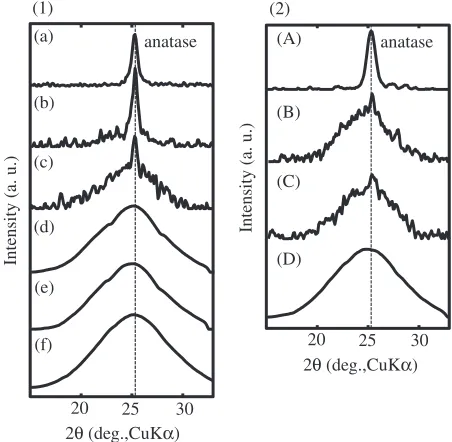
Fig. 1 XRD patterns of Ti (1) anodized up to 200 V in (a) 0.1 M, (b) 1 M, (c) 3 M, (d) 4 M, (e) 5 M, and (f) 9 M H3PO4aqueous solution (298 K), and (2) anodized in 7.3 M H3PO4aqueous solution (298 K) up to (A) 100 V, (B) 160 V, (C) 180 V, and (D) 200 V at a rate of 0.1 V s¹1.
10
2 4 6 8
Full width at half maximum (de
g.)
4 6 8 10
0 2 100 200
(b) (a)
0 0
H3PO4 content in the bath, C / M Applied voltage, E / V
[image:2.595.314.540.72.293.2] [image:2.595.307.548.364.472.2][Figs. 1(a) and 1(b)], and the other was an amorphous form
with high FWHM values (>5 deg.) [Figs. 1(c), 1(d), and
1(e)]. The ED pattern meant that the oxidefilm consisted of
anatase nanocrystals in the inner part and amorphous anatase on the nanocrystal phase.
When the FWHM values were arranged as a function of
H3PO4 content in the bath (Fig. 2), it was found that the
FWHM values suddenly increased from about 1 to 6 at 2 M, and maintained a constant high value of 8 above 4 M. This
means that the amorphous structure can be obtained in H3PO4
aqueous solutions at concentrations higher than 2 M. Because sparking occurred during anodizing in these concentrated
H3PO4 solutions, many pores were formed, which made the
Ra value much higher than that of the original Ti surface
[Figs. 5(d), 5(e), 5(f), 5(g), and 5(h)]. Crystallized TiO2films
with low FWHM values were formed in H3PO4 solutions
below 2 M. These films showed a relatively fine surface
[Figs. 5(b) and 5(c)], similar to the original Ti substrate [Fig. 5(a)], because no sparking occurred during anodizing.
These results mean that spark generation also influenced the
crystallinity of the anatase films.
From XPS results, all of these anodizedfilms were found
to contain PO43¹, and its content depended on the
concentration of H3PO4 in the bath (Fig. 3). In this figure,
the data can be classified into two areas of high PO43¹
content and low PO43¹content in thefilm at around 3 M. In
each of the areas, PO43¹ content in the film was almost
constant irrespective of H3PO4content in the bath. The same
tendency was observed with the FWHM value. This implies that the FWHM value of the anatase peak corresponds to the
PO43¹content in the oxidefilm. In other words, the formation
of the amorphous phase seemed to be caused by
incorpo-ration of PO43¹ into the crystal lattice. Therefore, a large
amount of PO43¹in the lattice was considered to disturb the
formation of the ordered crystal structure of TiO2, resulting
in the formation of the amorphous phase. Saturation of
PO43¹in the crystal lattice seems to be responsible for the
constant FWHM value above 4 M.
However, the concentration of H3PO4 was not the only
factor in forming the amorphous phase. Despite sufficient
PO43¹in 7.3 M H3PO4 solutions, the amorphous phase was
not observed at low voltages that did not generate sparking [Fig. 1(2)(A)]. Thus, sparking seemed to work as a trigger
to incorporate PO43¹into thefilm. Therefore, the amorphous
phase could be caused by spark generation during anodizing
in concentrated H3PO4 solution. To summarize the
crystal-linity of the anatasefilm in relation to H3PO4 content in the
bath and applied voltage, it was classified into two groups,
Intensity ratio of P 2p /
T
i 2p (a.u.)
0 2 4 6 8 10
0 0.2 0.4 0.6 0.8
H3PO4 content in the bath, C / M
Fig. 3 Relationship between H3PO4content in the bath and the amount of PO43¹contained in the coatings during anodizing up to 200 V at a rate of
0.1 V s¹1in H3PO4aqueous solution (298 K) ( : crystallized anatase and : amorphous anatase).
2μm
Amorphous
Amorphous + Nanocrystal Ti
TiO2
(a) (b)
Fig. 4 (a) Cross-sectional brightfield image by TEM and (b) ED patterns of Ti anodized in 9 M H3PO4aqueous solution (298 K) up to 200 V at a rate of 0.1 V s¹1.
0.114 0.150 0.321
(b) (c)
(h) (f)
Ra/μμm = 0.057
10 μm
(a)
0.467
(d)
0.730
(e)
0.246
(g)
0.568
[image:3.595.305.540.69.194.2] [image:3.595.81.255.72.196.2] [image:3.595.128.468.273.444.2]as shown in Fig. 6. This figure also shows that the amorphous phase could be obtained by an increase in both
H3PO4content in the bath and applied voltage.
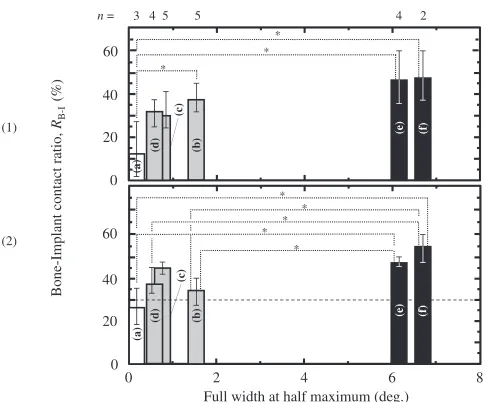
3.2 In vivoevaluation
Because of the good correlation between the FWHM value
and PO43¹content in thefilms, as noted above, the following
descriptions are discussed in terms of the FWHM values.
Figure 7 shows the bone-implant contact ratios, RB-I, of
specimens in both the cortical bone part and the cancellous
bone part. As this figure illustrates, all of the anodized
specimens showed higher RB-I values [(b)(f)] than
as-polished [(a)]. Focusing on the specimens with anatasefilms,
specimens with high FWHM values (black bars, anodized in
5 M and 9 M H3PO4) tended to have higherRB-Ivalues in both
the cortical and the cancellous bone parts than specimens with
low FWHM values in thefilm (gray bars, anodized in 0.1 M
and 1 M H3PO4). In general, the bone-forming ability of
implants is said to be influenced by film properties such as
surface roughness,26) crystal structure,21,24) and the type of
electrolyte ions.28) However, the crystal structure and the
type of electrolyte ions did not show a relation to the
difference inRB-Ivalues among anodized specimens because
all of the anodized films had the same crystal structure
(anatase) and contained the same anion (PO43¹) in thefilms.
On the other hand, surface roughness, the crystallinity of
anatase, and/or PO43¹ content in the film might have
influence on the osteoconductivity because each of the
anodized specimens had different Ra, FWHM values, and
PO43¹ content in the film. As for the influence of surface
roughness on theRB-Ivalue, anodized specimens with a rough
surface (0.467¯Ra/µm¯0.730) showed higherRB-Ivalues
than anodized specimens with a fine surface (0.082¯Ra/
µm¯0.150). This result does not agree with our previous
report saying that a rough surface (Ra/µm>0.3) was not
better for hard tissue formation than a fine surface (Ra/
µm<0.3).26)On the other hand, the R
B-I values of anatase
changed corresponding to the FWHM values and PO43¹
content in the film, and amorphous anatase coatings tended
to show higherRB-Ivalues than crystallized anatase coatings.
This means that incorporation of PO43¹in thefilm improves
the osteoconductivity of anatase, and that the crystallinity
of anatase and/or PO43¹ content in the film had stronger
influence on the RB-I values of anatase films than surface
roughness. However, it was not clear which of crystallinity
of anatase or PO43¹ content in thefilm was intrinsic factor
to influence the osteoconductivity of amorphous anatase
because of interdependency of them. The scarcity of in vivo
reports on the influence of crystallinity and PO43¹content in
thefilm on bone formation also makes it difficult to discuss
the relative importance of the two factors. We will discuss the relationship between crystallinity and osteoconductivity
in more detail in a future report, using TiO2 films whose
crystallinity is controlled by another hydro-processing.
4. Conclusions
In this study, the effects of H3PO4content in the bath and
applied voltage on the crystal structure of TiO2 films were
investigated, and the followingfindings were obtained.
(1) Anatase coating was formed on Ti using anodizing
regardless of the concentration of H3PO4. Particularly
when Ti substrates were anodized under spark discharge
in concentrated H3PO4 aqueous solutions, the
amor-phous phase was formed in addition to the crystallized phase. The amorphous phase was formed by
incorpo-rating a large amount of PO43¹ into the TiO2 crystal
lattice.
(2) The amorphous anatase films showed a larger amount
of hard tissue formation on their surface than
crystal-lized anatasefilms in both of the cortical bone part and
cancellous bone part. This means that incorporation of
PO43¹in anatasefilm improves the osteoconductivity of
anatase.
(3) It is not exactly clear what was the dominant factor to
influence the osteoconductivity of anatase, but the
crystallinity of anatase and/or PO43¹ in the film are
considered to be the reason to make the difference in
bone-forming ability of TiO2films.
10 100
200
0 5
Applied v
oltage,
E
/ V
150
H3PO4 content in the bath, C / M
Fig. 6 Classified crystal phase of TiO2in relation to H3PO4content in the bath and applied voltage ( : crystallized anatase and : amorphous anatase).
40
20
0 3 45
n= 4 2
40
20
0
0 2 4 6 8
Bone-Implant contact ratio,
RB-I
(%)
(1)
(2)
Full width at half maximum (deg.) *
*
*
60
(a)
(c)
(d)
(e) (f)
(a)
(d) (e) (f)
(b)
(b)
(c)
*
* 5
* *
* 60
[image:4.595.81.258.72.203.2] [image:4.595.48.291.268.469.2]Acknowledgements
This work was partially supported by a Grant-in-Aid for
Scientific Research (C) (No. 21560719), Grant-in-Aid for
JSPS fellows (No. 2310401), and the Global COE program (COE for Education and Research of Micro-Nano Mecha-tronics) from the Japan Society for the Promotion of Science (JSPS).
REFERENCES
1) R. Adell, B. Eriksson, U. Lekholm, P. I. Branemark and T. Jemt: Int. J. Oral Maxillofac. Implants5(1990) 347359.
2) D. van Steenberghe, U. Lekholm, C. Bolender, T. Folmer, P. Henry, I. Herrmann, K. Higuchi, W. Laney, U. Linden and P. Astrand: Int. J. Oral Maxillofac. Implants5(1990) 272281.
3) R. A. Jaffin and C. L. Berman:J. Periodontol.62(1991) 24. 4) W. Khang, S. Feldman, C. E. Hawley and J. Gunsolley:J. Periodontol.
72(2001) 13841390.
5) K. Kuroda, R. Ichino, M. Okido and O. Takai:J. Biomed. Mater. Res. 59(2002) 390397.
6) K. Kuroda, R. Ichino, M. Okido and O. Takai:J. Biomed. Mater. Res. 61(2002) 354359.
7) K. Kuroda, Y. Miyashita, R. Ichino, M. Okido and O. Takai:Mater. Trans.43(2002) 30153019.
8) K. Kuroda, S. Nakamoto, R. Ichino, M. Okido and R. M. Pilliar:Mater. Trans.46(2005) 16331635.
9) K. Kuroda, S. Nakamoto, Y. Miyashita, R. Ichino and M. Okido:Mater. Trans.47(2006) 13911394.
10) K. Kuroda, M. Moriyama, R. Ichino, M. Okido and A. Seki:Mater. Trans.49(2008) 14341440.
11) K. Kuroda, M. Moriyama, R. Ichino, M. Okido and A. Seki:Mater. Trans.50(2009) 11901195.
12) R. Hazan, R. Brener and U. Oron:Biomaterials14(1993) 570574. 13) S. Fujibayashi, M. Neo, H.-M. Kim, T. Kokubo and T. Nakamura:
Biomaterials25(2004) 443450.
14) L. Jonasova, F. A. Muller, A. Helebrant, J. Strnad and P. Greil: Biomaterials25(2004) 11871194.
15) F. Xiao, K. Tsuru, S. Hayakawa and A. Osaka:Thin Solid Films441 (2003) 271276.
16) J.-M. Wu, S. Hayakawa, K. Tsuru and A. Osaka:Scr. Mater.46(2002) 101106.
17) K.-R. Wu, C.-H. Ting, W.-C. Lie, C.-H. Lin and J.-K. Wu:Thin Solid Films500(2006) 110116.
18) L. S. Hsu, R. Rujkorakarn, J. R. Sites and C. Y. She:J. Appl. Phys.59 (1986) 34753480.
19) Y.-T. Sul, C. B. Johansson, S. Petronis, A. Krozer, Y. S. Jeong, A. Wennerberg and T. Albreksson:Biomaterials23(2002) 491501. 20) J. P. Schreckenbach, G. Marx, F. Schlotigg, M. Textor and N. D.
Spencer:J. Mater. Sci. Mater. Med.10(1999) 453457.
21) B. Yang, M. Uchida, H.-M. Kim, X. Zhang and T. Kokubo: Biomaterials25(2004) 10031010.
22) L. A. de Sena, N. C. C. Rocha, M. C. Andrade and G. A. Soares:Surf. Coat. Tech.166(2003) 254258.
23) N. K. Kuromoto, R. A. Simao and G. A. Soares:Mater. Charact.58 (2007) 114121.
24) X. Cui, H.-M. Kim, M. Kawashita, L. Wang, T. Xiong, T. Kokubo and T. Nakamura:Dent. Mater.25(2009) 8086.
25) J.-H. Lee, S.-E. Kim, Y.-J. Kim, C.-S. Chi and H.-J. Oh:Mater. Chem. Phys.98(2006) 3943.
26) D. Yamamoto, I. Kawai, K. Kuroda, R. Ichino, M. Okido and A. Seki: Mater. Trans.52(2011) 16501654.
27) C. Y. Kramer:Biometrics12(1956) 307310.