Forecasting of the Consumption of Metals up to 2050
*Kohmei Halada, Masanori Shimada and Kiyoshi Ijima
Innovative Materials Engineering Laboratory, National Institute for Materials Science, Tsukuba 305-0047, Japan
Forecasts up to 2050 are made of consumption of the following metals: Fe, Al, Cu, Mn, Zn, Cr, Pb, Ni, Si, Sn, rare earths, Mo, Li, Sb, W, Ag, Co, In, Au, Ga, Pt and Pd. The forecasts are based on the linear decoupling model of the relation between per capita metal consumption and per capita GDP. The models of each metal are applied to the economic development model of BRICs and G6 countries. According to these forecasts, the overall consumption of metals in 2050 will be five times greater than the current levels, and demand for metals, such as Au, Ag, Cu, Ni, Sn, Zn, Pb and Sb, is expected to be several times greater than the amount of their respective reserves. Demand for Fe and Pt, which is considered to be optimistic about the resource exhaustion, will also exceed the current reserves. Urgent measures are needed to find alternatives from common resources and to shift into sound materials circulation society. [doi:10.2320/matertrans.ML200704]
(Received November 26, 2007; Accepted January 15, 2008; Published February 25, 2008)
Keywords: resource depletion, material consumption, economic development, reserve, reserve base
1. Introduction
The global demand of metal resources is increasing very rapidly. Scenarios of resource consumption from a back-casting viewpoint are required to reduce a resource supplying risk. In order to prepare these scenarios, a forecasting of resource consumption in a long term is necessary. ‘‘The
Global 2000 Report to the President’’1) was published at
1970s in the era of economic development. Forecasting
reports by Tilton2)and Cox3)were reported at 1990s in the era
of moderate growth. JOGMEC (Japan Oil, Gas and Metals
National Corporation) reported4)a medium-term forecast at
the latest days. JOGMEC’s report predicts that Cu con-sumption will increase up to the range between 19 million tons and 37 million tons, Pb will increase between 8.4 million and 9.55 million tons, Zn between 11.6 million and 14 million tons, and Ni between 1.8 million to 2.7 million tons. This paper makes a longer-term forecasting of the consump-tion of several metals up to the year 2050 in order to comprehend the degree of the resource supplying risk at the current moment.
Since the Club of Rome proposed ‘‘Limits of Growth’’ in 1970, continuous upward growth has not been a prerequisite of economic activities; rather, there has been a shift toward low resource consumption-based growth because of limited resources. The authors’ analyses of how the state of decoupling has appeared in the consumption of individual metals have revealed that most metals have reached a weak
state of decoupling.5) However, even though the state of
decoupling is required within the ‘‘Limits of Growth,’’ it was necessary to examine if sufficient conditions existed within a separate context. The results showed that not only economic development and material consumption in the case of Si has been moving from a state of coupling to decoupling, but metals such as Cu and Fe are also headed toward a state of decoupling, and demand is rising to construct a technological base that can bring about an even greater state of decoupling. In the 1960s, economic growth was limited to a relatively
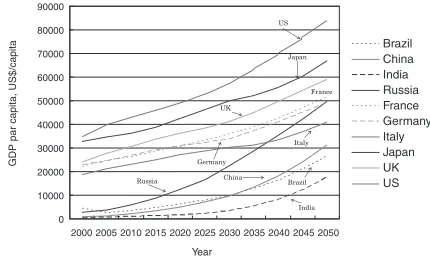
few countries that had about 20% of the world’s population, but economic growth today is occurring in heavily populated countries on a global scale, and it is doubtful whether the current process of decoupling will be able to react to the subsequent explosive growth in consumption. The present paper applies the authors’ model of per capita correlations of the state of decoupling of various metals to estimated for growth of so-called BRICs (Brazil, Russia, India, China), which will be showing remarkable growth into the near future, and the original G6 countries of Japan, USA, UK, France, Germany, and Italy to estimate the consumption of these metals until the year 2050. In addition, by looking at how much demand for resources will exceed the present reserve until the year 2050, this paper will be able to contribute to the discussion on ‘‘Limits of Growth’’ from a new time frame.
2. Methodology
Estimates of future population and GDP have been made
by various entities such as the United Nations.6)In October
2003, Goldman Sachs integrated estimates for GDP and population between BRICs and G6 countries in a report titled
‘‘Dreaming with BRICs: The Path to 2050’’.7)It should be
noted that this report was apparently the first to use the term ‘‘BRICs’’. Figure 1 shows estimated per capita GDP for each country up to the year 2050, while Fig. 2 shows population estimates for the countries. The per capita correlation for the consumption of various metals, shown as coefficients in
Table 1 by referring to the author’s book,5)were used in the
following equations:
yM ¼aM,0x ðx<cM,1Þ ð1Þ
yM ¼aM,1xþbM,1 ðcM,1<xÞ ð2Þ
Here,xshows the per capita GDP for each country in each
applicable year, andyMshows the per capita consumption of
a metal M. It should be noted that the right-side column of Table 1 shows reserves and reserve bases of these metals for the year 2005 in units of metal content (tons) based on data from the United States Bureau of Mines. In addition, the estimates for reserves of minerals are for the amounts which
*This Paper was Originally Published in Japanese in J. Japan Inst. Metals
71(2007) 831–839.
can be economically extracted with the present technology, while the reserve base refers to the amount of minerals which can technically be extracted but are not the object of extraction due to economic, political, and/or other reasons. In addition, existing consumption is the cumulative amount consumed through 2004. These values were obtained from estimates made of total consumption up to 1989 in the
‘‘Global Resource Strategies Note’’,8)while the consumption
data from 1990 onward were taken from the Mineral
Resource Data Book.9) Furthermore, for items for which
there are no cumulative values up to 1989, cumulative values started with the first year listed in the Mineral Resource Data Book.
These data were used first to estimate the amount of each metal consumed from 2005 onward, then the calculated values for each country were added on to estimate con-sumption for 5-year time blocks. Furthermore, the consump-tion of each metal for each year was interpolated from the 5-year block data and totaled to derive the cumulative consumption for up to that year.
3. Results
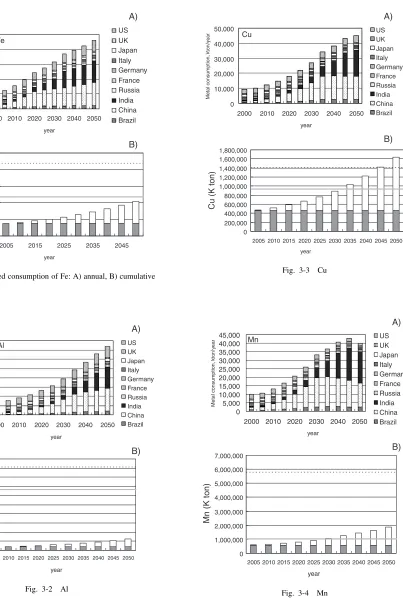
Figures from Fig. 4 onward show the results of calcula-tions for prediccalcula-tions. The A graph shows the calculated consumption of various metals for each year in a 5-year block which have been added together and depicted as bar graphs for consumption for each country. In the case of Fe, demand is expected to rise steadily to nearly 2.5 billion tons/year by 2050, or about 5 times the current consumption. In addition, looking at the make-up among nations, we can see the increase in demand in the G6 countries slows down, but China’s share of consumption will continue to rise steadily
until 2030, and after that, growth of consumption in India is expected to become a dominant factor in overall Fe consumption. The B graph shows cumulative consumption.
10 100 1000 10000
2000 2005 2010 2015 2020 2025 2030 2035 2040 2045 2050
Brazil China India Russia France Germany Italy Japan UK US Japan
Germany
Italy
China India
US
Brazil
Russia
UK France
Year
P
opulation, million
[image:2.595.317.532.73.201.2]Fig. 2 Population growth predicted by Goldman Sachs.
Table 1 Factors of models and reserves of each metal.
Line A Line B Transition accumulate consumption Reserve Reserve
Type metal unit
aM,1 aM,2 bM,2 GDP$/capita unit 2004 base
I Au g/capita 0.00015 0:000069 5.16 23,900 2:821010 7:901010 1:801011
I Sn Kg/capita 0.000048 0:0000023 0.3 8,300 9:50104 4:20104 9:00104
I Zn Kg/capita 0.0009 0:000031 6.7 7,200 4:19108 4:70108 9:40108
I W g/capita 0.008 :0001 48.2 5,400 7:19108 1:321010 1:691010
I Cr Kg/capita 0.0006 0:00014 9.0 12,200 1:33107 6:10106 1:10107
I Mn Kg/capita 0.0012 0:00012 13.6 10,300 3:77107 6:20107 1:40108
I0 Cu Kg/capita 0.00084 0 11.0 13,200 3:55104 4:00104
I0 Pb Kg/capita 0.00062 0 2.8 4,600 1:02104 3:55104 4:00104
II Fe Kg/capita 0.070 0.0066 336 10,700 8:25106
II Al Kg/capita 0.0013 0.00054 10.6 13,800 2:29103 1:50104 1:00106
II Ni Kg/capita 0.00012 0.000021 0.69 7,100 2800 6000
II Mo g/capita 0.0105 0.0023 61.4 10,700 1:51107 7:00106 1:30107
II Sb g/capita 0.0094 0.00069 52.0 9,800 4:65106 8:60106 1:90107
II Ag g/capita 0.0023 0.00045 10.6 5,600 4:57106 1:80106 3:90106
II Pd g/capita 0.000025 0.0000082 0.19 11,300 9:83108 8:10108 1:80109
III Pt g/capita 0.000013 0 — 4:42106 4:10106 1:10107
III Si Kg/capita 0.000039 0 — 5:92108 4:30108 5:20109
III0 Co g/capita 0.0018 0.0028 0 — 1:52106 8:80107 1:50108
III0 RE g/capita 0.0022 0.0057 0 — 2:51106 2:90106 6:20106
III0 Ga g/capita 0.000016 0.000031 0 — 3:22108 2:20108 4:60108
III0 Li g/capita 0.0016 0.0030 0 — 1:70108 6:70107 1:40108
III0 In g/capita 0.000016 0.0007 0 — 6:43105 2:70105 5:70105
Year 0
10000 20000 30000 40000 50000 60000 70000 80000
2000 2005 2010 2015 2020 2025 2030 2035 2040 2045 2050
Brazil China India Russia France Germany Italy Japan UK US US
Japan
UK
Germany
France
Italy
China Brazil
India Russia
GDP par capita, US$/capita
[image:2.595.47.553.497.785.2]The darker bottom sections of the bars depict the existing cumulative consumption at 2005, while the lighter shaded sections show the accumulated consumption that is predicted for the applicable year. The solid line shows the sum of existing cumulative consumption and current reserves, while the dashed line depicts the sum of existing cumulative consumption and reserve base. In the case of Fe, the cumulative consumption at 2050 is predicted to be at roughly
the same level as current reserves, so demand will rise to withdraw from the existing economic system and develop new materials.
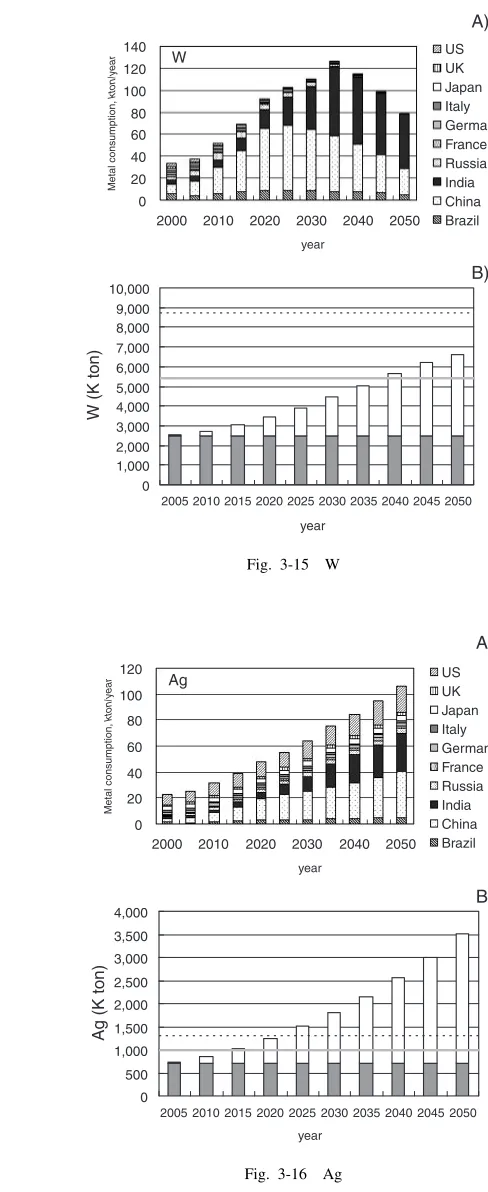
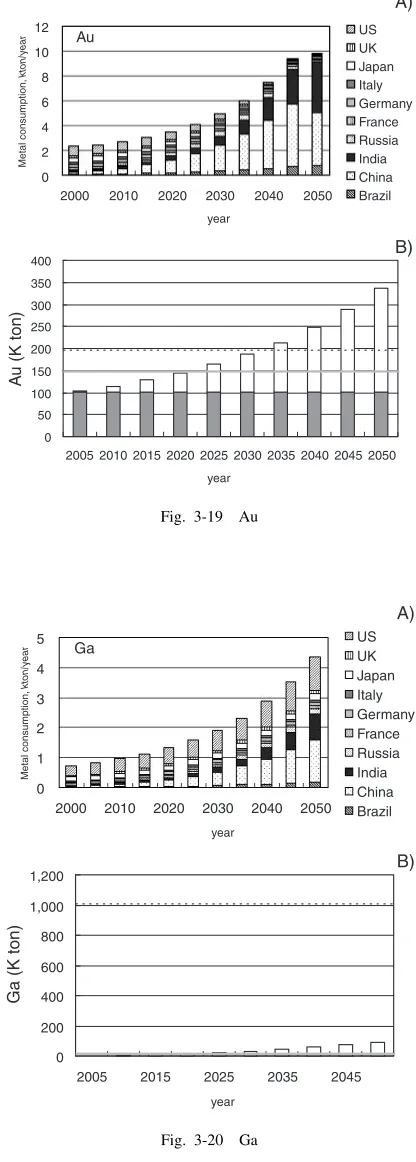
Figures 3 through 24 show estimated results, in identical formats, of predicted consumption at the year 2050 of the following metals: Al, Cu, Mn, Zn, Cr, Pb, Ni, Si, Sn, rare earths, Mo, Li, Sb, W, Ag, Co, In, Au, Ga, Pt, and Pd, respectively. It should be noted that since there were no 0
500,000 1,000,000 1,500,000 2,000,000 2,500,000
2000 2010 2020 2030 2040 2050
US UK Japan Italy Germany France Russia India China Brazil
year
Metal consumption,
kton/y
ear
A)
Fe
0 50,000,000 100,000,000 150,000,000 200,000,000 250,000,000
2005 2015 2025 2035 2045
F
e
(K ton)
year
[image:3.595.122.525.62.660.2]B)
Fig. 3-1 Estimated consumption of Fe: A) annual, B) cumulative
0 10,000 20,000 30,000 40,000 50,000 60,000 70,000 80,000
2000 2010 2020 2030 2040 2050
US UK Japan Italy Germany France Russia India China Brazil
year
Metal consumption,
kton/y
ear
A)
Al
0 2,000,000 4,000,000 6,000,000 8,000,000 10,000,000 12,000,000 14,000,000 16,000,000 18,000,000 20,000,000
2005 2010 2015 2020 2025 2030 2035 2040 2045 2050
Al (K ton)
year
[image:3.595.321.528.71.645.2]B)
Fig. 3-2 Al
0 10,000 20,000 30,000 40,000 50,000
2000 2010 2020 2030 2040 2050
US UK Japan Italy Germany France Russia India China Brazil
year
Metal consumption,
kton/y
ear
A)
Cu
0 200,000 400,000 600,000 800,000 1,000,000 1,200,000 1,400,000 1,600,000 1,800,000
2005 2010 2015 2020 2025 2030 2035 2040 2045 2050
Cu (K ton)
year
[image:3.595.66.273.77.325.2]B)
Fig. 3-3 Cu
0 5,000 10,000 15,000 20,000 25,000 30,000 35,000 40,000 45,000
2000 2010 2020 2030 2040 2050 US UK Japan Italy Germany France Russia India China Brazil
year
Metal consumption,
kton/y
ear
A)
Mn
0 1,000,000 2,000,000 3,000,000 4,000,000 5,000,000 6,000,000 7,000,000
2005 2010 2015 2020 2025 2030 2035 2040 2045 2050
Mn (K ton)
year
[image:3.595.65.272.382.651.2]B)
reserve data available for Si, there is no reserve line for it in its figure.
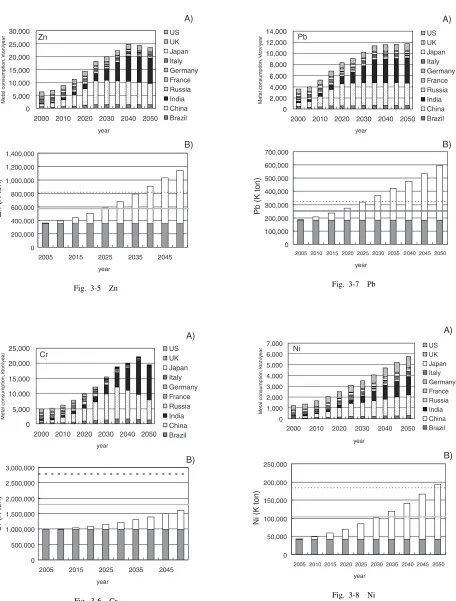
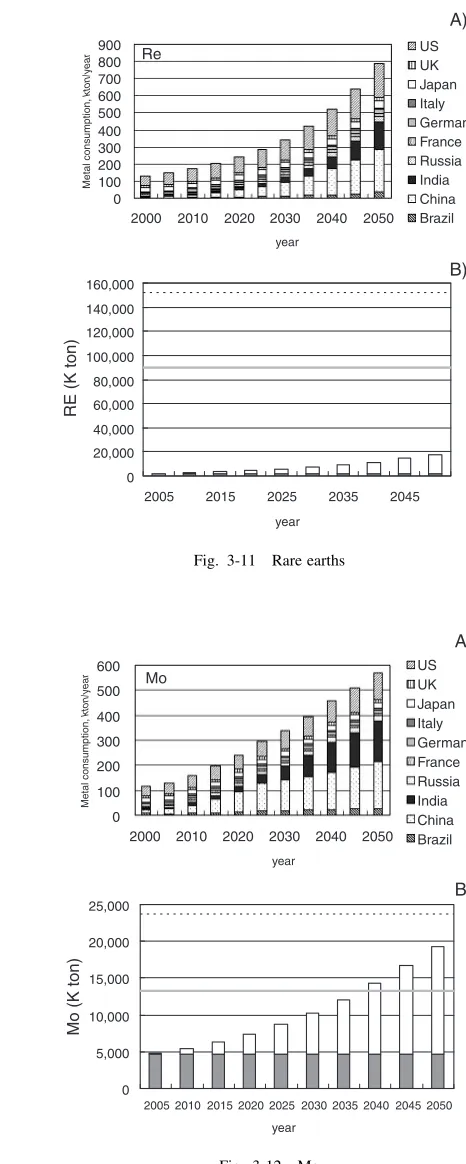
The consumption of all target metals is expected to increase until 2040. However, the decoupling effect should appear for Mn, Zn, Cr, Pb, and Sn, and their annual consumption should decrease. The main consumers of these metals are expected to shift from G6 to BRICs. However, in the cases of Si, Li, In, Ga, Pt, and Pd, the share of
consumption in G6 is expected to remain large, even in 2050. Nevertheless, BRICs will still likely account for more than 50% of total consumption of all of these metals.
Looking at the relation between cumulative consumption and present reserves, it appears that consumption of only a
few metals,i.e., Fe, Al, Cr, Co, and rare earths, will be at or
below the present reserve levels. Furthermore, the current reserves of Fe will likely be depleted by 2050. At the same
0 5,000 10,000 15,000 20,000 25,000 30,000
2000 2010 2020 2030 2040 2050 US UK Japan Italy Germany France Russia India China Brazil
year
Metal consumption,
kton/y
ear
A)
Zn
0 200,000 400,000 600,000 800,000 1,000,000 1,200,000 1,400,000
2005 2015 2025 2035 2045
Zn (K ton)
year
[image:4.595.65.273.52.659.2]B)
Fig. 3-5 Zn
0 5,000 10,000 15,000 20,000 25,000
2000 2010 2020 2030 2040 2050 US UK Japan Italy Germany France Russia India China Brazil
year
Metal consumption,
kton/y
ear
A)
Cr
0 500,000 1,000,000 1,500,000 2,000,000 2,500,000 3,000,000
2005 2015 2025 2035 2045
Cr (K ton)
year
B)
Fig. 3-6 Cr
0 2,000 4,000 6,000 8,000 10,000 12,000 14,000
2000 2010 2020 2030 2040 2050 US UK Japan Italy Germany France Russia India China Brazil
year
Metal consumption,
kton/y
ear
A)
Pb
0 100,000 200,000 300,000 400,000 500,000 600,000 700,000
2005 2010 2015 2020 2025 2030 2035 2040 2045 2050
Pb (K ton)
year
[image:4.595.320.527.54.648.2]B)
Fig. 3-7 Pb
0 1,000 2,000 3,000 4,000 5,000 6,000 7,000
2000 2010 2020 2030 2040 2050
US UK Japan Italy Germany France Russia India China Brazil
year
Metal consumption,
kton/y
ear
A)
Ni
0 50,000 100,000 150,000 200,000 250,000
2005 2010 2015 2020 2025 2030 2035 2040 2045 2050
Ni (K ton)
year
B)
[image:4.595.73.529.60.661.2]time, demand for In, Sn, Ag, Zn, Pb, Au, Cu, Ni and Pd will likely exceed the reserve base. While consumption of most of these metals is expected to slacken off after 2040, the state of decoupling will probably not be achieved due to the limitations of resources expressed in the reserve base.
4. Discussion
In order to make the relation between metals consumption
and reserves more understandable, expected cumulative consumption at 2020 was compared with the present reserves, as shown in Fig. 4. The downward-extending bars in the figure represent today’s reserves. The upper bars indicate the reserve base when reserves are set at 1. When an upward-extending bar graph crosses the 1 line, it signifies that the amount of current reserves has been depleted; when it passes a bar, it means that the reserve base has been depleted. By 2020, it is predicted that the cumulative consumption of
0 1,000 2,000 3,000 4,000 5,000 6,000
2000 2010 2020 2030 2040 2050 US UK Japan Italy Germany France Russia India China Brazil
year
Metal consumption,
kton/y
ear
A)
Si
0 20,000 40,000 60,000 80,000 100,000 120,000 140,000
2005 2010 2015 2020 2025 2030 2035 2040 2045 2050
Si (K ton)
year
[image:5.595.65.275.60.644.2]B)
Fig. 3-9 Si
0 200 400 600 800 1,000 1,200
2000 2010 2020 2030 2040 2050
US UK Japan Italy Germany France Russia India China Brazil
year
Metal consumption,
kton/y
ear
A)
Sn
0 5,000 10,000 15,000 20,000 25,000 30,000 35,000 40,000 45,000 50,000
2005 2010 2015 2020 2025 2030 2035 2040 2045 2050
Sn (K ton)
year
[image:5.595.292.525.69.651.2]B)
Fig. 3-10 Sn
0 100 200 300 400 500 600 700 800 900
2000 2010 2020 2030 2040 2050 US UK Japan Italy Germany France Russia India China Brazil
year
Metal consumption,
kton/y
ear
A)
Re
0 20,000 40,000 60,000 80,000 100,000 120,000 140,000 160,000
2005 2015 2025 2035 2045
RE (K ton)
year
B)
Fig. 3-11 Rare earths
0 100 200 300 400 500 600
2000 2010 2020 2030 2040 2050 US UK Japan Italy Germany France Russia India China Brazil
year
Metal consumption,
kton/y
ear
A)
Mo
0 5,000 10,000 15,000 20,000 25,000
2005 2010 2015 2020 2025 2030 2035 2040 2045 2050
Mo (K ton)
year
B)
[image:5.595.67.516.75.654.2]In, Ag and Pb will be exceeded the current reserves, and the present reserves of Au, Cu and Sn will be depleted. In fact, Ag will already be experiencing immense pressure on its reserve base by that time. In the case of In, consumption at that time is expected to have grown to 20 times the current reserves, so it will not be possible to meet demand unless sufficient technological advances are made and/or drastic revisions are made in target resources.
Figure 5 shows that in 2050, the situation will be even more gloomy. The current reserves of nearly all metals will have become depleted, and even the reserve base will be exceeded. In the previously mentioned case of In, the metal has a relatively short history and there is plenty of room for technical reconsiderations about its use as a resource, extracting and smelting technologies, etc. But this is not the case for Cu, Au, Ag, etc., for which extraction and
0 50 100 150 200 250 300 350 400 450
2000 2010 2020 2030 2040 2050 US UK Japan Italy Germany France Russia India China Brazil
year
Metal consumption,
kton/y
ear
A)
Li
0 2,000 4,000 6,000 8,000 10,000 12,000 14,000 16,000 18,000
2005 2010 2015 2020 2025 2030 2035 2040 2045 2050
Li (K ton)
year
B)
Fig. 3-13 Li
0 50 100 150 200 250 300 350
2000 2010 2020 2030 2040 2050 US UK Japan Italy Germany France Russia India China Brazil
year
Metal consumption,
kton/y
ear
A)
Sb
0 2,000 4,000 6,000 8,000 10,000 12,000 14,000
2005 2015 2025 2035 2045
Sb (K ton)
year
[image:6.595.280.524.68.664.2]B)
Fig. 3-14 Sn
0 20 40 60 80 100 120 140
2000 2010 2020 2030 2040 2050 US UK Japan Italy Germany France Russia India China Brazil
year
Metal consumption,
kton/y
ear
A)
year
B)
W
0 1,000 2,000 3,000 4,000 5,000 6,000 7,000 8,000 9,000 10,000
2005 2010 2015 2020 2025 2030 2035 2040 2045 2050
W (K ton)
Fig. 3-15 W
0 20 40 60 80 100 120
2000 2010 2020 2030 2040 2050 US UK Japan Italy Germany France Russia India China Brazil
year
Metal consumption,
kton/y
ear
A)
Ag
0 500 1,000 1,500 2,000 2,500 3,000 3,500 4,000
2005 2010 2015 2020 2025 2030 2035 2040 2045 2050
Ag (K ton)
year
B)
[image:6.595.78.376.75.653.2]processing technologies have already matured. Regarding metals for which mines have been developed and exploration is being undertaken on a global scale, dramatic technological innovations like those which were made up to the 20th century are needed to make extremely effective device designs and material designs to match consumption and use patterns. Demand is also rising for technological development of alternative resources that still have some latitude like Al, and for all-out efforts to develop alternative
and recycling technologies so that once used resources can be used again.
It should be noted that two factors can affect the accuracy of these predictions. One is the applicability of the per capita correlation values between metal consumption and GDP; the other the accuracy of the Goldman Sachs predictions. In the case of the former, we can get a good idea of the accuracy by considering the error between actual data obtained for metal consumption, GDP, and population, and predictions based on
0 50 100 150 200 250 300 350 400 450
2000 2010 2020 2030 2040 2050 US UK Japan Italy Germany France Russia India China Brazil
year
Metal consumption,
kton/y
ear
A)
Co
0 5,000 10,000 15,000 20,000 25,000 30,000
2005 2015 2025 2035 2045
Co (K ton)
year
[image:7.595.65.275.73.656.2]B)
Fig. 3-17 Co
0 2 4 6 8 10 12
2000 2010 2020 2030 2040 2050 US UK Japan Italy Germany France Russia India China Brazil
year
Metal consumption,
kton/y
ear
A)
In
0 50 100 150 200 250
2005 2010 2015 2020 2025 2030 2035 2040 2045 2050
In (K ton)
year
B)
Fig. 3-18 In
0 2 4 6 8 10 12
2000 2010 2020 2030 2040 2050 US UK Japan Italy Germany France Russia India China Brazil
year
Metal consumption,
kton/y
ear
A)
Au
0 50 100 150 200 250 300 350 400
2005 2010 2015 2020 2025 2030 2035 2040 2045 2050
A
u
(K ton)
year
[image:7.595.66.520.75.654.2]B)
Fig. 3-19 Au
0 1 2 3 4 5
2000 2010 2020 2030 2040 2050 US UK Japan Italy Germany France Russia India China Brazil
year
Metal consumption,
kton/y
ear
A)
Ga
0 200 400 600 800 1,000 1,200
2005 2015 2025 2035 2045
Ga (K ton)
year
[image:7.595.322.530.78.659.2]B)
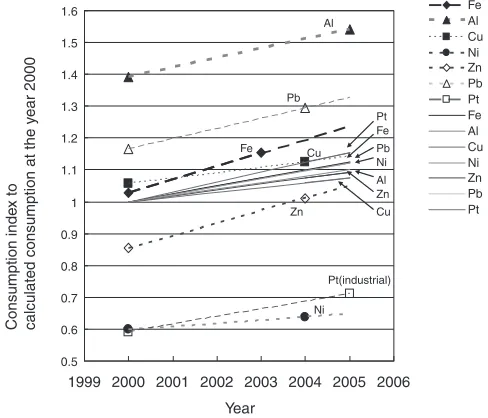
the per capita correlation values. Moreover, the accuracy of growth predictions can be understood by comparing them with actual data from 2004. In Fig. 6, some calculated results (for 2000 to 2005) for Fe, Al, Cu, Ni, Zn, Pb, and Pt are plotted as a solid line against data from 2000 and 2004 (2003 for Fe, 2005 for Al and Pt). Trends in actual consumption were roughly the same or slightly higher than predicted values, and, while it is for a short period, the increase in consumption was at or above the predicted level. Discrep-ancies between the model and values for 2000 were seen with
Zn, Ni, and Pt. Regarding Zn, actual growth trend was larger than the predicted trend, but there was little difference between the actual and model values, so it appears that downward error will disappear in the future. In addition, the error in the Pt values was likely caused by the fact that actual values for Pt for both 2000 and 2004 were only for industrial
0.0 0.5 1.0 1.5 2.0
2000 2010 2020 2030 2040 2050 US UK Japan Italy Germany France Russia India China Brazil
year
Metal consumption,
kton/y
ear
A)
Pt
0 10 20 30 40 50 60
2005 2010 2015 2020 2025 2030 2035 2040 2045 2050
Pt (K ton)
year
[image:8.595.307.546.74.210.2]B)
Fig. 3-21 Pt
0 1 2 3
2000 2010 2020 2030 2040 2050 US UK Japan Italy Germany France Russia India China Brazil
year
Metal consumption,
kton/y
ear
A)
Pd
0 10 20 30 40 50
2005 2015 2025 2035 2045
Pd (K ton)
year
[image:8.595.67.272.76.645.2]B)
Fig. 3-22 Pd
Reserves base
−3 −2 −1 0 1 2
Fe Al Cu Mn Zn Cr Pb Ni Sn RE Mo Li Co Sb Ag W Au In Ga Pd Pt
Reserves
Existing mining quantity
Metals
Accumulation consumption / Reserves,
Comparatively
Fig. 4 The relation between cumulative demand and existing reserves by 2020.
−3 −2 −1 0 1 2 3 4 5 6 7
Fe Al Cu Mn Zn Cr Pb Ni Sn RE Mo Li Co Sb Ag W Au In Ga Pd Pt
10.3 72
Metals
Accumulation consumption / Reserves,
Comparatively
Fig. 5 The relation between cumulative demand and existing reserves by 2050.
Year
Consumption inde
x to
calculated consumption at the y
ear 2000
0.5 0.6 0.7 0.8 0.9 1 1.1 1.2 1.3 1.4 1.5 1.6
1999 2000 2001 2002 2003 2004 2005 2006
Fe Al Cu Ni Zn Pb Pt Fe Al Cu Ni Zn Pb Pt
Al
Al Pb
Fe Cu
Zn
Pt(industrial)
Ni Pt Fe Pb Ni
Zn
Cu
[image:8.595.309.546.265.400.2] [image:8.595.305.549.456.665.2]uses, while the consumption model included demand for Pt for jewelry. In the case of Ni discrepancies, upon close inspection it appears that the cause huge differences between actual and predicted values for the United States and European countries. This is because the main use of Ni is as a material for providing corrosion resistance in stainless steel, etc., and the consumption model for high-temperature, high-humidity Japan does not correspond with the consump-tion structure for the United States and Europe. However, given that three of the BRICs have corrosive environments that are as bad as or worse than Japan’s, it appears that the Japanese model will have much greater compatibility in the future.
Thus, investigation of the factors affecting the accuracy of the prediction models have shown that there are few factors that result in excessive evaluations by the models at the present time. As shown in Fig. 5, the current reserves, and even the reserve base will be greatly exceeded by demand by 2050, so it will be necessary to resolve issues related to demand for metal consumption. In other words, demand will arise to make a concerted effort to reduce use and increase utilization efficiency, devise alternative materials which can manifest the same functions using elements in resource groups having high universality, and quickly develop technologies for recycling resources that are extracted from the ground used one time. To put it another way, as in agriculture where self-generating plants will be almost completely non-existent in the future, there will only be a very few cases where metal resources will be extracted from the ground. Rather, most resources will be man-made products or by-products, and it can be said that pressure is growing to shift relatively quickly to a system where resources are obtained from intermediate processed goods.
5. Concluding Remarks
The development of BRICs is leading to such demand for materials that by 2050, consumption of these materials will be 5 times what it is today. This will make it impossible to meet the demand solely with existing resource reserves. Furthermore, it is predicted that the consumption of some metals will even exceed their reserve base, so demand will rise to reconsider the use of these resources, and develop revolutionary new means of acquiring and recycling resour-ces. Compared with increasing demand for such materials, the sustainability of decoupling at the current GDP level of the G6 countries would be much farther away, so demand is rising to quickly further entrench decoupling with revolu-tionary technological innovations.
REFERENCES
1) ‘‘The Global 2000 Report to the President’’, U.S.A. Government Report (1977).
2) ‘‘World Metal Demand Trends and Prospects’’, Ed. by J. E. Tilton, Colorado School of Mines (1990).
3) A. J. Cox, B. Nagel and K. Lawson: Factors Influencing Demand for Metals, Australian Bureau of Agricaltural and Resurce Economics, (1990).
4) ‘‘Sekaino Base-Metal Shouhi Doukou Bunseki 2005’’, Japan Oil, Gas and Metals National Corporation (2005).
5) K. Halada, M. Shimada and K. Ijima: Mater. Trans.49(2008) 411–418. 6) United Nations, World Population Prospects (2004).
7) Dominic Wilson & Roopa Purushothaman, ‘‘Dreaming With BRICs: The Pathto 2050’’ Goldman Sachs Global Economic Paper No. 99 (2003)http://www2.goldmansachs.com/insight/research/reports/99.pdf 8) A. Tada: Chikyuu Shigen Senryaku Nouto, (Hakua Shobou, Tokyo,
1994) p. 113.