New Technique for Evaluation of Preferential Alignment of Biological Apatite
(BAp) Crystallites in Bone Using Transmission X-ray Diffractometry
Katsunari Sasaki
1;2;*1, Takayoshi Nakano
3;*2, Joseph D. Ferrara
2,
Jee-Wook Lee
3and Toshihiko Sasaki
11Division of Innovative Technology and Science, Graduate School of Natural Science & Technology,
Kanazawa University, Kanazawa 920-1192, Japan
2Rigaku Corporation, Akishima 196-8666, Japan
3Division of Materials and Manufacturing Science, Graduate School of Engineering, Osaka University, Suita 565-0871, Japan
Two-dimensional quantitative analysis of point focus X-ray beam diffraction (XRD) was performed using a transmission optics system to examine the biological apatite (BAp) orientation in the femurs of an osteopetrotic (op/op) mouse and a normal mouse. The Mo K(wavelength: 0.07107 nm) was used as characteristic X-ray radiation as a substitute for conventional Cu K(wavelength: 0.15418 nm) radiation. At first a theoretical calculation concerning with X-ray absorption and peak resolution was performed, and subsequently X-ray diffraction measurements were carried out to confirm the usefulness of the transmission X-ray method by Mo Kradiation. The distribution of the preferential orientation of the BApc-axis was finally measured and calculated as an integrated intensity ratio of (002)/(310) in a plane roughly containing the bone longitudinal axis. The result resembled analysis from a conventional reflection X-ray diffraction method by Cu K radiation but this transmission optics system was more convenient for the screening of BAp orientation in bones without sectioning.
The distribution of the preferential alignment of the BApc-axis was measured as a function of the longitudinal axis in the femurs of a 12-week mutant osteopetrotic (op/op) mouse and a littermate control mouse. The preferential alignment of the BApc-axis along the longitudinal direction is much lower in the op/op mouse than in the control mouse in all analytical positions. The transmission optics system using Mo K radiation in this study provides a fuss-free method for analyzing BAp orientation as a bone quality parameter.
[doi:10.2320/matertrans.MER2008160]
(Received May 19, 2008; Accepted June 16, 2008; Published August 25, 2008)
Keywords: op/op, osteopetrosis, biological apatite crystallite, bone quality, X-ray diffraction, transmission method, X-ray absorption, imaging plate
1. Introduction
X-ray diffraction is a well-known, useful method to evaluate materials properties. Diffraction is caused by reflection of the X-ray on the crystal plane, so this method is mainly used to evaluate the crystal properties such as lattice parameters, crystallinity, preferred orientation, resid-ual stress, etc. In general, crystalline structural materials based on metals, ceramics, and plastics are originally com-posed of randomly or weakly oriented crystallites. Modifi-cation of the crystal property such as preferred orientation and residual stress, however, can control or improve the materials properties. Recently, the X-ray diffraction tech-nique has been dramatically improved by the development of such two-dimensional detectors as Imaging Plate (IP), Multi Wire Proportional Counter (MWPC), and Charge Coupled
Device (CCD).1)These techniques provide two-dimensional
information on the basis of the crystal properties in the
materials, dramatically reducing measurement time.2)
Bone is a typical biological structural material that requires mechanical properties to support body weight and to protect the internal organs. Bone tissue is a composite dominantly comprised of biological apatite (BAp) crystallite as its
mineral constituent and collagen as its organic matrix.3)The
mineral component of bone tissue has two primary functions: mechanical and homeostatic. The BAp crystals reinforce the organic matrix by giving it strength and rigidity, while also serving as a repository of Ca, Mg, inorganic phosphate
ions, etc. To perform their crucial role in bone, BAp
cry-stallites have a relatively narrow range of sizes (1000nm),
and generally their mineral properties differ depending on
age, health, or the presence of disease.4)Understanding the
structural and chemical transformations of BAp and the role of environmental constraints in determining the structure and the composition of ultimate bone mineral are all relevant
biological and medical issues.5)
Bone is usually evaluated using bone mineral density (BMD). But recent research suggests that BMD is an insufficient predictor of bone mechanical properties and is
related to bone strength and fracture risk.6,7) In the various
parameters of bone microstructure, Nakanoet al.have been
focusing on the preferential orientation of BAp crystallites analyzed by a micro-beam X-ray diffraction technique
because the preferential alignment of the BAp c-axis in
various bones varies depending on the shape, the stress
distribution in vivo, and the related mechanical function.8)
The analysis of BAp orientation also clarifies the bone regeneration process under a tissue engineering technique since BAp orientation and BMD independently change
during bone regeneration.9,10)
Cu K radiation is used for almost all X-ray diffraction
studies. Since the absorption coefficient of the X-ray beam is
quite large through the BAp crystallite, the Cu Kbeam can
only provide information about the bone surface,11)so it is
not sufficient for biomedical applications, even on isolated bone specimens; the specimen must be exposed by cutting when internal bone microstructure is analyzed.
Thus, the purpose of this study is to apply the transmission X-ray diffraction method with higher energy characteristic
*1Graduate Student, Kanazawa University
X-ray Mo Kradiation on mouse femur without sectioning. As a result, high energy radiation reduced the effect of absorption due to improvements of the signal-to-noise ratio and successfully analyzed the internal microstructure in bone
specimens without cutting. The distribution of the BApc-axis
was clarified as a function of longitudinal bone axis in the femur bone of a 12-week osteopetrotic (op/op) mouse in which osteoclasts rarely appear due to a defect in the expression of the macrophage colony-stimulating factor (M-CSF) compared with the littermate mouse as a control using a transmission X-ray diffraction system.
2. Materials and Methods
2.1 Bone and reference specimens
Two right femurs were removed from a 12-week-old op/op mouse and the littermate mouse, fixed, and kept in a 10% formalin neutral buffered solution. Figure 1 shows a photograph of the bones used for this experiment. The op/op mouse specimen is from a mutant osteopetrotic (op/op) mouse, and the control specimen is from a normal mouse, a littermate of the op/op mouse. Since the femur of op/op mouse is shorter than that of the control mouse, the op/op mouse showed typical osteopetrosis.
2.2 X-ray micro-CT
The internal structure of each bone was observed by a Rigaku R mCT equipped with a micro X-ray CT scanner especially designed for small animal imaging. The unit
operated X-ray power at 90 kV and 88mA with an exposure
time of 17 s.
2.3 X-ray diffraction analysis
All the X-ray diffraction experiments were performed using a prototype of the Rigaku R-AXIS Bone Quality (BQ) system. As the X-ray detector, this system employs an
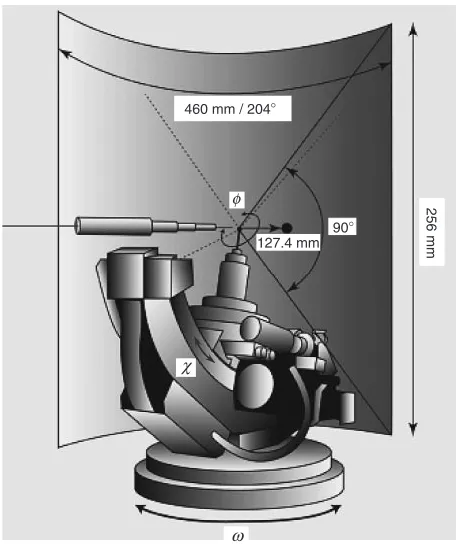
imaging plate (storage phosphors) developed by Fuji Film Co., Ltd. The geometry of the apparatus, which resembles a vertical Weissenberg camera, was mainly designed for single crystal X-ray structure analysis and charge density study. Figure 2 shows a schematic drawing of the prototype of the Rigaku R-AXIS BQ X-ray optics system. The distance between the detector and the X-ray focus of the specimen is 127.4 mm in a horizontal direction. The detected area on the
imaging plate is256mm460mm with a curvature on the
horizontal plane. This provides a 2 range from 60 to
+144 in the horizontal direction and a2range of45in
the vertical direction. The pixel area of the imaging plate is
100mm100mm. In the study, a Rigaku ultra X rotating
anode X-ray generator with either a copper (¼0:15418
nm) or a molybdenum ( ¼0:07107nm) target was used
accompanied with a graphite monochromator. The mono-chromator provides substantial monochromatic radiation of the wavelength. A 0.3-mm double-pinhole metal collimator was used, and the X-ray generator was operated at 50 kV and 90 mA (4.5 kW). Both copper and molybdenum radiation were used to examine the behavior of the X-ray absorption in the NIST apatite (hydroxyapatite; NIST #2910) powder which was inserted into a glass capillary (diameter: 1.5 mm).
The exposure times of the X-ray Mo K radiation for the
NIST apatite and the bone specimens were 10 minutes and 1 minute, respectively.
The specimens were oriented on a 3-circle Eulerian goniometer with an X-Y-Z stage. The Eulerian angles were
, , and !. The -axis was closest to the specimen and
provided complete specimen rotation around that axis. The
-axis, the next closest to the specimen, was used to tilt the
specimen. In general, the other!-axis is used as a scanning
axis. The specimens were moved to their desired positions by 1
2
3
4
5
6
7
8
9
10
1
2
3
4
5
6
7
8
9
10
(a) op/op
(b) control
16.9 mm 14.6 mm
2 mm
Fig. 1 Appearance of mouse femurs used and analyzed positions for X-ray diffractometry: (a) op/op; (b) control.
460 mm / 204°
256 mm
φ
127.4 mm
ω χ
90°
[image:2.595.312.540.71.347.2] [image:2.595.48.290.71.309.2]the X-Y-Z stage. The distribution of the X-ray absorption of the bone specimens was measured by a Rigaku X-ray scintillation counter operating in the integrating mode. It is easy to change the transmitted X-ray direction against the specimen between the anterior-posterior and medial-lateral
directions by rotation of 90around theaxis.
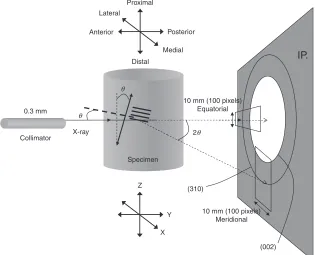
Figure 3 shows a schematic drawing of the optics system and the obtainable diffraction rings. The X-ray diffraction data were recorded using Rigaku R-AXIS BQ software. For each bone specimen, measurements were carried out at the 10 positions described in Fig. 1. The measurements were repeated three times after removing and again fixing the specimen on the X-Y-Z stage. For directions parallel and perpendicular to the longitudinal bone axis, a 10-mm length on the imaging plate along the tangential line to the diffraction rings was extracted in both the equatorial and meridional areas of the images, and the intensity of the diffracted beams in the corresponding area was converted as
a function of2as an X-ray diffraction profile. In the X-ray
profile, the (002) and (310) reflections were identified, and the integrated intensity and the intensity ratio of (002) to (310) were calculated. The intensity ratio corresponds to the
preferential alignment of thec-axis of the BAp crystallites,
as shown previously.8)
3. Results and Discussion
3.1 Micro-CT images
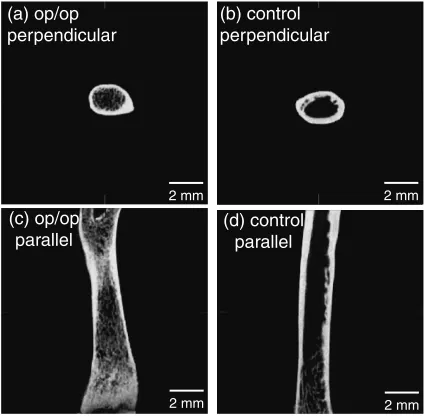
Figure 4 shows cross-sections based on the micro-CT images of the perpendicular and parallel directions to the longitudinal bone axis in the femurs of the op/op and control mice. Bone malformation was clearly found in the op/op mouse. The longitudinal axis of the femur of the op/op
mouse was shorter than that in the control mouse. In arbitrary cross-sections perpendicular or parallel to the longitudinal direction in the femurs, the calcified area relative to the total cross-sectional area was greater in the op/op mouse than in the control mouse, which means that the op/op mouse shows typical osteopetrosis with superfluous bone formation. In other words, the femur of the op/op mouse possesses developed cancellous bone in the medullary cavity within the thin wall of the cortical bone, while bone trabeculae only appear in the metaphyseal portion of the femur in the control mouse.
3.2 Absorption
X-ray absorption is described by the following equation:
I¼I0et;
whereIis the intensity of the transmitted X-ray beam,I0 is
the intensity of the incident X-ray beam,is the absorption
coefficient in cm1, andtis the thickness of the sample in cm.
In general, X-ray absorption quickly decreases with increas-ing wavelength. In the case of hydroxyapatite, a nominal
density of 3.19 g/cm2, ¼159:09cm1 for Cu K, and
¼19:12cm1for Mo Kcan be given. Substituting these
values into the above equation with a thickness of 0.05 cm
for the bone specimen indicates that 99.96% of the Cu K
X-ray would be absorbed but only 38.4% of Mo KX-ray
would be absorbed. This suggests that Mo K X-ray
radiation is a much better choice for this experiment for using a transmission optics system.
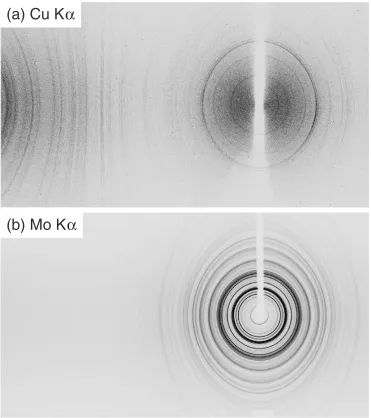
Confirmation of this claim is shown experimentally in Fig. 5, which shows diffraction patterns for NIST apatite
using Cu KX-ray and Mo K X-ray radiation. The only
difference between the exposures is the radiation type; all Proximal
Distal
Posterior Anterior
Lateral
Medial
Z
Y
X Collimator
0.3 mm
X-ray
θ
θ
2θ
10 mm (100 pixels) Equatorial
(310)
(002) 10 mm (100 pixels)
Meridional
IP.
Specimen
[image:3.595.141.456.75.330.2]other experimental variables were held constant. The pattern
exposed by the Cu KX-ray is obviously of lower quality
than that by the Mo KX-ray.
An absorption profile of the two bones irradiated by
Mo KX-ray radiation is shown in Fig. 6. The absorption
profile reveals that the peak transmission is about 40% to 20%, well within the range of reasonable values for trans-mission mode diffractometry. The curves show higher bone density at the edges for the control specimens due to the cortical portion and higher density in the center for the op/op specimen, which is consistent with the micro-CT images of the developed trabeculae, as shown in Fig. 4.
3.3 Angular resolution and diffraction plane tilting
The disadvantage of Mo KX-ray radiation is the reduced
angular resolution of the reflections in the resultant data.
Figure 7 shows a typical Mo KX-ray diffraction pattern of
the representative bone specimen. The present work com-pares the ratio of the integrated intensities of the (002) and (310) reflections. Additionally, Fig. 7 displays the enlarged
diffraction pattern of the10220 region. This
indi-cates these reflections are well resolved with the Mo K
X-ray radiation due to the essentially low crystallinity of BAp in bones.
BAp crystallites orient preferentially along the longitudi-nal bone axis in long bones, and the geometry that optimizes
the (002) and (310) reflections requires around a 6and 9tilt
of the bone axis, respectively, for the Mo KX-ray radiation.
We collected a series of images from 5050 to
determine the relationship of the (002)/(310) ratio as a function of the tilt angle to the longitudinal bone axis. The
preferred orientation of thec-axis is to the longitudinal axis
of the bone, but the pole distribution is very broad around the longitudinal bone axis (data not shown). This suggests that tilting toward the bone axis under consideration of the Bragg angles is not necessary to get meaningful results. Thus, the deviation angle of the detected reflection plane, normal from the longitudinal bone axis, can be ignored even from the
(310) plane, which deviates within 9 due to the short
wavelength of the Mo KX-ray radiation.
(b) control
perpendicular
2 mm
(a) op/op
perpendicular
2 mm
(d) control
parallel
2 mm
(c) op/op
parallel
2 mm
[image:4.595.85.514.72.490.2](a) Cu K
α
(b) Mo K
α
Fig. 5 X-ray diffraction patterns from NIST apatite powder placed in 1.5 mm diameter glass capillary. X-ray power is 50 kV and 90 mA and exposure time is 10 min: (a) Cu KX-ray radiation, (b) Mo KX-ray radiation.
0 20 40 60 80 100
0
Lat.
Position / %
X-r
a
y tr
ansmissivity / %
control op/op
0 20 40 60 80 100
0
Ant.
Position / %
X-r
a
y
tr
ansmissivity / %
control op/op
(a) lateral to medial direction
(b) anterior to posterior direction
20 40 60 80 100 20 40 60 80 100
Post. Med.
[image:5.595.113.484.71.489.2] [image:5.595.85.510.578.758.2]3.4 Measurement of distribution of BAp orientation as a bone quality parameter
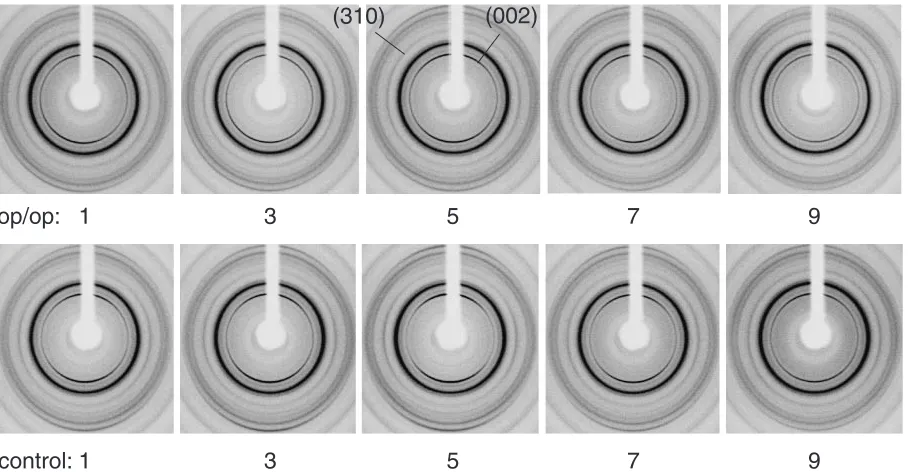
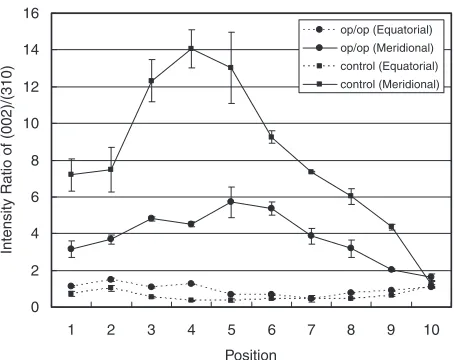
Finally, we measured a series of 10 diffraction patterns at equidistant points along the longitudinal axis of the two types of bone specimens. The measurement points are shown in Fig. 1. The diffraction images at points 1, 3, 5, 7, and 9 for both the op/op and control mice bones are shown in Fig. 8. Each diffraction pattern was analyzed as described earlier, and the resultant (002)/(310) ratios corresponding
to the preferential degree of the BAp c-axis are plotted as
a function of the bone position in Fig. 9 with standard
deviations. Crystallites with the BAp c-axis oriented
horizontally contribute to the equatorial sections of the
diffraction pattern, while crystallites with thec-axis oriented
vertically contribute to the meridional sections of the diffraction pattern. The meridional regions of the diffraction corresponding to the longitudinal bone axis show a strong
dependence to the distribution of the BAp c-axis within the
bone. In contrast, only weak dependence appears in the equatorial regions.
Both the control and op/op mice exhibit the same pattern as the maximum ratio of (002)/(310) in the close center of the femoral diaphysis. The op/op mouse shows, however,
much lower preferential alignment of the BApc-axis at all
0
5000
10000
15000
20000
25000
30000
0
Bragg angle, 2
θ
Intensity (arbitr
ar
y unit)
0 5000 10000 15000 20000 25000 30000
10
Bragg angle, 2θ
Intensity (arbitr
a
ry
unit)
(002)
(210) (211)
(300)
(202)
(310)
°
° 12° 14° 16° 18° 20°
°
10
°
15
°
20
°
25
°
30
°
35
°
40
°
45
°
5
Fig. 7 Typical X-ray diffraction pattern of bone specimen taken by Mo KX-ray radiation. Intensity in equatorial 100 pixels (10 mm) on equator (Fig. 3) accumulated and converted to2versus intensity data.
op/op: 1
1
control:
(310)
(002)
3
5
7
9
3
5
7
9
[image:6.595.85.509.73.307.2] [image:6.595.73.527.359.595.2]positions on the femoral position along the longitudinal axis than the control mouse. A similar tendency was previously demonstrated only at the center of the femur in the op/op
mouse,12,13)but continuous analysis of the BAp orientation
was not performed along the longitudinal bone axis because sectioning bone specimens was needed for BAp analy-sis.8,12,13)In contrast, the transmission optics system using
Mo KX-ray radiation with low X-ray absorption enabled
analysis of the BAp orientation in the mouse bone without sectioning. Thus, the optics system in this study provides a fuss-free method for analyzing BAp orientation as a bone quality parameter.
The different distribution of BAp orientation between the op/op and control mice, especially along the longitudinal bone axis, may be related to the contribution of osteoclast on the ossification process such as intermembranous and endochondoral ossifications. Detailed analysis is now in progress and will be reported in a separate paper.
4. Conclusion
We showed that Mo KX-ray radiation is a better choice
for data collection to determine the preferred orientation of
the BApc-axis in bone specimens due to reduced absorption.
We also showed that reduced angular resolution is incon-sequential because the (002) and (310) reflections are
adequately resolved with Mo K X-ray radiation. Finally,
there is a clear difference in the integrated ratio of (002)/ (310) depending on the quality of the bone being analyzed.
Our proposed method has several advantages. BApc-axis
distribution can be obtained along the longitudinal direction of the bone without sectioning it. This work enables easy
analysis of c-axis distribution with little specimen
prepara-tion. We proved the usefulness of this method using an
osteopetrotic (op/op) mouse. Through BAp c-axis
distribu-tion as a bone quality parameter in the near future, this method (Rigaku R-AXIS BQ system) can be used to under-stand the following: mechanism of bone growth, diagnoses of diseased bone, regenerated bone process, etc.
Acknowledgements
KS wishes to thank Yukinori Hara of the Rigaku Corporation for the measurements of the micro-CT data and Youji Moritani of Rigaku Corporation for help with the X-ray diffraction measurements. This study was supported by Priority Assistance for the Formation of Worldwide Renowned Centers of Research-The Global COE Program (Project: Center of Excellence for Advanced Structural and Functional Materials Design) and a Grant-in-Aid for Scientific Research and Development from the Ministry of Education, Culture, Sports, Science and Technology of Japan. This work was partly supported by the Industrial Technology Research Program (Project: 03A47002) in 2003 from the New Energy and Industrial Technology Development Organization (NEDO) of Japan.
REFERENCES
1) A. Shibata, K. Sasaki and T. Kinefuchi: Advances in X-ray Analysis35
(1992) 407–413.
2) K. Sasaki, Y. Hirose and T. Sasaki: Advances in X-ray Analysis37
(1994) 483–490.
3) W. J. Landis: Bone16(1995) 533–544. 4) A. Boskey: Osteoporos. Int.14(2003) S16–S21.
5) S. Weiner and H. D. Wagner: Annu. Rev. Mater. Sci. 28 (1998) 271–298.
6) R. Marcus, M. Wong, H. Heath III and J. L. Stock: Endocr. Rev.23
(2002) 16–37.
7) J. F. Veenland, T. M. Link, W. Konermann, N. Meier, J. L. Grashuis and E. S. Gelsema: Calcif. Tissue Int.61(1997) 474–479.
8) T. Nakano, Y. Kaibara, Y. Tabata, N. Nagata, S. Enomoto, E. Marukawa and Y. Umakoshi: Bone31(2002) 479–487.
9) T. Nakano, Y. Kaibara, Y. Tabata, N. Nagata, S. Enomoto, E. Marukawa and Y. Umakoshi: Tissue engineering for therapeutic use 6, (Analysis of hydroxyapatite (HAp) texture in regenerated hard tissues using micro-beam X-ray diffractmeter technique, Elsevier, Tokyo 2002) 95–104.
10) T. Nakano, T. Ishimoto, Y. Umakoshi and Y. Tabata: Mater. Sci. Forum595–543(2007) 675–680.
11) N. Sasaki, N. Matsushima, T. Ikawa, J. Yamamura and A. Fukuda: J. Biomech.22(1989) 157–164.
12) J.-W. Lee, T. Nakano, S. Toyosawa, N. Ijuhin, Y. Tabata, M. Yamamoto and Y. Umakoshi: Mater. Sci. Forum512(2006) 265–268. 13) J.-W. Lee, T. Nakano, S. Toyosawa, Y. Tabata and Y. Umakoshi:
Mater. Trans.48(2007) 337–342.
0 2 4 6 8 10 12 14 16
1
Position
Intensity Ratio of (002)/(310)
op/op (Equatorial)
op/op (Meridional)
control (Equatorial) control (Meridional)
2 3 4 5 6 7 8 9 10
[image:7.595.56.283.71.251.2]