Munich Personal RePEc Archive
Effect of smoking and other economic
variables on wages in the Euro Area.
Bondzie, Eric Amoo
Università Cattolica Milan
3 February 2016
Online at
https://mpra.ub.uni-muenchen.de/69230/
EFFECT OF SMOKING AND OTHER
ECONOMIC VARIABLES ON WAGES IN
THE EURO AREA
∗
Eric Amoo Bondzie
†February 3, 2016
Abstract
The smoking effects on wages has been examined in this work using different econometric methodologies with the use of European Community Household Panel (ECHP) datasets. We
employ econometric tools like Instrumental Variable technique, Heckman correction factor, Endogenous Switching and Matching estimates. The initial results from regression estimates (OLS and IV methods) revealed that the wage gap between smokers and non-smokers ranges
1% to 22.7%. Moreover, endogenous switching and matching estimator also showed a negative average treatment effect of approximately 47% and 4.3% to 6.9% respectively. Thus smokers
observed less wage effects is explained in part by real effects on their health status and a measure of unobserved preferences.
JEL codes: C18, I12, J31, O51
Keywords: Smoking, Wages differentials, Econometric Approaches and Euro Area.
∗The views expressed in this manuscript are those of the author. All errors are his.
†Department of Economics and Finance. Universit`a Cattolica del Sacro Cuore-Milan. Corresponding e-mail
Contents
1 Introduction 4
1.1 Background to the Study . . . 4
1.2 Motivation . . . 4
2 Literature Review 6 2.1 Theoretical Framework. . . 6
2.2 Empirical Review. . . 7
3 Data and Econometric Methodology 9 3.1 Data Analysis . . . 9
3.1.1 Descriptive Statistics . . . 9
3.2 OLS verses Instrumental Variable (IV) regression . . . 11
3.3 Heckman Model . . . 13
4 Analysis and Discussion of Results 13 4.1 OLS and Instrumental Variable Estimates . . . 13
4.2 Results from Heckman Estimation . . . 16
4.3 Endogeneous Switching and Matching Estimation . . . 16
5 Conclusion and Policy Recommendations 18
List of Figures
1 Health Expenditures (% GDP) in selected OECD countries. . . 52 Smoking Prevalence (% of population) in selected OECD countries.. . . . 6
3 Appendix A1: OLS Regression for MALE.. . . 21
4 Appendix A2: OLS Regression for FEMALE. . . 22
5 Appendix A3: Instrumental Variable Results (FULL). . . 23
6 Appendix A4: Heckman two-step Estimates. . . 24
List of Tables
1 Description of Variables . . . 101
Introduction
1.1
Background to the Study
A causal relationship between smoking and coronary heart disease was reported at Mayo Clinic in 1940 and the release of the 1964 Surgeon General’s report asserting that smoking causes cancer and other serious diseases both on smokers and on others who are exposed to cigarette smoke have received a considerable attention. Since that time several studies have been done to ascertain the various cost imposed by smokers on themselves and their surroundings.
Smoking has been shown to be the leading cause of lung cancer, chronic bronchitis, and emphy-sema, as well as a major cause of heart disease and stroke. It is associated with a variety of other conditions, including slowed healing from injuries and increased susceptibility to some infections (Napier 1996 and Blake et al 1988).
Individuals wage on the other hand is directly related to his or her marginal productivity, thus a low wage implies a lower marginal product of labour as compared to the marginal product for a worker with a higher wage. The marginal product of labour also relates to the level of education and how long the worker has been employed. The relationship was first introduced in Becker (1964) called the human capital model. Becker found that human capital has a positive effect on wages. Also related to the marginal product of labour are health issues such as smoking and Alcohol drinking. Grossman (1972) concluded that wages and health are positively related. And since smoking has a negative effect on an individuals health, it may be the case that smoking has a negative effect on wages.
1.2
Motivation
as health expenditures in Western industrialized countries, with only a few exceptions, have con-stantly increased in the last decades (Figure 1). The determinants for this development are of
Figure 1: Health Expenditures (% GDP) in selected OECD countries.
Source: OECD Health Data, 2014. The illustration is from Data drawn from OECD Health Data and was compiled by the author.
socio-economic and political interest; this paper will concentrate on the micro-level and focus on one particular aspect of individual health behaviour, smoking, and its relationship to wages and certain economic outcomes. The crucial point is that people decide on whether to smoke or not, although individuals have adequate knowledge about the adverse health effects that are attributed to smoking. Despite the widespread knowledge of smoking and its negative consequences on indi-viduals health, smoking is still a prevalent phenomenon in Western industrialized countries. While there is variation across countries, Figure 2 shows that the rate at which individuals smoke are still on the increase.
The aim of this paper is to analyse data over a long panel period to understand better the relationship between smoking and wages, economic outcome and to evaluate possible explana-tions.
Figure 2: Smoking Prevalence (% of population) in selected OECD countries.
Source: OECD Health Data, 2014. The illustration is from Data drawn from OECD Health Data and was compiled by the author.
2
Literature Review
2.1
Theoretical Framework.
In recent times both labour and health economist have examined the relationship between labour output and earnings vis-`a-vis their marginal product. Whiles labour economist relates earnings to marginal product of labour (MPL), health economists on the other hand link MPL to labours ability and health. A wide range of research for example Heijdra and Van der Ploeg (2002); and Burda and Wyplosz (2005) has found that the wage an individual receives is related to his/her marginal productivity, i.e. a low wage implies a lower marginal product compared to the marginal product for a worker with a higher wage and vice versa. As it is mostly argued in labour economics literatures, when marginal product of labour (MPL) is equal to the real wage (w), i.e. when MPL =w; firms are assumed to be maximizing their profit. The marginal product of labour is calculated as:
M P L∗P =W
M P L∗P
P =
Moreover, as indicated above MPL is also related to health (smoking and Alcohol drinking) and abilities of labour which means that wage is directly linked to these factors. That is for individuals that appear to be in a good health it is implied that they have a higher marginal productivity relative to individuals that do not seem to be in good health. As the aims of this paper suggest, attention will be focused on the relationship between wage and individuals health in this case smoking. This relationship has been studied under different theories like the human capital model and the theory of efficient wages. The human capital model was first introduced in Becker (1964), where he shows that human capital (education) has a positive effect on wages, i.e. the marginal product of labour is also related to the level of education and how long the worker has been employed. Hence, the marginal product increases with skills. The theory of efficient wages is based on the hypothesis that the net productivity of workers is a function of the wage rate they receive. The theory postulates that workers productivity depends on the level of nutrition, high labour turnovers (increased training cost for new workers), information asymmetry in the labour market (about the characteristics of workers) and whether workers feel being treated fairly equal with their peers (Stiglitz, 1986).
2.2
Empirical Review.
with smokers, causing some employers to discriminate against them. These effects might not be the same in the case of young workers since major health effects of smoking generally appear late in life, so one might be concerned that smoking would not have an impact on the current health and labour market outcomes. Several studies indeed show a negative effect of smoking on wages of young adult (Conway and Cronan 1992; Hoad and Clay 1992).
3
Data and Econometric Methodology
3.1
Data Analysis
The research uses the European Community Household Panel (ECHP) dataset; ECHP data is a harmonised cross-national longitudinal survey focusing on household income and living conditions. It encompasses items on health, education, housing, migration, demographics and employment characteristics. The survey is made up of 8 waves which run from 1994 to 2001. In the first wave (1994) a sample of some 60,500 households i.e. approximately 130,000 adults aged 16 years and above were interviewed across 12 member states (Belgium, Denmark, Germany, Greece, Spain, France, Italy, Ireland, Luxembourg, The Netherlands, Portugal, and the United-Kingdom). For most of the countries the surveys were carried out using the harmonised ECHP questionnaire. For some countries the institutes in charge of the production of the ECHP converted national data sur-veys into ECHP format to replace the ECHP from 1997 onwards. In these waves, information on life course smoking behaviour was reported, as well as for their marital status if they were married or not. In the health module of the survey, individuals were asked whether they currently smoked or have ever smoked. Current smokers were further asked about their average daily cigarette con-sumption and other smoking related products (pipes and cigar) that they smoke. The employment modules also gathered information on employees characteristics and earnings. These questions en-able us to construct smoking histories that include average daily cigarette consumption, duration of smoking and earnings.
3.1.1 Descriptive Statistics
were treated as dummies and their respective means and standard deviations are shown in table 1. The specific variables of interest included in this study is based on variables that is used frequently in previous studies and labour wage theories or is assumed to have specific effect on individuals wage and also due to the researchers own decisions and interest. For instance, age of an individual is assumed to have a positive effect on the wage, which means as individuals grow; they earn higher wages. Individuals level of education is also assumed to have a positive effect on wages, due to
Table 1: Description of Variables
Variables Description Mean Std. Dev. Min. Max.
Age Respondents’ Age. 38.01 11.14 15 65 Age Squared Age Squared 1568.88 879.86 225 4225
Gender 1 if Male. 0.45 0.50 0 1
Marital Status 1 if Currently married. 0.62 0.49 0 1 Education 1 if respondent works 0.14 0.34 0 1
in Education sector.
Hours worked Weekly hours worked. 38.30 9.39 2 96 Weight Weight without 70. 37 13.52 12 180
clothes and shoes.
Admitted to Hospital 1 if admitted to hospital 0.06 0.23 0 1 in the past 12 months.
Wage Gross monthly wage. 55200.7 103115.1 90.15 2500000 Hourly Wage Gross hourly wage. 371.28 708.67 0.69 12500 Log hourly wage Log hourly wage. 4.05 2.15 -0.51 9.43 Smoke 1 if Current smokes daily. 0.30 0.46 0 1
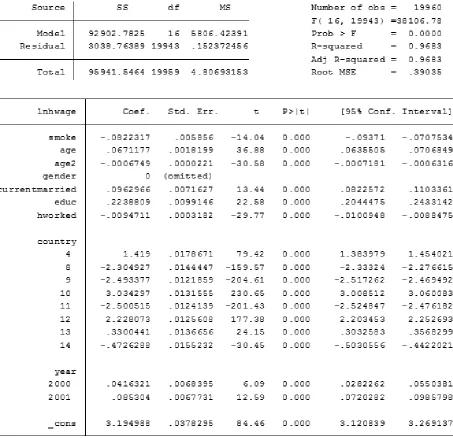
controlling for both country and yearly dummies, there was a negative and significant effect of almost 5%. However, performing Skewness/Kurtosis tests for Normality shows that the residuals are not normally distributed and it will be too early to make any conclusions without further investigations. Therefore additional health related variable were added as shown in equation 1 and 2.
3.2
OLS verses Instrumental Variable (IV) regression
We estimate a standard human capital earnings model made up of personal characteristics such as age, gender, marital status, highest level of general education completed; the baseline approach is very similar to the augmented human capital model of the effects of health status and health behaviour on labour market outcomes used by previous researchers. Hence baseline model can be construed as:
lnhW age=α+βX +γSmoke+ǫ (1)
where lnhW age is the log hourly wage, X is individual characteristics as mentioned above and
Smoke is a smoking behaviour dummy (1=current daily smokers and 0= non-smoker). As a matter of fact the Ordinary Least Square regression shows a negative relationship as shown in many literatures.
However even though smoking affect wages directly through consumers demand for the com-modity by expending their income on smoking related products, health also affect individuals wage through adverse effects of smoking but this relationship is somewhat not straightforward (Grafova and Stafford 2005). Therefore to account for the possibility that smoking affects wages through lower productivity due to poorer health, the baseline model is augmented by a self-reported health status indicators; how many times individual has been admitted to the hospital and the weight of the individuals without clothes and shoes1
. This additional variable is treated with the use of Instrumental Variables (IV) which is introduced in several papers. This procedure will alleviate the unmeasured, time invariant, individual-specific variables that could be correlated with both wages and smoking behaviour which lead to biased estimates2
.
In theory, the IV technique with a valid instrument solves all these problems. A valid instrument acts as a randomization device. In a randomized trial, we can think of a fair coin toss as deciding
1
It is a well-known fact that smoking affects individuals weight.
2
who is selected into treatment and who is not. In a valid IV analysis, the instrument assigns subjects to either treatment or no treatment using an assignment mechanism that is independent of the outcome. For example, the presence of unmeasured risk aversion in observational data represents a clear violation of random assignment. Persons in the treatment group (smokers) would likely be less risk averse than persons in the control group (non-smokers). A valid instrument must be theoretically related to the treatment variable but not, theoretically at least, be directly related to the outcome. Invalid instruments are those for which causality arrows might run from: (1) the treatment to the instrument; (2) from the outcome to the instrument; (3) from the instrument to the outcome; or (4) from other variables to the instrument, treatment, and outcome. A weak instrument is weakly statistically correlated with the treatment variable. Unfortunately, weak and invalid instruments frequently appear in the literature. For example, Berger used mothers educational attainment as an instrument for adult childs own educational attainment in assessing the correlation between education and health (Berger and Leigh 1989). But mothers educational attainment likely influences the childs health in early years, which certainly influences the adults health in later years. Thus, the instrument (mothers educational attainment) affects the outcome (health) for reasons other than the effects of the instrument on the treatment.
Angrist and Krueger (1991) illustrated how IV can be used to solve the omitted variable problem by using cross-sectional regression equation to measure the rate of return to schooling. By adopting the same procedure in dealing with the omitted variable problem our model can now be estimated to be as follows:
lnhW age=α+βX +γSmoke+δHlt+µ (2)
research is the weight and number of times the individual has been admitted to the hospital. The results are shown in the subsequent section.
3.3
Heckman Model
Heckman models are designed to deal with sample selection bias, but the same approach can be used to deal with non-random assignment to treatment as well. Selection bias can be thought of as a form of omitted variable bias. This bias results from using non-randomly selected samples to estimate behavioural relationships as an ordinary specification bias that arises because of a missing data problem. In contrast to the usual analysis of omitted variables or specification error in econometrics, in the analysis of sample selection bias it is sometimes possible to estimate the variables which when omitted from a regression analysis give rise to the specification error. The estimated values of the omitted variables can be used as regressors so that it is possible to estimate the behavioural functions of interest by simple methods (Heckman 1979). Following this and the possibility of encountering similar problems in our data, Heckman correction model is later followed to estimate our wage-smoking equation to deal with such error that may arise. This model can be estimated in two forms either by two-stage procedure or by MLE procedure. However, the latter requires making a strong assumption than those required for the two-stage procedure. Hence we use the former in our estimates which only requires that, the error terms (µi andǫi) are independent of
the explanatory variables with zero means and thatµi ∈(0,1) (Wooldridge 2002). This procedure
is the most commonly method used for estimating the Heckman model and the results are shown in the subsequent section.
4
Analysis and Discussion of Results
4.1
OLS and Instrumental Variable Estimates
This section presents the results from the baseline regression corresponding to equation 1 above; the effect of smoking on wage and other variables of interest like age, gender, marital status, working hours and those working in education sector. The results are presented in table 2 below3
. Since the wage of smokers cannot be justified by individuals smoking behaviour, other variables which may influence wage have been added to the previous regression to ascertain their effects on wage. The results in table 2 show that individuals who smoke earn 6.3% less than those who do not smoke at a highly statistically significant value without controlling for both country and year dummies. The absolute effect of smoking on wage here is augmented as compared to the previous regression. This might be due to the fact that smoking behaviours are also influenced by other
3
Table 2: OLS estimates of wage effects on smoking (Dep. Var = log hourly wage). Explanatory Variables OLS (1) OLS (2) OLS (Male) OLS (Female)
Age 0.0177*** 0.0642*** 0.0671*** 0.0648*** [0.0068] [0.0013] [0.0018] [0.0018] Age Squared -0.0002** -0.0007*** -0.0007*** -0.0007***
[0.00008] [0.00002] [0.00002] [0.00002] Marital Status 0.215*** 0.045*** 0.096*** -0.006
[0.025] [0.005] [0.007] [0.006] Education 0.451*** 0.306*** 0.224*** 0.352***
[0.032] [0.006] [0.010] [0.008] Hours Worked 0.015*** -0.008*** -0.010*** -0.008***
[0.001] [0.000] [0.000] [0.000] Smoke -0.063*** -0.046*** -0.082*** -0.010
[0.023] [0.004] [0.006] [0.007] Gender 0.014*** 0.199***
[0.022] [0.004]
Country Dummies No Yes Yes Yes
Year Dummies No Yes Yes Yes
R-Square 0.013 0.965 0.968 0.962
Note: The notation ***, **, and * denotes significance level at the 1%, 5% and 10% respectively and standard errors are presented in parenthesis.
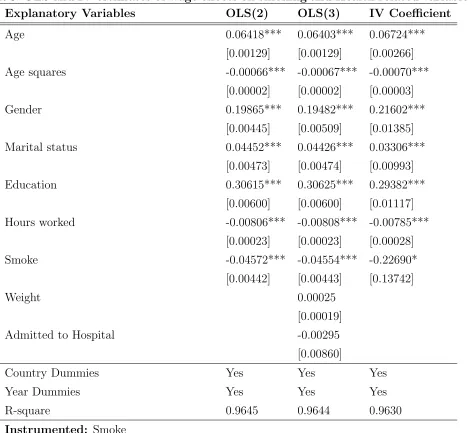
shown in equation 2. The results are shown in table 3. The results presented in table 3 indicate
Table 3: OLS and IV estimates of wage effects on smoking and Health related variables. Explanatory Variables OLS(2) OLS(3) IV Coefficient
Age 0.06418*** 0.06403*** 0.06724*** [0.00129] [0.00129] [0.00266] Age squares -0.00066*** -0.00067*** -0.00070***
[0.00002] [0.00002] [0.00003] Gender 0.19865*** 0.19482*** 0.21602***
[0.00445] [0.00509] [0.01385] Marital status 0.04452*** 0.04426*** 0.03306***
[0.00473] [0.00474] [0.00993] Education 0.30615*** 0.30625*** 0.29382***
[0.00600] [0.00600] [0.01117] Hours worked -0.00806*** -0.00808*** -0.00785***
[0.00023] [0.00023] [0.00028] Smoke -0.04572*** -0.04554*** -0.22690*
[0.00442] [0.00443] [0.13742]
Weight 0.00025
[0.00019] Admitted to Hospital -0.00295
[0.00860]
Country Dummies Yes Yes Yes
Year Dummies Yes Yes Yes
R-square 0.9645 0.9644 0.9630
Instrumented: Smoke
Instruments: Other variables including Country and Year Dummies.
Note: The notation ***, **, and * denotes significance level at the 1%, 5% and 10% respectively and standard errors are presented in parenthesis.
these problems would be alleviated. A comparative result with the previous OLS is presented in table 3. The full results of both first and second-stages are presented in appendix A3.
The results from instrumental variable estimate show that smoking affects wages negatively and also with a higher magnitude of approximately 23% at 10 percent significant level. This is probably due to the fact that the 2SLS uses the full information available to compute the fitted values of the instrumented variable (smoke) while in the previous cases we used only the information given by smoke that may suffered from endogeneity problem. Moreover, the 2SLS uses a richer set of regressors to capture information about smoking and, therefore, it allows us explain and overcome better the endogeneity problem. Both Sargan and Basmann test for over-identifying restrictions provided a very high p-value (0.814) which indicates strong instruments. The results from first-stage regressions also revealed statistically significant instrumental variables. The joint statistical distribution for the instrumented variables also shows that they are statistically significant.
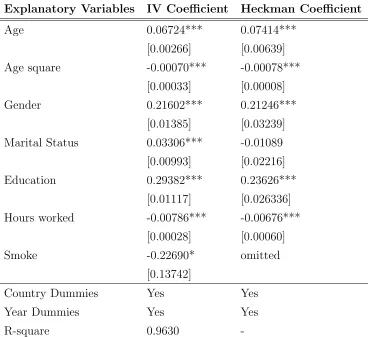
4.2
Results from Heckman Estimation
As a results of self-selection by the individuals or data units being investigated and also non-randomly selected data, the following section presents the results obtained from Heckman cor-rection estimates. The Heckman coefficient presented below4
represent the Heckman first-stage estimates which gives similar results like the IV estimates except marital status which changes sign. Following the full results from appendix A4, the second-stage shows that all the instruments used (number of times individuals are admitted to the hospital and weight) are statistically sig-nificant which cement our results from the other estimates. Though Achen (1986) warn about including too many instruments; Experimental data derived from nonrandomized assignments, controlling for additional variables in a regression may worsen the estimate of the treatment effect, even when the additional variables improve the specification which in our case all seem to be good instruments.
4.3
Endogeneous Switching and Matching Estimation
Following the results and statistical test from our IV estimates and Heckman correction, we try to adopt endogenous switching and matching estimation procedure to generate the effect of the treatment variable (smoking) to analyse the real effect on non-smokers. The results are presented in table 5. The results from endogenous switching estimate ala Heckman correction procedure, revealed an Average Treatment Effect and Average Treatment on the Treated of 47.4% and 46.8% respectively; showing that smoking characteristics have a negative and a significant relationship on individuals wage. Matching estimator seen in few literatures also provides similar negative effects
4
Table 4: Heckman Estimation results
Explanatory Variables IV Coefficient Heckman Coefficient
Age 0.06724*** 0.07414*** [0.00266] [0.00639] Age square -0.00070*** -0.00078***
[0.00033] [0.00008] Gender 0.21602*** 0.21246***
[0.01385] [0.03239] Marital Status 0.03306*** -0.01089
[0.00993] [0.02216] Education 0.29382*** 0.23626***
[0.01117] [0.026336] Hours worked -0.00786*** -0.00676***
[0.00028] [0.00060] Smoke -0.22690* omitted
[0.13742]
Country Dummies Yes Yes
Year Dummies Yes Yes
R-square 0.9630
-Note: The notation ***, **, and * denotes significance at the 1 percent, 5 percent and 10 percent respectively and Standard errors are presented in parenthesis.
Table 5: Endogenous Switching and Matching estimator results
Endogenous Switching estimates Matching estimates
ATE -0.4738188
-[0.054592]
ATT -0.4675544
-[0.0543333]
ATT (Nearest Neighbour) - -0.0688285
[0.396789] Bias= 0.0048384
ATT (Kernel) - -0.433207
[0.0225088] Bias= -0.00437
Standard errors are presented in parenthesis
5
Conclusion and Policy Recommendations
So far the paper has investigated the effect of smoking on wages in some selected European countries and other economic variables of interest. The econometric methods used in this work include instrumental variable technique, Heckman correction factor, Endogenous switching and matching estimator. All these methodologies concluded with a negative relation but with different magnitude which is in line with previous research. It was revealed that the wage gap between smokers and non-smokers ranges between 1% and 22.7%. Both endogenous switching and matching estimator also revealed a negative average treatment effect of 47% and 4.3% to 6.9% respectively. These results were actually expected as most literature suggests similar effects. The empirical results that hours worked is negatively related to wage was unexpected. Intuitively, we assume that as individuals work more hours, they are supposed to earn more wages and thereby have a positive relationship with wages but this data suggest the opposite.
References
1. Achen, Christopher H. (1986). The Statistical Analysis of Quasi-Experiments. Berkeley, CA: University of California Press.
2. Adhikari, B., Kahende, J., Malarcher, A., Pechacek, T., and Tong, V. (2008). Smoking-Attributable Mortality, Years of Potential Life Lost, and Productivity LossesUnited States, 2000-2004. Morbidity and Mortality Weekly Report; 57(45); pp 1226-1228.
3. Anger, S., and Kvasnicka, M., (2010). Does Smoking Really Harm Your Earnings So Much? Biases in Current Estimate of the Smoking Wage Penalty. Applied Economic Letters
17(6); pp 561-564.
4. Angrist, J. D., and Kruger, A.B. (1991). Does Compulsory school attendance affects schooling and earnings? Quarterly Journal of Economics, November 106:4, pp. 979-1014.
5. Angrist, J.D and Pischke, J. S. (2009). Mostly Harmless Econometrics: An Empiricists Companion, Princeton University press, Princeton, NJ.
6. Auld, M.C. (1998). Wage, Alcohol Use, And Smoking: Simultaneous estimates. Discussion Paper, No. 98/08, Department Of Economics, University Of Calgary.
7. Becker, G. (1964). Human Capital: A theoretical and empirical analysis with special refer-ence to education, National Bureau of Economic Research, No. 80.
8. Berger M.C. and Leigh J.P. (1989). Schooling, self-selection and health. Journal of Human Resource 24, pp 433455.
9. Bertera, R. L. (1991). The Effects of Behavioral Risks on Absenteeism and Health-Care Costs in the Workplace. Journal of Occupational Medicine, Vol. 33, No. 11, pp. 1119-23.
10. Blake, G. H., Abell T. D, and Stanley W. G. (1988). Cigarette Smoking and Upper Respiratory Infection among Recruits in Basic Combat Training. Annals of Internal Medicine, Vol. 109, No. 3, pp. 198-202.
11. Braakman, Nils (2008). The Smoking Wage Penalty In the United Kingdom: Regression And Matching Evidence from the British Household Panel Survey. University Of Luneburg Work-ing Paper Series in Economics. No 96.
12. Burda, M. and Wyplosz, C. (2005). Macroeconomics: A European Text, Oxford Univer-sity Press Inc., New York.
13. Conway, T. L., and T. A. Cronan. (1992). Smoking, Exercise, and Physical Fitness.
Preventive Medicine Vol. 21, No. 6 (November), pp. 723-734.
14. Frieze, I. H., Olson, J. E., and Jane Russell. (1991). Attractiveness and Income for Men and Women in Management. Journal of Applied Social Psychology,Vol. 21, No. 13, pp. 1039-1057.
Occasional Papers No. 119. New York: Columbia University Press (for NBER).
16. Grossman, M. (1972). On the concept of human capital and the demand for health,Journal of Political Economy 80: pp 223-255.
17. Heckman, James. (1979). Sample Selection Bias as a Specification Error. Econometrica
47: pp 153-161.
18. Heijdra, B. J. and Van der Ploeg, F. (2002). Foundations of modern macroeconomics, Oxford University Press Inc., New York.
19. Heineck, G. and Schwarze, J. (2003). Substance use and earnings: the case of smokers in Germany, Discussion paper, IZA DP No.743.
20. Hoad, N. A., and D. N. Clay. (1992). Smokinig Impairs the Response to a Physical Training Regime: A Study of Officer Cadets. Journal of the Royal Army Medical Corps, Vol. 238, No. 3 (October), pp. 115- 117.
21. Kristein, M. M. (1983). How Much Can Business Expect to Profit from Smoking Cessa-tion? Preventive Medicine, Vol. 12, No. 2, pp. 358-381.
22. Lee, Y. (1999). Wage Effects Of drinking and smoking: an analysis using Australian Twins Data. University Of Western Australia Working Paper, pp 99-122.
23. Leigha J.P., and Schembri, M. (2004). Instrumental variables technique: cigarette price provided better estimate of effects of smoking on SF-12; Journal of Clinical Epidemiology 57, pp 284-293.
24. Levine, P. B., Gustafson, T. A., and Velenchik, A. D. (1997). More Bad News for Smokers? The Effect of Cigarette Smoking on Wages. Industrial and Labor Relations Review, Vol. 50, No. 3, pp. 493-509.
25. Martel, L. F., and Biller, H. B. (1987). Stature and Stigma: The Biopsychosocial De-velopment of Short Males. Lexington, Mass Lexington Books.
26. Napier, K. (1996). Cigarettes: What the Warning Label Doesnt Tell You. The First Comprehensive Guide to the Health Consequences of Smoking. New York: American Council on Science and Health.(with editing by William M. London, Elizabeth M. Whelan, and Andrea Golaine Case)
27. Stiglitz, J. E. (1986). Theories of wage rigidity. In Butkiewicz, J. L., Koford, K. J., and Miller, J. B. editors, Keynes Economic Legacy: Contemporary Economic Theories, Praeger, New York.
28. van Ours, J. C. (2004). A pint a day raises a mans pay; but smoking blows that gain away.
Journal of Health Economics, 23, pp 863-886.