Topographical Mapping of Surface and Interface Profiles
by Using Acoustic Interferometry
Hiroshi Kato
1, Satoru Ohmura
1;*, Satoru Toyooka
2, Yoshiaki Kawada
1and Kensuke Kageyama
1 1Department of Mechanical Engineering, Faculty of Engineering, Saitama University, Saitama 338-8570, Japan 2Department of Environmental Science and Human Engineering, Graduate School of Science and Engineering,
Saitama University, Saitama 338-8570, Japan
The model is presented to explain formation of interference fringes appearing in acoustic images obtained by the acoustic microscopy. In the model, the residual vibration in the vibrator is overlapped by the vibration due to the ultrasonic wave reflected from the surface of the solid. The model was confirmed by the periodical change in the output of the vibrator with the water path. Then acoustic images of an inclined glass plate were observed to examine the influence of the inclination angle, the focal position and the wave frequency on the fringe spacing. A height difference corresponding to the fringe spacing was about a half wavelength of the ultrasonic wave in water. The interference fringes were also observed with a specimen with a deep notch under bending test and showed a good agreement with moire´ fringes. The presented model suggests that the interference fringes are also formed corresponding to profiles of a reverse surface and a boundary between dissimilar substances. This was confirmed by acoustic images of copper plates with a tapered edge and a shallow groove on the reverse surface, and also those of a copper plate with a dint on the reverse surface, covered by tin alloy solder. [doi:10.2320/matertrans.47.1572]
(Received January 12, 2006; Accepted April 17, 2006; Published June 15, 2006)
Keywords: ultrasonic microscopy, acoustic interferometry, topographical mapping, surface profile, interface profile
1. Introduction
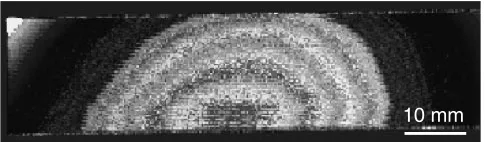
In acoustic images obtained by a scanning acoustic microscope, fringe noises often appear due to interference of ultrasonic waves. Figure 1 shows a typical fringe pattern observed in the acoustic image of a copper plate.
In the acoustic microscopy, the V(z) curve is a typical of the wave interference,1) and a wave reflected from a
specimen surface interferes with a leaky surface wave (LSAW) to make a cyclic change in the output of the transducer with a water path z (a distance between the transducer and the specimen surface). The interference of the ultrasonic wave also occurs when a surface or near-surface crack occurs.2)In this case, interference fringes appear due to
superposition of the surface wave reflected from the crack and the wave transmitted through the crack. The wave interference also occurs by using an artificial reference wave and other sources to generate the reference wave. Chubachi et al.3)introduced an electrically variable phase shifter in the line of reference signal circuit of the mechanically scanned acoustic interference microscope (SAIM) and applied to image topographical profiles on the solid surfaces, and Ebihara et al.4) applied this system to obtain topographical
profiles of the surface and the internal defects. Kawamura et al.5,6) visualized the interference fringes along the fiber
embedded in the resin matrix by using the interference of the ultrasonic waves reflected from the surface of the matrix and the fibers. In these cases, the electrically variable phase shifter and the solid surface played the role of the generator of the reference wave. In the case of interference fringes in Fig. 1, however, there was no source to generate the reference wave, but other sources should be found to explain formation of the interference fringe.
In the present work, a model is presented to explain formation of the interference fringe in the acoustic image.
The model was confirmed by the experiment with a glass plate, an aluminum rod and copper plates. The present model also suggests formation of the interference fringe corre-sponding to profiles of a reverse surface and a boundary between dissimilar substances under suitable measurement conditions. To testify this, acoustic images were observed with copper plates with a tapered edge and a shallow groove on the reverse surface, and with the copper plate with a dint covered by tin alloy solder.
2. Interference Model
In the acoustic microscopy, the ultrasonic wave generated by the vibrator travels in water, and then irradiates a solid surface. A part of the incident wave is reflected from the solid surface, and the other penetrates it. In the solid, the ultrasonic wave travels to the reverse surface. Finally, waves reflected from the obverse and the reverse surfaces go back to the detector. This process is schematically shown in Fig. 2 together with an output signal of the detector (in this case, the vibrator also plays the role of the detector). In the figure, small vibration is observed ahead of the wave reflected from the obverse surface of the solid (the surface echo, S in the figure). This signal is thought to be a vibration remaining in the vibrator after agitation by electric pulse. In this situation, it was assumed that in the vibrator, the residual vibrationar
was overlapped by the vibrationasdue to the surface echo.
These two waves are written by
10 mm
Fig. 1 Typical acoustic image of copper plate.
*Undergraduate Student, Saitama University
[image:1.595.306.549.341.412.2]ar¼ar0expð2iftÞ; ð1Þ
as¼as0exp½2ifðt2tsÞ; ð2Þ
where ar0 and as0 are the absolute amplitudes, f is the
frequency of the ultrasonic wave and t is the elapsed time after generation in the vibrator. The timets(¼zs=Cw) is the
time delay while the ultrasonic wave travels from the vibrator surface to the solid surface (the water pathzsshown in Fig. 2)
with the velocityCw in water. These two waves (ar andas)
are superposed on the vibrator, and the resultant intensityIis given by
I¼ jarþasj2¼a2r0þa
2
s0þ2ar0as0cosð4ftsÞ
¼I0 1þcos 4 w
zs
; ð3Þ
wherewis the wavelength of the ultrasonic wave (¼Cw=f),
I0is the average intensity andis the modulation amplitude. The intensityIsinusoidally changes depending on the water path zs, and a height difference z for one cycle of the
intensity variation (hereafter referred to as the height difference) is given by a half of the wavelength of the ultrasonic wave in water (w=2). For example,z15mm
for the ultrasonic wave of 50 MHz in frequency.
To confirm this model, the intensity change of the ultrasonic wave with the water path was examined with a glass plate. The wave intensity was measured at a focal position of the ultrasonic wave by using a scanning acoustic microscope (SAM) with a probe generating a longitudinal wave of 50 MHz in frequency and of a focal distance of 12 mm in water. Figure 3 shows a sinusoidal change of the wave intensity with a focal and measurement positiondf of
the ultrasonic wave below the specimen surface. The height differencezwas about 14mmand was in good agreement with the predicted value.
3. Relation between Fringes and Surface Profile
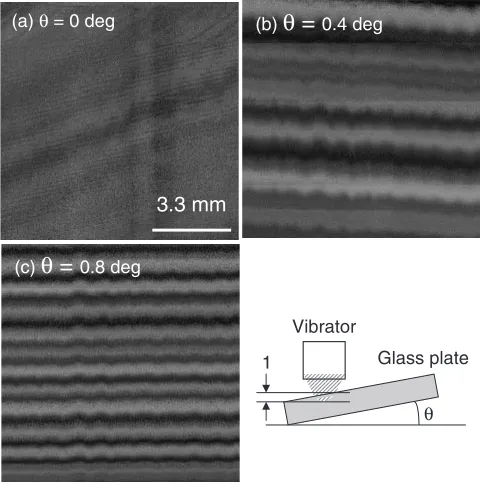
3.1 Measurement with inclined glass plate
Interference fringes were observed in the acoustic image of the inclined glass plate to examine influences of the inclination angle of the glass plate and the focal position of the ultrasonic wave on a fringe spacing. Acoustic images were obtained by using the prove generating a wave of
50 MHz in frequency. The acoustic image was also obtained by using probes of 20 MHz in frequency to examine the influence of the wave frequency.
Figure 4 shows interference fringes appearing in the acoustic image at different inclination angles of the glass plate. Acoustic images were obtained at a focal position 1 mm below the plate surface. With increasing inclination angle of the glass plate, the fringe spacing was decreased from 1.9 mm in the case of 0.4 deg to 1.0 mm in the case of 0.8 deg, but a height difference corresponding to the fringe spacing was about 14mm, and was in good agreement with the predictionz15mm. In Fig. 5, interference fringes are shown at different focal and observation positions of the ultrasonic wave. There was no change in the fringe spacing, but difference in the contrast of the fringe. Acoustic images were obtained with a vibrator of 20 MHz in frequency, and the fringe spacing was about 2 times of that at the frequency of 50 MHz.
S
B
Focal position Residual vibration
in vibrator
Surface
Bottom
time
ts tf tB
zs
df
Vibrator (Detector)
Fig. 2 Schematic diagram of wave propagation in solid, and time depend-ent signal obtained by a detector.
1
1.05
1.1
0
50
100
150
Intensity (Relative)
Distance below surface,
d
f/mm
∆zFig. 3 Change in output of detector with distance df below specimen
surface.
(a)θ= 0 deg
3.3 mm
(b)
θ
=
0.4 deg(c)
θ
=
0.8 degθ Glass plate Vibrator
1
[image:2.595.318.535.73.228.2] [image:2.595.57.283.73.224.2] [image:2.595.306.546.281.524.2]3.2 Measurement under bending test
To examine a topographical mapping of the interference fringe corresponding to the surface profile, acoustic images of a specimen under bending test were observed. From a pure aluminium rod of 10mm10mm in section, specimens were fabricated for three-point bending test. At a center of the specimens, a notch of different radii and 5 mm in length was introduced. The specimen was bent to a required deflection to open the notch, and then subjected to observation of the acoustic image with a probe generating a longitudinal wave
of 50 MHz in frequency. In the analysis, the ultrasonic wave was focused and observed at a focal position 1 mm below the surface.
The acoustic images were also obtained with specimens removed from the bending device to compare with moire´ fringes. Moire´ interferometric fringes were obtained with a white light diode as a light source and a Ronchi grating plate of 20 lp/mm. In the measurement, the light source and the camera were separated by 135 mm and placed at a height of 135 mm above the specimen surface to obtain moire´ fringes of 50mmin height difference/fringe.
Figure 6 shows typical acoustic images at a notch root of 2.5 mm in radius under different deflections of the specimen. The interference fringes appeared corresponding to a dent near by the root of notch expanded with increased load. The specimen was removed from the bending device, and then subjected to the SAM observation and the moire´ fringe analysis. In Fig. 7, the interference fringes are in good agreement with the moire´ fringes to confirm that the acoustic fringe is formed corresponding to the topographical profile of the specimen surface.
4. Formation of Interference Fringes corresponding to Reverse Surface Profile
The present model also gives a situation that a vibration due to the ultrasonic wave ab reflected from the reverse
surface of the object overlaps on the vibrationsar andas in
the vibrator when the acoustic image is obtained at a depth of the reverse surface. The waveabis written by
3.3 mm
(a)δ= 1.75 mm below surface
(b)δ= 2.0 mm below surface
(c)δ= 2.25 mm below surface
0.4 deg Glass plate Vibrator
δ
Fig. 5 Fringe patterns obtained at different focal and observation positions .¼0:4deg.
(a) h= 0 mm (b) h= 0.7 mm
(c) h= 1.4 mm
3.3 mm
Fig. 6 Change in acoustic images at notch root of aluminum rod with deflection of rodh. Radius of notch root: 2.5 mm.
r= 2.5 mm
r= 3.5 mm
r = 5 mm
Moiré fringes Acoustic images
[image:3.595.48.289.69.311.2] [image:3.595.308.547.72.367.2] [image:3.595.49.290.369.607.2]ab¼ab0exp½2fiðt2tbÞ; ð4Þ
wheretb is the time delay while the ultrasonic wave travels
from the vibrator to the reverse surface of the solid. Considering the contribution of the wave ab, the intensity
of the vibrator is given by
I¼ jarþasþabj2;
¼a2r0þa2s0þa2b0þ2ar0as0cosð4ftsÞ
þ2ar0ab0cosð4ftbÞ þ2as0ab0cos½4fðtstbÞ;
¼I0
1þ1cos
4 m
zs
þ2cos 4 zs
w
þzbzs
m
þ3cos
4 m
ðzszbÞ
; ð5Þ
wherezsandzb are the water path and the distance between
the vibrator surface and the reverse surface, respectively, and m is the wavelength of the ultrasonic wave in the solid. In
this case, three terms of the wave interference appear, and their modulation amplitudes are written by1,2and3. The first and the second terms are made by the superposition of the reference wave and the waves reflected from the obverse and reverse surfaces of the solid, respectively. The third term is made by the superposition of the waves reflected from the obverse and reverse surfaces. Under the condition that the ultrasonic wave is irradiated on the obverse surface at a right angle, the water pathzsis treated as a constant and only the
distancezbchanges with the position of the reverse surface,
and the second and the third terms in eq. (5) show a periodical change with a height differencezb(¼m=2). To
confirm this, acoustic images were obtained with thin copper plates having a tapered edge or a groove on the reverse surface.
4.1 Experimental procedure
Rectangular copper plates of 2 mm in thickness, 10 mm in width and 100 mm in length were prepared. An edge of the plate was tapered off to reduce a thickness by about 0.5 mm with an emery paper of #1500, and a thin shallow groove of about 0.5 mm in depth was introduced in the other plate. Then, acoustic images of the tapered edge and the groove on the reverse surface were obtained by irradiating the ultrasonic wave on the obverse surface of the plate. In the measurement, the ultrasonic wave of 50 MHz in frequency was focused at different positions below the surface, and the acoustic images were obtained at a position of the reverse surface. For comparison, moire´ fringes were also obtained on the reverse surface with the same setup shown in the preceding section.
4.2 Results and discussion
In Fig. 8, the acoustic fringes (left) are compared with the moire´ fringes (right). The moire´ fringes were obtained on the reverse surface and then turned the right side left to obtain the same arrangement as the acoustic images. As shown in the figures, the profile of the interference fringe is in good agreement with that of the moire´ fringe.
From these results, it was confirmed that acoustic fringes are formed as contour lines corresponding to the reverse surface profile.
5. Formation of Interference Fringes corresponding to Profiles of Interface between Different Substances
In derivation of eq. (5), a substance behind the reverse surface was not considered. Even when the solid is contacted with the other solid to form a boundary between the solids, eq. (5) should be still valid and applicable. To confirm this, acoustic images were obtained with a copper plate with a dint covered by a tin alloy solder.
5.1 Experimental procedure
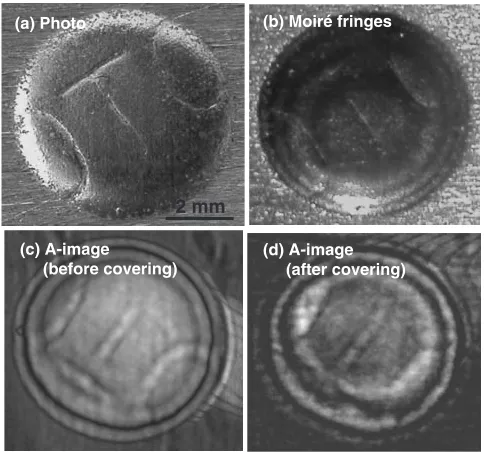
On a reverse surface of a copper plate of 2 mm in thickness, a semi-spherical dint of about 0.5 mm in depth was introduced by pressing a spherical steel ball of 10 mm in diameter with a hydrolic press. Acoustic images of the dint were obtained by irradiating the ultrasonic wave on the obverse surface under the same conditions as mentioned in the preceding section. Moire´ fringes were also obtained at the dint with the same setup as mentioned in the preceding section. Then the dint was covered by the tin alloy solder, and acoustic images of the dint were obtained by irradiating the ultrasonic wave on the obverse surface of the plate.
5.2 Results and discussion
Figures 9(a) and (b) show a profile of the dint observed through optical microscope and the moire´ fringes at the dint, respectively. In Figs. 9(c) and (d), acoustic images of the dint before and after covering with the solder are shown, respectively. Since the acoustic images of the dint introduced on the reverse surface of the plate were taken from the obverse surface, a mark in the dint faces an opposite direction to that in the photograph. It was confirmed that interference fringe in the dint covered with the solder take the same spacing as that before covering and also as the moire´ fringe,
Acoustic image Moiré fringes (a) Tapered edge
(b) Groove
[image:4.595.307.546.74.328.2]as was expected from eq. (5). The interference fringe at the covered dint is slightly unclear compared to that before covering due to difference in the reflectivity at the interface, which is related to the acoustic impedance of substances ahead of and behind the interface.
6. Conclusion
To explain appearance of the interference fringes in the acoustic image, the interference model was presented in consideration of superposition of the vibration of the wave reflected from the surface of the object on the residual vibration in the vibrator. The model was confirmed by measuring the change in the output of the vibrator with the water path. Then the acoustic images were obtained with the inclined glass plate, and the height difference corresponding
to the fringe spacing of the interference fringes was in good agreement with a half of the wavelength of the ultrasonic wave in water as was expected from the theory. Acoustic images were also observed with specimens with the deep notch under bending test, and the fringe patters were in good agreement with the moire´ fringes.
The model also suggested the formation of the interference fringe corresponding to the reverse surface and the interface profiles, and it was confirmed by observing acoustic images of copper plates with a slightly tapered edge or a shallow groove, and of the copper plate with a dint covered by the tin alloy solder. In these observations, the interference fringe obtained from the obverse surface was in good agreement with the moire´ fringe obtained on the reverse surface.
From these results, it was found that the interference fringe appears corresponding to profiles of not only the obverse surface of the solid, but also the reverse surface and the interface between different substances.
Acknowledgements
The authors would like to thank Prof. K. Horio, Saitama University, for supply of the glass plate and Prof. Y. Arai, Saitama University, for instruction for operation of the acoustic microscope. The acoustic microscopy was carried out in Molecular Analysis and Life Science Center (pre-viously, the Chemical Analysis Center), Saitama University.
REFERENCES
1) K. Yamanaka and Y. Enomoto: J. Appl. Phys.53(1982) 846–850. 2) J. Kushibiki and N. Chubachi: IEEE Trans. Sonics & UltrasonicsSU-32
(1985) 189–212.
3) N. Chubachi and T. Sannomiya: Proc. IEEE, Ultrasonic Symposium, (IEEE, 1984) pp. 604–609.
4) M. Ehara, S. Asano, H. Ojima, M. Obata and N. Chubachi: J. JSNDI38 (1989) 400–407 (in Japanese).
5) M. Kawamura, S. Morita, M. Tanaka and T. Tachibana: Seikei-Kakou9 (1997) 913–199 (in Japanese).
6) M. Kawamura, S. Ikeda, S. Morita and Y. Sanomura: Seikei-Kakou13 (2001) 317–322 (in Japanese).
(a) Photo
(c) A-image
(before covering)
(b) Moiré fringes
2 mm
(d) A-image (after covering)
[image:5.595.48.290.72.298.2]