Electrochemical Characteristics of LiMn
2O
4(Li/Ni) Cathode Materials
Fei-Yi Hung
*, Truan-Sheng Lui
*, Li-Hui Chen and Hung-Chi Liao
Department of Materials Science and Engineering, National Cheng Kung University, Tainan, Taiwan 701, R.O. China
The present study used the Pechini process with a continuous furnace to synthesize LiMn2O4powders. After heat treatment, the particle
size and lattice constant of the LiMn2O4powder increased. For heat treatment cathode powders (LMO800), due to both the average valence of
Mn cations approaching the theoretical value and the higher crystalinity, the discharge capacities are raised significantly. The charge and
discharge cycling capacity of LMO800 powder was best at 25C. Under the charge-discharge cycling test at 55C, some Mn ions dissolved
easily into the electrolyte resulting in a significant decrease in the charge and discharge capacity with increasing the cycling number. The surface modification powder (LMO-Ni) contains a surface oxidative film of lithium-nickel-manganese that not only restrains Mn ions dissolved into the
electrolyte, but also improves the charge and discharge capacity at 55C. [doi:10.2320/matertrans.47.2759]
(Received May 11, 2006; Accepted September 14, 2006; Published November 15, 2006)
Keywords: LiMn2O4, discharge capacity, Pechini process, surface modification
1. Introduction
Comparing LiCoO2and LiNiO2with LiMn2O4, the latter
possesses the characteristics of a spinel cubic structure and stable oxidation potential.1,2) In addition, the toxicity and cost of LiMn2O4 is lower than other transition metal oxide
systems, however its capacity is lower.3) Considering environmental concerns, its low cost and the safety coef-ficient of overwork in electrical charges, LiMn2O4 cathode
material is worthy of further investigation. Much research has been focusing on the application of several lithium manga-nese oxides in lithium ion batteries,4,5) however, LiMn2O4
synthesized using the Pechini process with heat treatment and the surface modification has not yet been examined. This study uses the Pechini process6,7) and heat treatment to produce LiMn2O4 powder. In addition to investigating
effects of carbon black content, heat treatment and the surface modification of lithium-nickel ions on the discharge capacities, the charge-discharge cycling characteristics at 25 and 55C were also examined.
2. Experimental Procedure
2.1 LiMn2O4 powder synthesis
We used the Pechini process to synthesize LiMn2O4
powder.6,7)Manganese nitrate, lithium carbonate, citric acid and glycol were mixed to form an organic acid lithium-manganese glycol solution. Meanwhile, the pH value of the solution was controlled at7{8using ammonia water addition. After that, the LiMn2O4 powder (hereafter referred to as
LMO600) was synthesized from the syntactic solution using a continuous furnace (with temperature held at 200{600C for 4 hours).
Next, some of this LMO600 powder was put into an oxidizing furnace to perform heat treatment. The temperature was raised by at 5C per minute until it reached 800C, then held at this temperature for 12 hours, followed by furnace cooling to room temperature. This heat treatment LiMn2O4
powder is designated as LMO800. Additionally, to
under-stand the influence of carbon black content on the capacity, LMO800 powders with various content of carbon black were also given charge-discharge testing.
For doping the lithium ions and nickel ions on the surface of LiMn2O4 powders, the LMO800 powders were mixed
with an organic acid lithium-nickel glycol solution to produce the surface modification powders. After that, the surface modification powders were held at 800C for 6 hours, followed by furnace cooling to room temperature (hereafter referred to as LMO-Ni, that contain a surface oxidative film of lithium-nickel-manganese).
2.2 Characteristic analysis and charge-discharge testing X-ray diffraction was used for structural analysis. The scanning angle was varied from 10 to 70 and the scanning velocity was 2min1. Furthermore, the appearance of the
powders was examined by SEM observation. The exact composition of the powders was identified using ICP (inductively coupled plasma). The electrovalence of Mn was measured by titration. Meanwhile, XPS (X-ray Photo-electron Spectroscopy) was used to obtain Mn binding energy data.
In addition, the active powders, carbon black and binder (PVDF) were first mixed and then an appropriate amount of N-methyl-2-pyrrolidone (NMP) was added to form a paste. After scraping-form and vacuum heat treatment at 130C, a round electrode of 13 mm in diameter was obtained. The electrical current of charge-discharge testing was fixed at 74 mAh/g (the theoretical capacity of LiMn2O4 is 148
mAh/g). The voltage was limited to the range of 3.0 and 4.3 V. The electrolyte was a mixture of LiPF6, EC and DEC
(EC:DEC¼1 : 1 vol.). Each analysis datum was the average of3{4test results.
3. Results and Discussion
3.1 Properties of LiMn2O4 powders
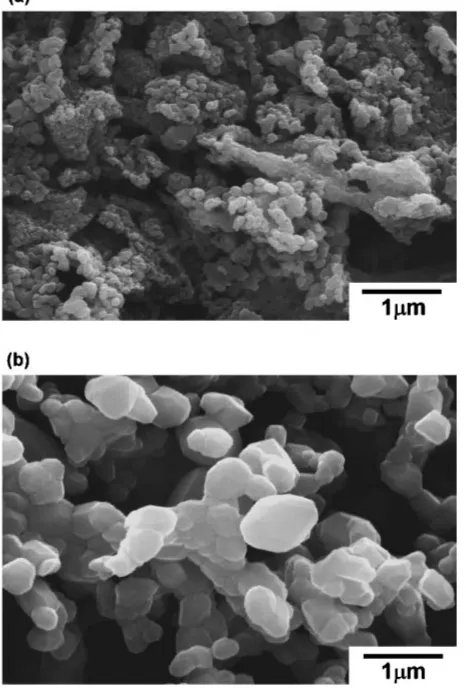
Figure 1 shows the appearances of the LiMn2O4 cathode
powders. LiMn2O4powder (LMO600) is shown in Fig. 1(a)
and its particle size is in the range of10{100nm. After 800C oxidizing for 12 hours, the heat treatment powders (LMO800) grew in size significantly (Fig. 1(b)). The particle
*Corresponding author, E-mail: fyhung@mail.mse.ncku.edu.tw,
z7408020@email.ncku.edu.tw
Materials Transactions, Vol. 47, No. 11 (2006) pp. 2759 to 2764
size of LMO800 was about0:1{1mmand was a polyhedron. X-ray diffraction patterns of LMO600 powder and LMO800 powders are shown in Fig. 2, revealing both had spinel cubic structures. Notably, comparing the LMO800 powder with the LMO600 powder, the diffraction degree of the LMO800 powder had shifted to a lower degree (Fig. 3). The lattice constant of the LMO800 powder was calculated to be 0.8236 nm, while that of the LMO600 powder calculating to be 0.8226 nm.
According to ICP results, the molar ratio of Li:Mn was 1:021 : 2for the LMO600 powder, while that of the LMO800 powder was1:015 : 2. This result also indicates no obvious change in the ratio of cations after the powder was oxidized at 800C for 12 hours. Due to the electrovalence of Mn having a major influence on the electrochemical properties of cathode powder, the average electrovalence of Mn was measured using titration. The average electrovalence of Mn in the LMO800 powder and the LMO600 powder were found to be 3.57 and 3.52. The concentration of Mn4þ for the LMO600 powder was higher, and the average electrovalence of Mn for the LMO800 powder was close to the theoretical value (3.5). In addition, the radius of Mn4þ was 0.067 nm and the radius of Mn3þ was 0.072 nm.8) It can be seen that the lattice constant of the LMO800 powder was larger than the LMO600 powder. Table 1 shows the lattice constant, the average electrovalence of Mn and the molar ratio of positive ions for both the LMO600 powder and the LMO800 powder.
Fig. 1 SEM photographs of LiMn2O4: (a) LMO600 and (b) LMO800.
Fig. 2 X-ray diffraction patterns of LMO600 powder and LMO800
powder.
35 35.5 36 36.5 37
2
θ
Intensity
LMO800 LMO600 (311)
o o o o o
[image:2.595.311.540.70.332.2]Fig. 3 XRD analysis of the cathode powders at the peak of (311).
Table 1 Properties of the LiMn2O4powders.
Lattice constant (nm)
Average electrovalence of Mn
Li:Mn:(Ni)
(molar ratio)
LMO600 0.8226 3.57 1:021 : 2
LMO800 0.8236 3.52 1:015 : 2
[image:2.595.54.287.79.424.2] [image:2.595.314.538.404.643.2] [image:2.595.306.549.722.784.2]To understand the relationship between the electrovalence of Mn and the binding energy, the surface binding energy of Mn 2p3=2of the LMO800 powder was measured using XPS
(Fig. 4). According to the result of curve fitting,9)the peak was mostly composed of Mn3þ (641.79 eV) and Mn4þ (642.86 eV). After integration, the concentration of Mn4þ was found to be about 51% (the concentration of LMO600 was more than 51%).
3.2 The influence of carbon black content on the
discharge capacity
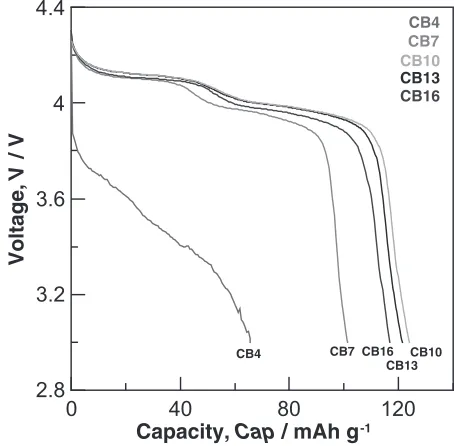
Carbon black was used as a conductive additive. Five carbon black contents of 4%, 7%, 10%, 13% and 16 mass% were chosen for capacity testing (see Table 2, here desig-nated as CBx, x being the carbon black content). Only the LMO800 powder was investigated. The carbon black was added into the cathode material (LMO800 powder and PVDF) to form a cathode specimen. The SEM image of the CB10 specimen is shown in Fig. 5, revealing that the carbon black was well dispersed.
The initial discharge capacity of the specimens with various carbon black contents was tested at 25C (Fig. 6). Results show that the CB10 specimen possessed the highest discharge capacity (124 mAh/g). When the carbon black content was lower (the CB4 specimen), the conductivity was insufficient to cause the discharge capacity to be reduced significantly. On the other hand, when the carbon black
content was more than 7 mass%, the conductivity increased and improved the discharge capacity. Notably, the discharge capacities of the CB13 specimen and the CB16 specimen were lower than the CB10 specimen. The most likely explanation for this is that in the present voltage range of 3:0{4:3V, the carbon black could not store Lithium ions. So, even adding a large amount of carbon black does not promote the discharge capacity. According to the above findings, the carbon black content of the LMO800 powder and the LMO600 powder was fixed at 10 mass% to understand the effect of heat treatment as well as charge-discharge capacity.
3.3 Charge-discharge characteristics of the electrode From the curves of initial discharge capacities at 25C (Fig. 7) show that both the LMO800 powder and the LMO600 powder had two obvious horizontal discharge zones. The First horizontal zone was in the voltage range of 4:09{4:13V and the other was at 3:89{4:05V. This shows
634 636 638 640 642 644 646 648 650
Binding Energy,
BE / eV
Intensity
641.79 642.86
Mn 2p3/2
[image:3.595.58.280.71.309.2]Fig. 4 XPS spectra analysis of the LMO800 powder for Mn (2p3=2).
Table 2 Cathode materials with various carbon black contents (mass%).
Cathodes LMO800 Carbon Black PVDF
CB4 91 4 5
CB7 88 7 5
CB10 85 10 5
CB13 82 13 5
CB16 79 16 5
Fig. 5 SEM photograph of the cathode materials (adding 10 mass% carbon
black).
0 40 80 120
Capacity, Cap / mAh g-1
2.8 3.2 3.6 4 4.4
Voltage,
V
/ V
CB4 CB7 CB10 CB13 CB16
CB4 CB7
CB10 CB13 CB16
Fig. 6 Initial discharge curves of the LiMn2O4with various carbon black
contents.
[image:3.595.310.540.72.255.2] [image:3.595.312.539.302.525.2] [image:3.595.47.291.365.441.2]that the Lithium ions embedded and disembeded had in LiMn2O4 powders in two stages. This result is also very
similar to those reported in the literature.10,11)According to our previous data, the horizontal zone of 4:13{4:09V was induced by-MnO2inlaid into Liþto form Li0:5Mn2O4. The
other zone was induced by Li0:5Mn2O4 inlaid into Liþ to
form -MnO2. Notably, both the LMO800 powder and the
LMO600 powder had spinel cubic structures (Fig. 2). However, the discharge capacity could be raised from 84 to 124 mAh/g through heat treatment.
In Fig. 3, the half-peak width of (311) of the LMO800 powder was narrower than that of the LMO600 powder. There are two probable explanations for the above findings. First: according to the Scherrer equation, the grain size of the LMO800 powder was larger (Fig. 1) resulting in the half-peak width of the diffraction pattern being narrower. Second: the atomic arrangement of the LMO800 powder was better and possessed higher crystalinity. In addition, the average electrovalence of Mn for the LMO800 powder was 3.52 close to the theoretical value of 3.5, while that of the LMO600 powder was 3.57. When the average electrovalence of Mn exceeded 3.5, the concentration of Mn3þwas lower, and Liþ could not be discharged resulting in the capacity of the LMO600 powder being lower than the LMO800 powder.
3.4 Charge-discharge cycling capacity
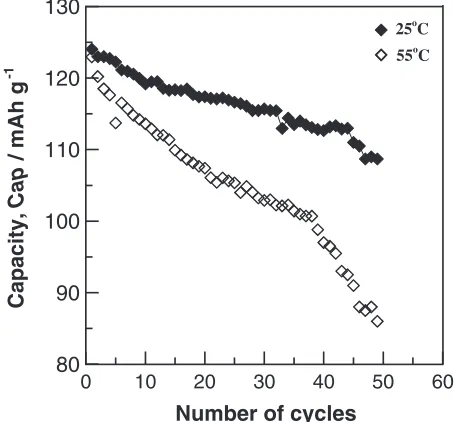
The LMO800 powder possessed a higher initial discharge capacity and was thus chosen for charge-discharge cycling capacity testing at 25 and 55C (Fig. 8). The discharge capacity reduced slowly when tested at 25C. Even after testing for 50 cycles, the discharge capacity was 109 mAh/g, which is about 88% of the initial discharge capacity. However, the discharge capacity reduced rapidly when tested at 55C. According to a relevant report,12) when testing at 55C, some Mn3þin LiMn2O4 can be reduced to Mn2þand
dissolved easily into the electrolyte resulting in the capacity decrease.
In order to clarify the above behavior, the LMO800 powders were immersed in two electrolytes (25 and 55C) for 48 hours. There upon ICP analysis was performed on the two electrolytes (Table 3). The results show that the 55C electrolyte contained a large number of Mn ions compared with the 25C electrolyte. So, it can be inferred that Mn ions diffused easily from the powder into the electrolyte at high temperature. So, this must be one reason why Mn ions dissolved from the lattice into the electrolyte during 55C discharge testing, resulting in the active materials decreasing and the charge-discharge cycling number reducing signifi-cantly.
3.5 Characteristics of surface modification powders Figure 9(a) shows the appearances of the surface mod-ification cathode powders (LMO-Ni) and many very small particles are observed on the surface. The LMO-Ni powder contains a surface oxidative film of lithium-nickel-manga-nese (Fig. 9(b)). Comparing X-ray diffraction patterns of LMO-Ni powders with LMO800 powders (Fig. 10), reveal-ing both had spinel cubic structures. So, the surface modification process had no change on the structures. In addition, the lattice constant, the average electrovalence of Mn and the molar ratio of positive ions for LMO-Ni powder are shown in Table 1.
Figure 11 shows the curves of initial discharge capacities of the LMO-Ni powder and the LMO800 powder at 25C. Notably, the average electrovalence of Mn of the LMO-Ni
0 20 40 60 80 100 120 140
Capacity, Cap / mAh g-1 2.8
3.2 3.6 4
Voltage,
V
/ V
LMO800
LMO600
Fig. 7 Initial discharge curves of LMO600 powder and LMO800 powder.
0 10 20 30 40 50 60
80
90
100
110
120
55oC
Number of cycles
Capacity,
Cap
/ mAh g
-1
Fig. 8 Charge and discharge capacities as a function of cycle number for
[image:4.595.55.282.72.302.2]LMO800 in 25 and 55C.
Table 3 ICP analyses of the electrolytes on Li, Mn and Ni.
Li (ppm) Mn (ppm) Ni (ppm)
LMO800 (25C) 10.90 3.76 —
LMO800 (55C) 15.12 6.38 —
LMO-Ni (25C) 12.03 0.56 0.07
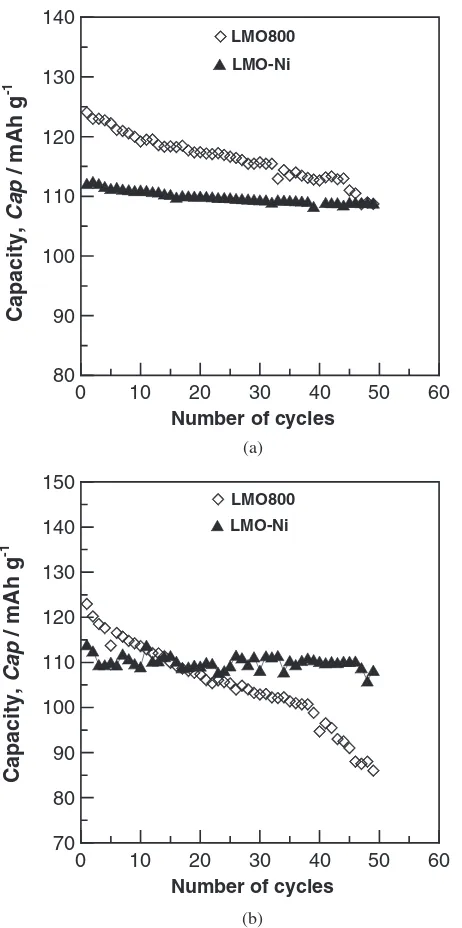
[image:4.595.313.540.76.287.2] [image:4.595.305.550.355.422.2]exceeded 3.5 (Table 1) resulting in the initial capacity of the LMO-Ni powder being lower than the LMO800 powder. However, the LMO-Ni powder possessed a higher charge-discharge cycling capacity at 25 and 55C than that of the
LMO800 powder (Fig. 12). This revealed that the surface modification was able to improve the charge-discharge cycling capacity, especially, at 55C.
In order to understand why the LMO-Ni powder enhanced the charge-discharge cycling capacity, the LMO-Ni powders also were immersed in two electrolytes (25 and 55C) for 48 hours, and ICP analysis of the two electrolytes are shown in Table 3. The results, Figs. 10 and 13 show that the Li-Mn-Ni surface oxidative film was a spinel cubic structure and the mechanism was closer together through two steps treatments (due to Li and Ni elements coating). In addition, the thickness of film is detected to be about 20 nm using EDS (an electron beam with 1 nm in diameter) that provided a protective film between the LiMn2O4 powders and
electro-lyte, and restrained Mn ions dissolved into the electrolyte during cycling tests.
4. Summary
Both the LMO600 powder and the LMO800 powder had spinel cubic structures. Notably, the particle size and lattice constant of the heat treatment powder (LMO800) was larger than the LMO600 powder. The heat treatment assisted the average electrovalence of Mn to approach the theoretical value and to have higher crystalinity. In addition, the cathode specimen with 10 mass% carbon blacks possessed the highest discharge capacity.
At 55C charge-discharge cycle testing, some of the Mn ions dissolved into the electrolyte and contributed to the decrease in the capacity. However, the surface modification (LMO-Ni) can avoid the LiMn2O4cathode powders and the
electrolyte in direct contact to enhance the charge-discharge cycling capacity.
Acknowledgements
The authors are grateful to the Chinese National Science (a)
(b)
Energy, E / keV
Fig. 9 LMO-Ni powder: (a) SEM photograph and (b) EDS analysis.
10 20 30 40 50 60 70
2
θ
Intensity
LMO800
LMO-Ni
(111)
(311) (400)
(222) (331) (511)
(440)
(531)
[image:5.595.55.283.69.407.2]O O O O O O O
Fig. 10 X-ray diffraction patterns of LMO800 and LMO-Ni.
0 20 40 60 80 100 120 140
Capacity, Cap / mAh g-1 2.8
3.2 3.6 4 4.4
Voltage,
V
/ V
LMO-Ni
[image:5.595.312.540.74.298.2]LMO800
Fig. 11 Initial discharge curves of LMO800 and LMO-Ni.
[image:5.595.63.279.448.698.2]Council for its financial support (Contract: NSC 95-2221-E-006-118).
REFERENCES
1) M. M. Thackeray, P. J. Johnson, L. A. de Picciotto and J. B.
Goodenough: Mater. Res. Bull.19(1984) 179–187.
2) S. Megahed and B. Scrosati: J. Power Sources51(1994) 79–104.
3) R. J. Gummow and M. M. Thackeray: Solid State Ionics53(1992)
681–687.
4) Y. Gao and J. R. Dahn: Solid State Ionics84(1996) 33–40.
5) Z. X. Shu, I. J. Davidson, R. S. McMillanet al.: J. Power Sources68
(1997) 618–622.
6) W. Lui, G. C. Farrington, F. Chaput and B. Dunn: J. Electrochem. Soc.
143(1996) 879–884.
7) Y. S. Han and H. G. Kim: J. Power Sources88(2000) 161–168.
8) Y. K. Sun, K. H. Lee, S. I. Moon and I. H. Oh: Solid State Ionics112
(1998) 237–243.
9) K. M. Shaju, G. V. Subba Rao and B. V. R. Chowdrai: Solid State
Ionics148(2002) 343–350.
10) M. M. Thackeray: Prog. In Batt. And Batt. Mat.14(1995) 1.
11) Y. M. Hon, K. Z. Fung, S. P. Lin and M. H. Hon: J. of Solid State
Chemistry163(2002) 231–238.
12) R. J. Gummow, A. de Korc and M. M. Thackerat: Solid State Ionics69
(1994) 59–67.
200nm LiMn2O4 Li-Mn-Ni-O
[image:6.595.57.288.70.534.2]Ni+
Fig. 13 TEM observation of the Li-Mn-Ni oxidative film.
0 10 20 30 40 50 60
Number of cycles
80 90 100 110 120
130 LMO-Ni
(a)
0 10 20 30 40 50 60
Number of cycles
70 80 90 100 110 120 130 140 150
LMO800
LMO-Ni
(b)
Capacity,
Cap
/ mAh g
-1
Capacity,
Cap
/ mAh g
-1
Fig. 12 Charge and discharge capacities as a function of cycle number for
[image:6.595.308.550.74.199.2]