Tainan 700, Taiwan, Republic of China
The strengthening mechanisms and bending toughness of the AZ61 Mg based composites reinforced by nano SiO2particles are examined. The composites were prepared either by spray forming, ingot metallurgy, or powder metallurgy, followed by severe hot extrusion. The spray formed composites exhibit the best nano particle distribution and toughness, but the volume fraction of the nano particles that can be inserted is limited. The nano composites fabricated through the powder metallurgy method possess the highest strength due to the extra strengthening effect from the MgO phase. Strengthening analysis based on the Orowan strengthening mechanism can predict well the composite strength provided that the nano particles are in reasonably uniform dispersion. For composites containing higher nano particle volume fractions greater than 3%, the experimental strength data fall well below the theoretical predictions, suggesting poor dispersion of the reinforcement.
[doi:10.2320/matertrans.47.1985]
(Received March 6, 2006; Accepted June 14, 2006; Published August 15, 2006)
Keywords: Mg alloy, nano particles, composites, strengthening, toughness
1. Introduction
The success in fabricating various nano-sized powders, wires or tubes has provided the new possibility in modifying the existing commercial materials in terms of their functional or structural characteristics. Inorganic nano oxide, nitride, refractory or highly electrically conductive metallic powders may be inserted in polymers, ceramics, metals, or semi-conductors by various means. Except for few reports, the major achievements were focused on the polymer matrix modified by ceramic nano particles so as to significantly improve its mechanical or physical properties. The addition of nano powders in metallic alloys has been relatively much less addressed.1)
The uniform dispersion of the nano reinforcements has always been a critical and difficult task. Due to the high surface area ratio, nano powders tend to cluster together, sometimes forming micro-sized aggregates. The perform-ance of the modified alloys would sensitively depend on the filler dispersion. Based on previous experience,1)secondary severe deformation processing such as rolling or extrusion might be promising routes to disperse the reinforcements. In this study, the AZ61 Mg alloys with nano-sized SiO2
particles are prepared by spray forming (SF), ingot metal-lurgy (IM), and powder metalmetal-lurgy (PM), followed by severe hot extrusion.
Spray forming is recently considered to be a potential tool to produce advanced materials. It applies inert gas atom-ization of the liquid stream into variously sized droplets which are then propelled away form the region of atom-ization by fast flowing atomizing gas.2–6) Droplets are subsequently deposited and collected by a substrate on which solidification takes place. Finally a coherent and near fully dense preform is produced. The by-product micro-sized Mg powders produced during spray forming can also be utilized for the PM route.
2. Experimental Methods
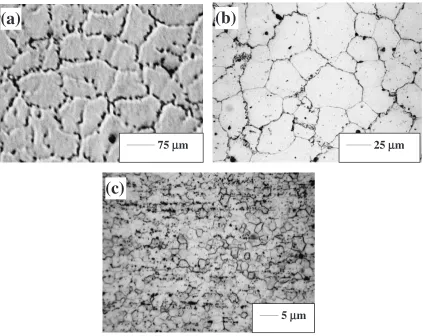
The AZ61 (Mg-5.88 mass%Al-0.74 mass%Zn) alloy, pur-chased from the CDN Company, Deltabc, Canada, was fabricated through semi-continuous casting. Amorphous SiO2 powders measuring 20nm and irregular in shape
(Fig. 1(a)), with a density of 2.65 Mg/m3, are introduced into AZ61 Mg alloys via spray forming, ingot or powder metallurgy routes, all followed by extrusion.
Spray forming was conducted with the SiO2nano particles
pre-mixed in the AZ61 billet. Figure 2 shows the simplified schematic illustration of the SF facility. Then the billet with nano particles was spray formed under special control. An example is inserted in Fig. 2, with the dimension of 180 mm in diameter and 280 mm in height, the weight of 11.7 kg, and the density of 93% with respect to the theoretical density (or around 7 volume percent in porosity). Short heating time before spray forming was to reduce the condensation of the nano particles during melting of the Mg alloys.
While spray forming technique appears to be a promising fabrication method, it is difficult to insert a high amount of nano particles through the spray nozzle. Excessive nano particles would condense near the nozzle and block the spraying Mg melt. It follows that the ingot metallurgy (IM) and powder metallurgy (PM) methods are applied to fabricate composites with nano fillers greater than 1% in volume fraction (1 vol%).
The IM route applied the high frequency induction melting at 700C for a short period of time under Ar atmosphere. The
Ar pressure was kept at 0.2 MPa so as to suppress the Mg evaporation. The PM route used the AZ61 Mg powders measuring around 10–200mm prepared by spray forming, with the substrate being placed further lower so as to gather more over-sprayed AZ61 Mg powders. The powders were then screened by several meshes to render a smaller size distribution within 20–50mm, as shown in Fig. 1(b). After a self-designed wet mixing technique, the AZ61 Mg and SiO2
powders were hot pressed in vacuum at 430C under a pressure of 100 MPa.
Subsequent extrusion was conducted using a 350 ton hot extrutor at 300 or 400C to an extrusion ratio of 100:1 (acting
as severe deformation) to refine the microstructure and to further disperse the filler. The lower extrusion temperature of 300C would result in more refined grain size, while the high
extrusion temperature of 400C would yield better bonding
between the AZ61 Mg and SiO2 filler. It is a trade-off
dilemma depending on the user needs.
The processed specimens were then characterized by optical, scanning electron, and transmission electron mi-croscopy (OM, SEM, and TEM), as well as Vicker’s hardness measurements, tensile tests, and bending tests. The TEM thin foil specimens are prepared by ion miller. Room temperature tensile testing was conducted on the as-received billet or extruded rods along the extrusion direction, with a specimen
gage length of 8.3 mm and a strain rate of1103s1. The
three-point bending tests were performed using an un-notched bending specimen with a specimen length of 55 mm and free span of 40 mm. The bending strain rate was calculated to be5104or1101s1for the low or high
rate bending test, respectively.
The particle volume fraction measured from the SEM micrographs is based on the line intercept method, assuming that the 1D line fractionLfis equal to the 2D area fractionAf, and in turn equal to the 3D volume fraction Vf. In other words, it is assumed that particles are dispersed in a 3D random and uniform manner.
As for the measurement for TEM micrographs, the projected area fractionA0f is transformed into the 3D volume fractionVf using the equation7)
___
20 nm
_________50
µ
m
(a)
(b)
Fig. 1 (a) TEM micrograph of the nearly spherical nano SiO2 particles, measuring20nm, and (b) SEM micrograph of the nearly spherical AZ61 Mg powders prepared by spray forming, measuring35mm.
Stiring
in the
melt
[image:2.595.84.515.72.243.2] [image:2.595.86.510.307.552.2]Vf ¼
2hdilnð1A0
fÞ
hdi þ3t ; ð1Þ
wherehdiis the average particle size and t the TEM thin foil thickness.
3. Results and Discussion
3.1 Microstructures
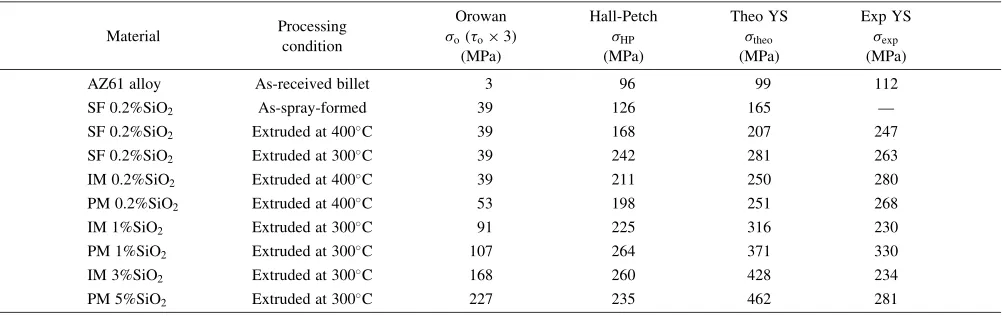
The OM micrographs of the as-received AZ61 billet and the as-SFed composite are compared in Figs. 3(a) and 3(b), showing the average grain sizes of 75mm and 25mm, respectively. The much refined grain size in the SFed composite is due to fast cooling and solidification rates during SF and the restriction from grain growth by the embedded tiny ceramic particles. After high ratio extrusion, the grain size was further refined to 2–10mm, as shown an example in Fig. 3(c), dependent on the materials and extrusion temperature. Table 1 lists the resulting grain size in various materials including the SF, IM and PM specimens. The dispersion of SiO2 in the SF, IM and PM composites
was examined under field emission SEM. There are always some dispersoids in distinct white contrast in the back-scattering electron image (BEI) micrographs, measuring around 0.2mm in average, in both the AZ61 billet and composites, as shown in Fig. 4(a). These were identified to be the Mn bearing particles (basically Al4Mn), with a low
volume fraction around 0.05%, which should have little influence on the strengthening effect. In addition to Al4Mn,
there are a very small amount of the(Mg17Al12) particles in
the extruded composites, measuring around 1mm. The low volume fraction of the Mg17Al12phase in the AZ61 based SF,
IM and PM composites is a result of the long thermal exposure of the composites at 300 or 400C for 4 h before the
hot extrusion. Most of the Mg17Al12phase would be reverted
into the matrix based on the Mg-Al phase diagram. The solubility of Al in Mg matrix at 300 or 400C is around 6.5 and 10.5 mass%, greater than the 5.88 mass% Al in the
________
25
µ
m
_________75
µ
m
______
5
µ
m
(c)
[image:3.595.88.511.71.407.2]Fig. 3 The OM micrographs of (a) the as-received AZ61 billet with a mean grain size of 75mm, (b) the as-spary-formed 0.2% composite with a mean grain size of 25mm, and (c) the spray formed 0.2% composites after hot extrusion to 100:1 at 300C with a mean grain size of 3.5mm.
Table 1 Summary of the grain size and Hv hardness of the AZ61 composites under various material and processing conditions.
[image:3.595.307.549.493.629.2]current AZ61 alloy. During the relatively rapid cooling after hot extrusion for the extruded thin bars, there would also be minimum precipitation of the Mg17Al12 phase. The
remain-ing few Mg17Al12 particles observed mostly in the IM
composites (after hot extrusion) are those not fully reverted rather than further precipitated out during cooling. In what follows, the strengthening analysis does not include the contribution from Mg17Al12.
The BEI contrasts for Si and Mg are weak due to the small difference in atomic number. In the background of the SEM BEI micrographs, after image enhancement through image software, the nano particles can be traced by the faint whiter contrast, as shown in Fig. 4(b). The particles are seen to be within 20–100 nm in size in the SF composite, 20–1000 nm in the IM composites, and 20–500 nm in the PM composites, which are mostly larger than the mean size of 20 nm for the SiO2 particles. Nano particles smaller than 20 nm are not
readily resolved by the current field emission SEM.
Local clustering is still inevitable in all composites fabricated, but the distribution overall is reasonably uniform in the composites with 0.2 vol% SiO2, prepared by SF, IM or
PM followed by 100:1 hot extrusion. The 0.2% SF composite exhibited the most uniform particle distribution, while the IM composites possessed the worst dispersion due to the tendency to condensation during casting. Severe clustering of nano SiO2 to a size up to 1mm can be seen in the IM
composites. With higher filler contents to 1–5%, clustering of the nano SiO2particles becomes gradually more serious. The
largest filler cluster size in these composites can reach 500 nm in the PM composites and even 1000 nm in the IM ones, as listed in Table 2.
TEM characterizations have been conducted on selected composite specimens, but can only reveal the particle distribution in highly localized regions. Figure 5(a) shows an example for the 0.2% SF composite after extrusion to 100:1 at 300C. The dark and larger particles in Fig. 5(a) are
identified by EDS to be the Al4Mn particles, measuring from
0.1–0.8mmand with an average size of0:2mm. Few needle shaped particles are the Mg2Si phase, as a result of the phase
transformation of SiO2þ2Mg!2MgOþSi, followed by
2MgþSi!Mg2Si. The length of Mg2Si is typically around
0.3mm(Table 2). In the background, there are some smaller and spherical particles in weak contrast. These are identified to be the individual or clustered amorphous SiO2 particles.
The amorphous nature of SiO2 makes the bright field image
in weak contrast. The distribution of such nano SiO2particles
varies in different locations. But in most cases, they are in reasonably uniform dispersion, measuring from 20 to 100 nm in this SF composite (Table 2).
In contrast, the second-phase particles in the IM and PM composites, particularly with higher SiO2 volume fractions,
are seen to disperse much less homogeneously. For example, Fig. 5(b) presents a severe cluster of the nano particles measuring around 500–1000 nm in the 1% PM composite. By close examination of the enlarged TEM bright field image in Fig. 5(c), the black and strongly contrasted particles are identified to be the MgO phase, with a size for each individual fine particle of 5–10 nm. The grey and weakly contrasted particles measuring around 20–30 nm are the remaining amorphous SiO2. The associated diffraction
pattern in Fig. 5(d) shows the strong rings originated from MgO with the weak halo background around the (000) center
_______
2
µ
m
_______2
µ
m
(a)
(b)
[image:4.595.84.512.73.211.2]Fig. 4 SEM-BEI micrographs showing (a) the white contrast from Al4Mn in the as-received AZ61 billet, measuring0:2mmand (b) the distribution of nano SiO2(only the clustered regions can be resolved by SEM, appeared in faint contrast in the background and measuring 100nm) in the SF 0.2% composites after extrusion.
Table 2 Summary of the size and volume fraction of various particle phases present in the processed composites.
SiO2 MgO Mg2Si Al4Mn
[image:4.595.47.549.286.387.2]originated from the amorphous SiO2. Overall, around 20% of
the amorphous SiO2in volume fraction has been transformed
into crystalline MgO nano particles. In the PM composites, there are extra amounts of MgO formed on the AZ61 powder surfaces during spray forming.
Based on the SEM and TEM phase analyses and quantitative measurements, there are various amounts of different phases, such as amorphous SiO2 (20nm in size
and 100–1000 nm in cluster size), MgO (5{10nm), Mg2Si
(0:3mm), and Al4Mn (0:2mm) in the processed
compo-sites. Due to the different working temperatures applied during the SF, IM and PM processes, the resulting sizes and volume fractions of such phases in these composites also vary accordingly. Table 2 summarizes the average measured values.
3.2 Mechancal properties
The hardness and tensile results are summarized in Tables 1 and 3, respectively. The Hv Vicker’s hardness,
_______
1
µ
m
__________0.5
µ
m
_____
100 nm
(c)
(d)
[image:5.595.83.512.73.472.2]Fig. 5 TEM micrographs of the AZ61 based composites showing (a) the relatively uniform distribution of the dark and larger A14Mn, needle-shaped Mg2Si and smaller and gray SiO2in the SF 0.2% composite, (b) the severe clustering of SiO2in the PM 1% composite, (c) the enlarged view of (b) showing the fine and black crystalline MgO (in strong contrast) mixed with the lighter amorphous SiO2in weak or gray contrast, and (d) the diffraction pattern taken from the clustering region in (c) showing the rings from crystalline MgO (with the weak halo intensity from the amorphous SiO2overshadowed by the rings patterns).
Table 3 Summary of the room temperature tensile properties of the AZ61 alloy and composites under various material and processing conditions.
Material Processing condition
YS (MPa)
UTS
(MPa) Elongation
AZ61 alloy As-received billet 112 181 15% SF 0.2%SiO2 As-spray-formed — — — SF 0.2%SiO2 Extruded at 400C 247 316 35% SF 0.2%SiO2 Extruded at 300C 263 340 32% IM 0.2%SiO2 Extruded at 400C 280 345 18% PM 0.2%SiO2 Extruded at 400C 268 351 27% IM 1%SiO2 Extruded at 300C 230 290 18% PM 1%SiO2 Extruded at 300C 330 379 7% IM 3%SiO2 Extruded at 300C 234 310 15% PM 5%SiO2 Extruded at 300C 281 284 4%
[image:5.595.306.549.620.766.2]yield stress (YS), and ultimate tensile stress (UTS) data on the processed composites all show different levels of strengthening with the addition of nano reinforcements, as compared with the as-received AZ61 billet. The strengthen-ing is a result of both grain refinement and dispersion hardening, as analyzed in the next section. The PM composite with 1 vol% SiO2 possesses the highest YS (330 MPa) and
UTS (379 MPa), due to the additional MgO oxides formed on the surface of AZ61 Mg powders during spray forming. However, with higher SiO2fillers to 3 and 5 vol%, even with
continuous increment in hardness, the tensile YS and UTS start to decline appreciably as a result of more severe filler clustering.
The tensile elongation of the SF composites (over 30%) is higher than those of the AZ61 billet and all composites made by other routes, suggesting more uniform particle distribu-tion. In contrast, the PM composites with 1 and 5 vol% SiO2
tend to exhibit low elongations of 4–7%, presumably also due to the ill bonding of the Mg powders which usually contain thin MgO layers on the powder surface formed during spray forming.
3.3 Strengthening analyses
The strengthening effects of the nano composites are characterized by the Orowan equation, since the second phases (SiO2, MgO, Mg2Si, and Al4Mn) found under TEM
are either ceramics in nature or large in size, thus are all non-shearable be dislocations. Strong dislocation bowing and tangling around the particles have been seen under TEM. The strengthening analysis resembles those used for dispersion hardening alloys. The critical resolved shear stress (CRSS)
can be expressed as8)
¼0:81 Gb
2ð1Þ1=2ðLs2rsÞ
ln 2rs
b
; ð2Þ
whereGis the shear modulus,bthe Burger’s vector, the Poisson ratio,Lsthe mean distance between reinforcements, and rs the radius of reinforcements. The dislocation line tension integral is taken as lnð2rs=bÞ here due to the dislocation utter cut-off distance would be very small for highly curved dislocations during the Orowan bowing process. The mean interparticles spacingLs can be assessed via the equation9)
Ls¼r
ffiffiffiffiffiffiffiffi
2 3Vf
r
; ð3Þ
whereVf is the volume fraction of the second phase. Using the data for Mg, namely,G¼17GPa,¼0:35, and
b¼ ð1=3Þ½211110 for the active Burger’s vector at room temperature, the theoretical CRSS values calculated on the base of the Orowan strengthening from eq. (1) for the four major second phases are listed in Table 4. Due to the very small amount and very large in size for the Mg2Si and Al4Mn
phases, the CRSS values for these two particles are consid-erably smaller, typically less than 1 MPa. Thus the major Orowan strengthening came from the nano SiO2 and MgO
phases, the CRSS varies from 6 to 55 MPa for various composites.
There have been numerous propositions for the addition rules suitable for adding the individual strengthening con-tributions.10–12) The most common ones are the linear and Pythagorean (or square) addition rules, namely,
o¼1þ2; ð4Þ
and
o2¼12þ22: ð5Þ
For all of the four second-phase particles observed in the current composites, they are strong obstacles forcing the dislocations to bow around the particles. The suitable superposition rule to add up such equal strength obstacles should be the Pythagorean (or square) addition rule.9)Table 4 includes the overall CRSS contributed by these four obstacles based on the linear (to1) and Pythagorean (to2) addition rules. Previous rigorous studies have tried the addition rule with an adjustable exponent q, or oq¼1qþ2q,9,13,14) and q¼1
and 2 would yield eqs. (3) and (4), respectively. Since the force profiles for obstacles 1 and 2 would not be exactly in phase, thereby the linear addition rule to simply add up the two contributions from both obstacles tends to overestimate the actual situation. It follows that o2 is in use for the subsequent analysis for the composite strengthening.
Moreover, it is known that the YS of a polycrystalline specimen can be transferred from the CRSS by multiplying the Taylor factor, M, i.e., YS¼M. The Taylor factor M is related to the texture of the material and is often in the range of 2–4.15)For the current fully recrystallized and
fine-2 2 4 o
on the (1) linear addition rule,o1, and (2) Pythagorean (or squre) addition rule,o2.
Material Processing condition
SiO2 (MPa)
MgO
(MPa)
Mg2Si (MPa)
Al4Mn (MPa)
o1 (MPa)
o2 (MPa)
AZ61 alloy As-received billet 0 0 0 0.88 0.88 0.88
SF 0.2%SiO2 As-spray-formed 6.56 11.32 0.39 0.88 19.15 13.12
SF 0.2%SiO2 Extruded at 400C 6.56 11.32 0.39 0.88 19.15 13.12
SF 0.2%SiO2 Extruded at 300C 6.56 11.32 0.39 0.88 19.15 13.12
IM 0.2%SiO2 Extruded at 400C 6.56 11.32 0.39 0.88 19.15 13.12
PM 0.2%SiO2 Extruded at 400C 8.38 15.65 0.28 0.88 25.19 17.78
IM 1%SiO2 Extruded at 300C 15.32 26.23 0.28 0.88 42.71 30.39
PM 1%SiO2 Extruded at 300C 19.83 29.69 0.63 0.88 51.03 35.72
IM 3%SiO2 Extruded at 300C 28.38 48.09 1.59 0.88 78.94 55.87
[image:6.595.49.547.94.241.2]grained AZ61 alloys or composites after hot extrusion, the texture intensity was seen to be weak16)so that M is taken to be around 3. The first row in Table 5 lists the predicted YS values attributed by the Orowan strengthening, i.e.,
o¼o23.
In addition to the Orowan strengthening contribution, the fine grain size strengthening should also be considered. The Hall-Petch relationship for the AZ-series Mg alloys has been established, based on massive experimental data, as ys¼
[image:7.595.48.549.94.252.2] [image:7.595.290.540.98.446.2] [image:7.595.313.539.271.447.2]56þ348d1=2(in units of MPa andmm, respectively).16)The calculated grain size strengthening values, HP, for various composites possessing different grain sizes are also listed in Table 5.
The linear superposition rule for the overall Orowan and grain size strengthening contributions is universally applied. Table 5 compiles the theoretically calculated YS, theo, by linearly adding theoandHP, ranging from 99 MPa for the as-received AZ61 billet to 462 MPa for the PM 5% composites. These theoretical values can be compared with the experimentally measured YS, exp, as listed in the last column of Table 5. It can be seen that for the AZ61 billet and the composites containing lower nano particle contents, the agreement between theo and exp is reasonably good. However, for higher filler contents, especially for the 3% and 5% composites, the experimental data are significantly lower than the theoretical predictions. The comparison can be more readily seen from the plot in Fig. 6. The largest discrepancy occurs for the IM 3% and PM 5% composites, where exp is lower than theo by 194 and 181 MPa, res-pectively. The experimental observed yield strengths for these latter specimens are largely contributed by the grain size strengthening. The inclusion of 3–5 vol% nano particles into the AZ61 alloy did not lead to the effective hardening, obviously a result of more severe particle clustering.
Since the Hall-Petch relationship is most likely to be obeyed in the AZ61 alloy and composites, it is meaningful to plot the experimental data on YS obtained from the AZ61 as-received billet, the SF, IM and PM composites against the d1=2, as shown in Fig. 7(a). Although most of the composite
yield stresses are above the theoretical prediction based on the AZ61 alloy matrix, there are still few data fall close or even lower than the predicted Hall-Petch line. The strength-ening contribution from the nano second phases in various
composites can be more readily seen from the net stress increment excluding the Hall-Petch contribution. This is done by linearly extracting the HP from the experimental data exp, and by plotting (expHP) against the SiO2
volume fraction, as presented in Fig. 7(b). This plot would reflect the net contribution from nano SiO2 and other
resulting second phases as a function of the inserted SiO2
volume fraction. From Fig. 7(b), it can be seen that for the 0.2 and 1 vol% specimens, the experimental data lie mostly close to or even above the theoretical prediction (the fitted solid line). However, the cases for the 3 and 5 vol% are reversed. This means that the Orowan strengthening in the 3 and 5 vol% composites are not fully revealed, due to most likely the local clustering of nano SiO2 particles.
In past, the metal matrix composites usually insert 15– 25 vol% micro-sized (1–20mm) particulate reinforcements. The particle distribution with or without secondary rolling or extrusion are mostly satisfactory. However, the composites reinforced by the nano particles (5–30 nm) are subject to serious clustering problem when the volume fraction exceed-ing 3%. This ease in condensation of the nano particles during melting, coupled with the difficulty in flowing into uniform dispersion during solid-state plastic deformation, both lead to the cluster defect. For polymer matrix nano
100 200 300 400 500
100 200 300 400 500
Experimental YS,
σ Exp
/ MPa
Theoretical YS,
σTheo
/ MPa
SF comp
IM comp
PM comp
Fig. 6 The comparison of the experimentally measured yield stress and the theoretically predicted yield stress for the various composites fabricated.
IM 0.2%SiO2 Extruded at 400C 39 211 250 280
PM 0.2%SiO2 Extruded at 400C 53 198 251 268
IM 1%SiO2 Extruded at 300C 91 225 316 230
PM 1%SiO2 Extruded at 300C 107 264 371 330
IM 3%SiO2 Extruded at 300C 168 260 428 234
composites, the filler content can be added up to 10 vol%,17) taking advantage of the viscous flow behavior above the glass transition temperature. Without such a characteristic in metals, it seems that a more rigorous plastic flow is needed. The current extrusion to an extrusion ratio of 100:1 did not seem to be sufficient. Other severe plastic deformation means such as equal channel angular extrusion or friction stir processing might be feasible. Recent trial of the same AZ61/ SiO2 composites prepared by four-pass friction stir
process-ing has demonstrated the more promisprocess-ing results.18)
3.4 Toughness
The toughness of the composites was investigated via the bending tests. Both the low strain rate (5104s1) and
high strain rate (1101s1) loadings were employed.
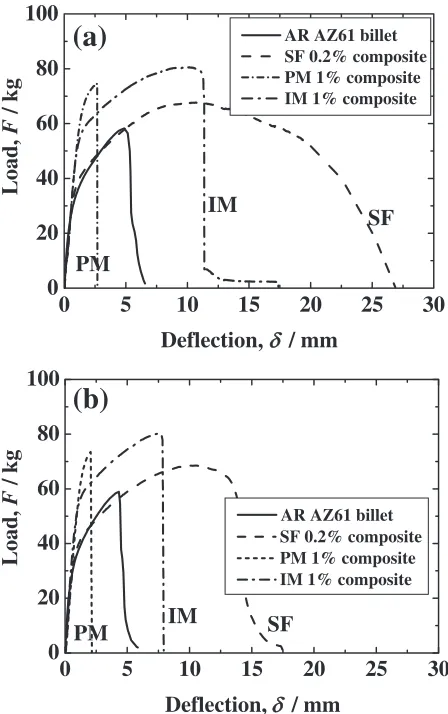
Figure 8 shows the typical load-deflection curves of the AZ61 billet and composites. It can be easily seen that the toughness is much higher at low rates. For most cases, the loads of the bending specimens fall rapidly after peak load, suggesting the weak resistance against existing cracks. The SF composite reveals the opposite behavior, where the specimen can sustain continuous deflection after peak load to nearly 20 mm.
Table 6 lists the bending results in terms of the peak load
(Fp), deflection to peak load (p), total deflection (t), crack initiation energy (Ei, or the integrated energy before the peak load), crack propagation energy (Ep, or the integrated energy after the peak load), total energy (Et), as well as the ductility index (DI), which is defied asEp=Ei. If the specimen exhibits relatively higher propagation energy after crack formation,
0
5
10
15
20
25
30
0
20
40
60
80
100
PM
IM
SF
(a)
Load,
F
/ kg
Deflection,
δ
/ mm
AR AZ61 billet SF 0.2% composite PM 1% composite IM 1% composite
0
5
10
15
20
25
30
0
20
40
60
80
100
PM
IM
SF
(b)
Load,
F
/ kg
Deflection,
δ/ mm
AR AZ61 billet SF 0.2% composite PM 1% composite IM 1% composite
[image:8.595.315.539.74.431.2]Fig. 8 The bending load-deflection plots of the AZ61 billet and composites at (a) low strain rate (5104s1) and (b) high strain rate (1101s1).
Table 6 The toughness obtained via triple point bending tests on speci-mens extruded at 300C.
Fp (kg) p (mm) t (mm) Ei (J) Ep (J) Et (J) DI
Low rate (5104s1)
AR AZ61 billet 58 4.80 6.67 2.08 0.27 2.35 0.130 SF 0.2% 67 9.80 26.87 4.89 8.56 13.45 1.751 IM 1% 80 10.17 17.38 6.23 1.41 7.64 0.226 PM 1% 74 2.65 2.69 1.33 0.02 1.35 0.015 IM 3% 53 8.70 15.29 3.49 0.60 4.09 0.172 PM 5% 60 2.37 2.42 0.97 0.01 0.98 0.010
High rate (1101s1)
AR AZ61 billet 58 4.30 5.85 1.87 0.23 2.10 0.123 SF 0.2% 68 10.00 17.5 5.40 2.80 8.30 0.519 IM 1% 80 6.84 7.92 4.84 0.18 5.02 0.037 PM 1% 73 2.07 2.16 0.89 0.03 0.92 0.033
0.0 0.1 0.2 0.3 0.4 0.5 0.6 0.7
0 50 100 150 200 250 300 350 400
(a)
Yield stress,
σ YS/ MPa
d
-1/2/
µm
-1/2Hall-Petch Theo SF comp IM comp PM comp
0 2 5
-50 0 50 100 150 200 250
(b)
Stress,
σ Exp − σ HP/ MPa
SiO
2volume fraction,
V
f/ %
Theoretical value SF comp IM comp PM comp
1 3 4 6
[image:8.595.55.284.75.420.2] [image:8.595.305.549.507.684.2]always exhibit much lower deflections (p andt both less than 3 mm), as well as lowEt(1J) and low DI (0.01–0.03). The IM composites fall in-between the SF and PM counter-parts.
In comparing Figs. 8(a) and 8(b), which represents the low rate and high rate bending tests, composite specimens subjected to low rate bending exhibited higher deflections, while the maximum loads are almost the same. When the samples are bent at low rates, they tend to undergo a certain level of plasticity before and after microcrack initiation (occurring near the peak load stage). While bent at high rates, cracks would propagate rapidly and plastic deformation did not seem to catch in time. It is worth noting that the SF samples can sustain higher deflections both at low and high rates, suggesting the better toughness under different loading conditions.
For practical application, the DI index is preferred to be greater than 1.0, thus the SF composite perform better in this aspect. The spray forming technique is demonstrated to offer an effective route to prepare composites with nano reinforce-ments. Further improvement to control the spray forming process is worth trying. Separate spraying of the Mg melt and nano particles through two separate nozzles might lead to better particle distributions and higher amounts of nano particles to be sprayed.
4. Summary
The AZ61 Mg based composites containing SiO2particles
measuring 20 nm in diameter were prepared either by spray forming, ingot metallurgy, or powder metallurgy, followed by severe hot extrusion to 100:1 at 300–400C. The grain size
of the resulting composites is around 2–4mmas extruded at 300C and around 5–10mmas extruded at 400C. Some of the amorphous SiO2 nano particles would transform into
MgO measuring 5–10 nm and Mg2Si measuring around
0.3mm. In addition, there are small amounts of Al4Mn
particles measuring around 0.2mmformed in the AZ61 billet as well as in all composites fabricated.
In comparison, the spray formed composites exhibit the best nano particle distribution and tensile elongation, but the volume fraction of the nano particles that can be inserted is
predictions.
The toughness of the AZ61 billet and the fabricated composites are evaluated by the three-point bending at low and high rates. The SF composite again exhibits the highest deflection, fracture energy, and ductility index, consistent with the tensile elongation. The PM composites fail at a considerably low toughness, presumably due to the ill bonding of the Mg powders which usually contain thin MgO layers on the powder surface formed during spray forming.
Acknowledgements
The authors gratefully acknowledge the sponsorship by National Science Council of Taiwan, ROC, under the projects NSC 92-2216-E-110-017 and NSC 92-2216-E-006-037.
REFERENCES
1) T. D. Wang and J. C. Huang: Mater. Trans.42(2001) 1781–1789. 2) A. R. E. Siger: Met. Mater.4(1970) 246–252.
3) B. Williams: Met. Powder Rep.35(1980) 464–470.
4) S. Spangel, E. Matthaeischulz, A. Schulz, H. Vetters and P. Mayr: Mater. Sci. Eng.A326(2002) 26–39.
5) C. Y. Chen and ChiY. A. Tsao: Mater. Sci. Eng.A383(2004) 21–29. 6) Y. H. Frank Su, Y. C. Chen and ChiY. A. Tsao: Mater. Sci. Eng.A364
(2004) 296–306.
7) E. E. Underwood:Quantitative Stereology, (Addition Wesley, Read-ing, New York, 1970) 173–178.
8) P. M. Kelly: Scripta. Metall.6(1972) 647–656. 9) A. J. Ardell: Metall. Trans.16A(1985) 2131–2165.
10) L. M. Brown and R. K. Ham: Strengthening Methods in Crystals, (Halsted Press Division, John Wiley & Sons, New York, 1970) 9–15. 11) R. Labusch: Phys. Stat. Sol.41(1970) 659–666.
12) G. Neite, M. Sieve, M. Mrotzek and E. Nebach:Proc. 4th RisInt. Syposium on Metallurgy and Materials Science, (RisNational Lab., Roskilde, Denmark, 1983) 447–453.
13) J. C. Huang and A. J. Ardell: Acta Metall.36(1988) 2995–3006. 14) A. W. Zhu, A. Csontos and E. A. Starte, Jr.: Acta Mater.47(1999)
1713–1721.
15) G. I. Taylor: J. Inst. Metals62(1938) 307–313.
16) H. K. Lin and J. C. Huang: Mater. Trans.43(2002) 2424–2432. 17) M. C. Kuo and J. C. Huang: Mater. Chem. Phys.90(2005) 185–195. 18) C. J. Lee, J. C. Huang and P. J. Hsieh: Scripta Mater.54(2006) 1415–