Influences of Concentrations of H
2SO
4and NaCl on Stress Corrosion Cracking
of SUS304 Stainless Steel in H
2SO
4–NaCl Aqueous Solutions
*1Satoshi Sunada
1, Masanori Kariba
1;*2, Kazuhiko Majima
1and Katsuhisa Sugimoto
21
Department of Material Systems Engineering and Life Science, Faculty of Engineering, University of Toyama, Toyama 930-8555, Japan
2Education Counseling Office, Graduate School of Engineering, Tohoku University, Sendai 980-8579, Japan
A stress corrosion cracking (SCC) test was carried out at room temperature in aqueous solutions containing both H2SO4(0–5.5 kmolm3)
and NaCl (0–4.5 kmolm3), in order to study the influences of both solutes on the corrosion type of SUS304 steel. The two solutes have
synergistic influence on the corrosion type, that is, SCC and general corrosion occur within a specific concentration range and elsewhere, respectively. For a constant H2SO4concentration the mass loss of corrosion shows a V-shape when it is plotted against NaCl concentration. On
the other hand, maximum crack length of the SCC increases with increasing NaCl concentration up to a certain value, and then decreases. This gives a nearly inverse V-shape curve. In addition, the NaCl concentration ranges for the minimum mass loss and for the maximum crack length are almost the same. It was also confirmed that NaCl concentrations showing the minimum mass loss and the maximum crack length are inversely proportional to H2SO4concentrations.
(Received October 20, 2005; Accepted December 19, 2005; Published February 15, 2006)
Keywords: stress corrosion cracking, SUS304 stainless steel, mass loss, crack length, adsorption mechanism
1. Introduction
SUS304 steel, meta-stable austenitic stainless steel, has excellent corrosion resistance, workability, and weldability, in addition to good malleability and high toughness. Hence, this steel is used in wide range of environment. However, even though the stainless steel is corrosion resistant, it is corroded with a variety of corrosion modes in severe service environments. In particular, stress corrosion cracking (SCC) is one of the most significant corrosion issues concerned. SCC occurs in a form of local cracking, when the material under tensile stress is exposed to an environment specific to the material.
Acello and Green1)reported first that SCC occurs to a U-bend SUS304 steel specimen in relatively short period at 303 K in aqueous solutions of H2SO4–NaCl. After this report many researchers2–8) dealt with the SCC in these solutions, and they5,7) reported that the SCC occurs in a particular concentration range of NaCl and in the other range general corrosion occurs or cracking is suppressed.
On the other hand, Tsujikawaet al.9–15)performed the SCC studies where specified potentials were applied to the specimens, and measured the dissolution rates at the crack paths as well as the other areas. They reported14) that the cracking occurs only when the dissolution rate at the crack paths is larger than that at the other areas.
In these studies, however, stress value and degree of plastic deformation were unclear, because the specimens were strained to plastic deformation by the U-bend loading. In addition, the concentration range of NaCl where SCC occurs was reported for specified levels of [H2SO4] (Square bracket means concentration throughout this paper except for figures.), but the concentration ranges of H2SO4 and NaCl tested were rather limited. There seems to be no report that
dealt with SCC over wide concentration ranges of H2SO4and NaCl. Further, Tsujikawaet al.measured crack length under varying potentials in only one kind of solution, and no results for the other solutions.
Nishimuraet al.16,17)studied the SCC in aqueous solutions containing H2SO4and NaCl, which are similar to those used in this study. They reported the occurrence of SCC at 353 K in solutions of [NaCl] ranging from 0 to 1.0 kmolm3with a constant [H2SO4] of 0.82 kmolm3. They dealt with quanti-tative influence of the corrosion environment on the propagation of localized corrosion by measuring the elonga-tion rate of the specimen under SCC condielonga-tions with a constant stress. However, specification of the areas for cracking over varying [H2SO4] and [NaCl] was excluded, and the correlation of the area with the crack propagation rate was also excluded.
On the basis of the above background the authors dealt with the SCC characteristics of SUS304 steel in aqueous solutions containing H2SO4 and NaCl, where [H2SO4] and [NaCl] were widely varied. Their concentration ranges where SCC occurs were experimentally clarified. The amount of total corrosion and the crack length were measured as criteria of SCC behavior, and the relationship between them was investigated.
2. Experimental Procedures
2.1 Specimen
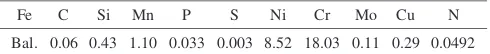
[image:1.595.305.550.756.783.2]A commercially available SUS304 stainless steel sheet of 2 mm thickness was used. Its chemical composition is shown in Table 1. Coupon specimens measuring50152in mm were machined out of the sheet. They were annealed in a vacuum furnace at 1353 K for 1.8 ks and quenched into ice
Table 1 Chemical composition of SUS304 stainless steel (mass%).
Fe C Si Mn P S Ni Cr Mo Cu N Bal. 0.06 0.43 1.10 0.033 0.003 8.52 18.03 0.11 0.29 0.0492
*1This Paper was Originally Published in Japanese in J. Jpn. Inst. Metals69
(2005) 899–906.
*2Graduate Student, University of Toyama
water for avoiding the influence of cold rolling and deformaton-induced martensite due to cutting, and for obtaining a fully austenitic structure, which was confirmed by X-ray diffractometry.
2.2 Preparation of corrosion test solutions
The test solutions were aqueous solutions of H2SO4, aqueous solutions of NaCl, and mixtures of these. The [H2SO4] ranged from 0.5 to 5.5 kmolm3. NaCl was added to these solutions to have [NaCl] ranging from 0 to 5.0 kmolm3. The [H2SO4] was adjusted using a densitometer and [NaCl] by a microbalance with a sensitivity of 0.1 mg. The specific mass of the solution was adjusted at 293
0:5K. Reagent grade chemicals and deionized water with a specific conductivity less than2104Sm1were used for the solution preparation.
2.3 SCC test
SCC test was performed in the test solutions containing various values of [H2SO4] and [NaCl]. A three-point bending jig made of polyvinyl chloride, shown in Fig. 1, was used for loading the specimen. It is possible to apply desired bending stress to the specimen by rotating the central bolt made of polyvinyl chloride. A uniaxial strain gage was stuck on the specimen along the longitudinal direction for precise strain measurement. The stress applied to the specimen was obtained by multiplying the strain and the Young’s modulus of austenitic stainless steel. Through these methods the stress at the specimen surface was adjusted to be 278 MPa and the residual surface strain to be 0.29%.
The specimen surface was wet-polished with a series of waterproof Emery papers of up to #2000, washed in alcohol, and then ultrasonically cleaned in acetone for 300 s. A test solution of about 470 mL was put in a 500 mL beaker and the whole was set in a chamber at 303 K for more than 3.6 ks for controlling the amount of dissolved oxygen to be constant.
Then, the specimen fixed to the bender, hence stressed, was immersed in a test solution at 303 K for 259.2 ks (3 d). A mass of the specimen was measured with a balance before and after the immersion test, and a corrosion mass loss per surface area,m, was obtained.
After the SCC test the specimen was cut in parallel to the direction of stress and normal to the surface with a thin cutting wheel. Then, a piece of the specimen was mounted in resin, cross section was polished similarly as shown before, and further polished to a mirror finish using a buff cloth for observation. The specimen was subjected to electro etching in an aqueous solution of 10 mass% oxialic acid at 6 V for about 120 to 180 s at room temperature followed by been
rinsed and dried for revealing its microstructure. Then, the cross section was observed by scanning electron microscopy (SEM) and crack depth was obtained.
3. Experimental Results and Discussion
3.1 Influences of [H2SO4] and [NaCl] on occurrence of
SCC
The SCC test was performed in aqueous solutions containing various [H2SO4] and [NaCl] for understanding the concentration ranges where SCC occurs. In order to identify the corrosion mode SEM observations were per-formed over the cross sections of the specimens immersed in the solutions for 259.2 ks.
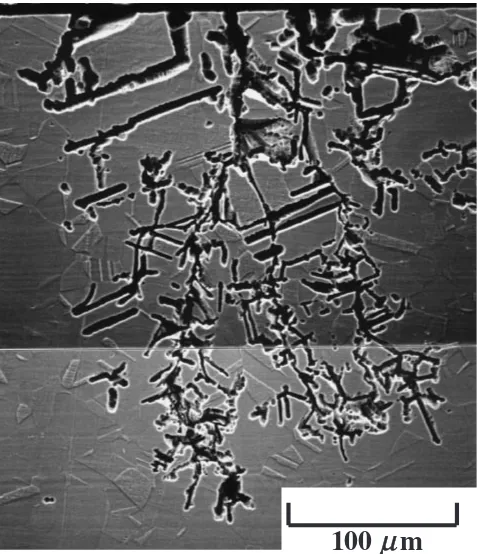
Figure 2 shows typical SCC feature obtained in the cross section. The top in the figure is the surface area exposed to the test solution and the stress direction is horizontal. As you can see in the figure tree-like crack propagation and surface roughening were observed. Some of the cracks seem to have initiated as grain boundary corrosion, followed by its propagation. Semi-circular crack tips with radius of 2.5mm
were observed, where the dissolution of the specimen seems to have been enhanced by the stress.
In addition, the cracks ran along grain boundaries and also through grains. Even some of short cracks ran through the both. These observations allow us to conclude that the corrosion mode is a mixture of transgranular-type SCC and intergranular-type SCC.18)
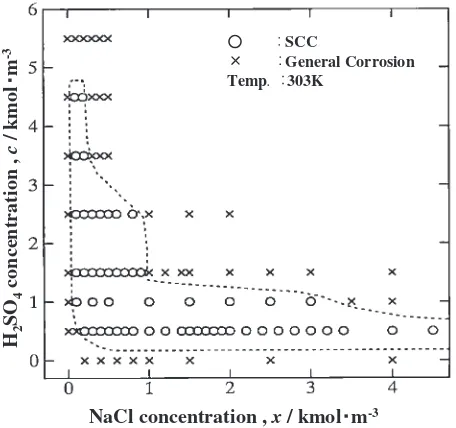
Figure 3 shows a map where general corrosion and SCC are distinguished with respect to [H2SO4] and [NaCl]. The area for SCC is shown by the broken line. Representative SEM photographs over cross sections showing the both types
polyvinyl chloride resin specimen
glass
polyvinyl chloride resin bolt
Fig. 1 Schematic illustration of a three point beam loading apparatus.
100
µ
m
Fig. 2 SEM micrograph showing typical SCC mode of the specimen after the SCC test in 2.5 kmolm3H
[image:2.595.308.547.72.349.2] [image:2.595.57.277.78.162.2]of corrosion are given in Figs. 4 to 6 for [H2SO4] of 0.5, 1.5, and 3.5 kmolm3, respectively.
Figure 4 shows the cross sections of the specimens depending of [NaCl] where [H2SO4] was fixed to be 0.5 kmolm3. General corrosion with no grain boundary corrosion nor surface roughening can be seen for the solution without NaCl. For the solutions of [NaCl] of more than 0.2 kmolm3 SCC occurred as shown in Fig. 4. The observation that the metal loss resulted from semi-circular tipped cracks, shown in Fig. 4, leads to a conclusion that SCC here is active-path type. Such SCC was observed for [NaCl] of up to 4.5 kmolm3. The test was, however, impossible for [NaCl] of 5 kmolm3, because NaCl did not dissolve completely in the solution. Thus, the upper limit of [NaCl] for the occurrence of SCC was not determined for the solutions containing H2SO4of 0.5 kmolm3.
The SCC results for the solutions containing a constant [H2SO4] of 1.5 kmolm3 with various [NaCl] are shown in Fig. 5 in a similar way. SCC occurred within a range of [NaCl] from 0.1 to 0.9 kmolm3, and general corrosion took place for the solution without NaCl and the solutions with [NaCl] ranging from 1.0 to 4.0 kmolm3.
NaCl concentration , x / kmol m-3
H2
SO
4
concentration ,
c
/ kmol
m
-3 SCCGeneral Corrosion
Temp 303K
Fig. 3 Corrosion type map for the specimens after the SCC test in the solution of H2SO4(0–5.5 kmolm3) with NaCl (0–4.5 kmolm3).
SCC
SCC
SCC
general corrosion
4.0kmol m
-3NaCl
2.0kmol m
-3NaCl
0.6kmol m
-3NaCl
0kmol m
-3NaCl
100µm 100µm 100µm 100µm
Fig. 4 SEM micrographs of the cross sections of the specimens after the SCC test in 0.5 kmolm3H
2SO4solutions with 0, 0.6, 2.0 and
4.0 kmolm3NaCl at 303 K for 259.2 ks.
general corrosion
SCC
SCC
general corrosion
1.5kmol m
-3NaCl
0.5kmol m
-3NaCl
0.3kmol m
-3NaCl
0kmol m
-3NaCl
100µm 100µm 100µm 100µm
Fig. 5 SEM micrographs of the cross sections of the specimens after the SCC test in 1.5 kmolm3H
2SO4solutions with 0, 0.3, 0.5 and
[image:3.595.56.284.72.286.2] [image:3.595.98.498.353.529.2] [image:3.595.98.497.583.756.2]Similarly, for the solutions containing a constant [H2SO4] of 3.5 kmolm3 SCC occurred for [NaCl] of 0.1 and 0.2 kmolm3, and general corrosion took place for the other [NaCl] as shown in Fig. 6.
[image:4.595.97.497.70.253.2]The above mentioned SCC characteristics as shown in Fig. 3,i.e.SCC occurs within certain concentration ranges of NaCl, agreed well with the report by Asawa.5)In addition, it was found in this study that this concentration range becomes smaller with an increase in [H2SO4].
3.2 Influence of [H2SO4] and [NaCl] on corrosion mass
loss
Figure 3 clearly shows that SCC occurs at specified ranges of [H2SO4] and [NaCl]. Hence, the influence of [NaCl] on min a constant period was examined as a parameter of SCC for several levels of [H2SO4].
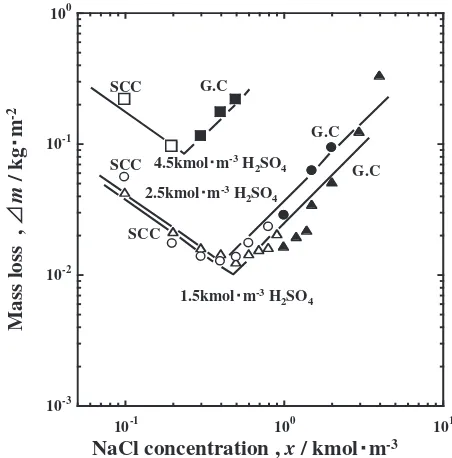
[image:4.595.312.538.302.531.2]Figure 7 shows the influence of [NaCl] onmfor [H2SO4] of 1.5, 2.5, and 4.5 kmolm3 as representatives. For all the levels of [H2SO4] V-shape plots were obtained whenmwas plotted against [NaCl]. This means that for a constant [H2SO4]mdecreases with an increase in [NaCl] for up to a certain concentration, beyond which m increases. The values of [NaCl] corresponding to the minima of m are about 0.5, about 0.4, and 0.2 kmolm3 for [H2SO4] of 1.5, 2.5, and 4.5 kmolm3, respectively. This means that [NaCl] corresponding to the minimum of m decreases with an increase in [H2SO4].
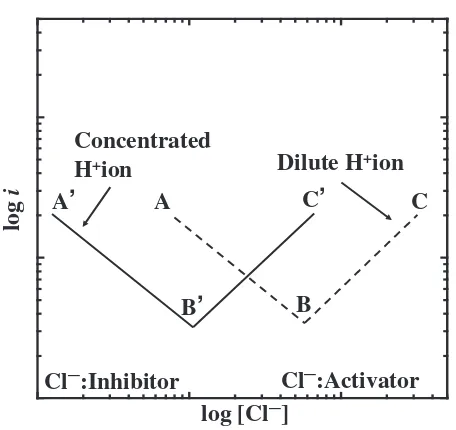
This characteristic point will be discussed below by referring to Sato’s article.19)Sato explained the influence of OH and Cl on the active dissolution of metal in the following manner. First each of the both anions enhance the active dissolution of Fe. Second, however, in the solution containing both the species their influence on the dissolution is not simple and they compete with each other. Sato reported Fig. 8 for explaining the influence of [Cl] in aqueous solution of a constant [Hþ] on the anodic dissolution rate of a metal at a constant potential by referring to the reports of McCaffertet al.20)and others.21–23)
According to his report19) OH enhances the anodic dissolution in a low range of [Cl]. Under the conditions,i.e.,
near point A in Fig. 8, an increase in [Cl] decreases the influence of OH which is to enhance the dissolution, resulting in reduced dissolution rates. In this case, Cl reduces the anodic dissolution rate, contrary to the case where only Cl is in the solution. When [Cl] exceeds point B (transition concentration, will be discussed later) in Fig. 8, the anodic dissolution rate increases with an increase in [Cl], because the influence of Cl prevails over that of OH, i.e., the influence of Cl on the anodic dissolution prevails over that on suppression of the effect of OH. Thus, V-shape plot is obtained when the dissolution rate is plotted against [Cl]. The same explanation can be applied to solutions of high [Hþ] as shown in Fig. 8, which shows the
general corrosion SCC
general corrosion
0.5kmol m-3NaCl
0.2kmol m-3NaCl
0kmol m-3NaCl
100µm 100µm 100µm
Fig. 6 SEM micrographs of the cross sections of the specimens after the SCC test in 3.5 kmolm3H
2SO4solutions with 0, 0.2 and
0.5 kmolm3NaCl at 303 K for 259.2 ks.
10-3 10-2 10-1 100
10-1 100 101
NaCl concentration , x / kmol m-3
Mass loss ,
m
/ kg
m
-2
2.5kmol m-3H 2SO4
1.5kmol m-3H 2SO4
4.5kmol m-3H 2SO4
SCC
SCC
SCC
G.C
G.C
G.C
Fig. 7 Effect of NaCl concentration on the mass loss of specimens. : SCC 1.5 kmolm3 H
2SO4+xkmolm3 NaCl, : General corrosion
1.5 kmolm3 H
2SO4+x kmolm3 NaCl, : SCC 2.5 kmolm3
H2SO4+x kmolm3 NaCl, : General corrosion 2.5 kmolm3
H2SO4+x kmolm3 NaCl, : SCC 4.5 kmolm3 H2SO4+xkmol
m3 NaCl, : General corrosion 4.5 kmolm3 H
2SO4+x kmolm3
two cases of high and low [Hþ]. The concentration of [Cl] at which the turnover occurs is defined as the transition concentration and this is higher for lower [Hþ] (higher [OH]).
The above mentioned Sato’s idea can be applied to the present study, since V-shape active dissolution plots of figures are similar to Fig. 8 in this study, and thus it can be concluded that both Cl and OHare significantly involved in the occurrence of SCC. For showing this view straight lines were applied to the plots in Fig. 7, where minima are taken as the transition concentrations. In addition, the plots corresponding to the occurrence of SCC are shown by open marks in Fig. 7, and they are located near the minima ofm, though there are slight disagreements.
3.3 Influence of [H2SO4] and [NaCl] on crack length
As it was found that the maximum crack length varies with [H2SO4] and [NaCl], the crack length after a constant immersion time was measured as an SCC parameter. The representative results are shown in Fig. 9 where the max-imum crack length is plotted against [NaCl] for three levels of [H2SO4] of 1.5, 2.5, and 4.5 kmolm3. For a constant [H2SO4] of 1.5 kmolm3 the maximum crack length increases gradually with an increase in [NaCl] from 0.1 to 0.3 kmolm3, and then decreases gradually for [NaCl] range of 0.3 to 0.8 kmolm3. Further, it decreases sharply in a range between 0.8 and 0.9 kmolm3. No cracking was observed when [NaCl] was increased to 1.0 kmolm3. The same tendency is clearly seen for a constant [H2SO4] of 2.5 kmolm3such that the maximum crack length has a peak at [NaCl] of 0.3 kmolm3. It decreases gradually and then sharply in a range of 0.5 to 0.8 kmolm3. No cracking was observed for [NaCl] of 0.9 kmolm3. For a constant [H2SO4] of 1.5 kmolm3 the crack length decreases sharply over [NaCl] range of 0.8 to 0.9 kmolm3 and for [H2SO4] of 2.5 kmolm3 over 0.4 to 0.5 kmolm3. The comparison of the both cases revealed that [NaCl] for the peak and for the sharp drop decreases with an increase in [H2SO4].
For a constant [H2SO4] of 4.5 kmolm3the cracking was observed only for [NaCl] of 0.1 kmolm3. If measurement was performed with smaller intervals of [NaCl], a peak would be found.
3.4 Influence of [H2SO4] and [NaCl] on the minimum
peak ofmand the maximum peak of crack length The experimental results clearly showed that m has a minimum peak against [NaCl] and [NaCl] corresponding to the minimum peak decreases as [H2SO4] increases. On the other hand, the crack length shows a maximum against [NaCl] and [NaCl] corresponding to this maximum peak decreases as [H2SO4] increases. These findings imply a strong relationship betweenmand the crack length.
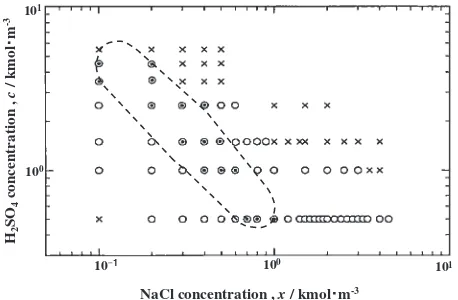
Figure 10 shows corrosion types (in a form of mapping) as a function of [NaCl] and [H2SO4]. Three plots of [NaCl] which indicate the minimum peak of m are shown in Fig. 10 for each [H2SO4]. Though the distances between these symbols are not constant because of logarithmic plots, they fall nearly in the band area shown by the broken line. The concentration of H2SO4showing the minimum peak of mdecreases with an increase in [NaCl].
A similar plot is made in Fig. 11, where three plots of [NaCl] which indicates the maximum peak of crack length is shown for each [H2SO4]. The cases with two or one sign mean that the cracking was found only for these concen-trations. These points fall nearly in the band shown by the broken line, showing a similar characteristic to Fig. 10. The bands in these two figures locate almost the same place.
The minimum peak ofmmeans that the dissolution rate at the area without crack paths is minimized by the competitive adsorption between OH and Cl. Because of this the specimen becomes thinner with the lowest rate, but these anions have no influence on the dissolution rate at the crack paths. The band area in Fig. 10 are made of three plots
log
i
log [Cl
–
]
A
A
,
B
,
B
C
,
C
Dilute H
+ion
Concentrated
H
+ion
Cl
–
:Inhibitor
Cl
–
:Activator
Fig. 8 Schematic illustration showing the effect of Clion on the anodic dissolution rate of metal proposed by Sato.19)
10-5 10-4 10-3
10-2 10-1 100 101
NaCl concentration , x / kmol m-3
Maximum crack length
,
l
/ m
1.5kmol m-3H 2SO4
2.5kmol m-3H 2SO4
4.5kmol m-3H 2SO4
Fig. 9 Effect of NaCl concentration on crack length for specimens. : SCC 1.5 kmolm3H
2SO4+xkmolm3NaCl, : SCC 2.5 kmolm3
H2SO4+x kmolm3 NaCl, : SCC 4.5 kmolm3 H2SO4+xkmol
[image:5.595.57.285.65.280.2] [image:5.595.312.542.71.292.2]for showing minima ofm, but this band is referred to as a boundary indicating two areas and its location agrees well with the line separating the areas in Fig. 12 as described below.
Figure 12 shows the areas according to Sato’s concept, where corrosion by the hydroxide mechanism or that by the chloride mechanism prevails. He separated the area clearly by the straight line, along which the corrosion is suppressed. Therefore, the concentration area showing the minimum peak of m in Fig. 10 can be explained by Sato’s concept. In addition, since the band area in Fig. 10 agrees approximately with that in Fig. 11, it can be concluded that within these band area a set of particular conditions is attained for SCC to take place. From the agreement between the band areas in Figs. 10 and 11, it can be said that significant competition between OH and Cl takes place resulting in a minimum peak of the corrosion mass loss at areas without crack paths. However, under the particular set of conditions, when the specimen is stressed, several times of the applied stress would operate at the crack tips owing to stress concentration which can be simulated by opto-elasticity. At such crack tips the dissolution seems to occur by a mechanism induced by the stress rather than by the competitive influence between OHand Cl. Then, the dissolution mechanism at the crack
tip seems to be different from Sato’s. Therefore, the dissolution mechanism at the crack paths and at the other area are very different, even though the chemical composi-tion is the same. One of the influential factors is stress-induced martensite transformation. This is another topic for a future study.
4. Conclusions
The main results obtained in this study are summarised as follows.
(1) The SCC takes place for SUS304 steel in aqueous solutions containing H2SO4 and NaCl of particular concentration ranges, and general corrosion occurs in the solutions of the other concentration ranges. (2) General corrosion takes place in aqueous solutions
containing either H2SO4or NaCl of any concentrations tested
(3) The corrosion mass loss of SUS304 steel immersed in aqueous solutions containing H2SO4and NaCl shows a minimum against NaCl concentration for a constant H2SO4 concentration. This V-shape trend can be explained from the transition from hydroxide mecha-nism to chloride mechamecha-nism for the anodic dissolution proposed by Sato.
(4) The crack length due to SCC in aqueous solutions containing H2SO4 and NaCl shows a maximum peak against NaCl concentration for a constant H2SO4 concentration.
(5) The concentration ranges of NaCl for the minimum peak of corrosion mass loss in (3) and for the maximum peak of crack length in (4) are approximately the same for constant H2SO4 concentrations.
REFERENCES
1) S. J. Acello and N. D. Green: Corrosion18(1962) 286–290. 2) I. S. McCollough and J. C. Scully: Corros. Sci.9(1969) 651–658. NaCl concentration , x / kmol m-3
H2
SO
4
concentration ,
c
/ kmol
m
-3
101
100
[image:6.595.314.542.72.267.2]101 100 101
Fig. 11 Corrosion types indicated by the relation between sulfuric acid and sodium chloride.: General corrosion, : SCC, : Maximum peak of crack length.
log [Cl
–
]
log [H
+
]
Selected adsorption of Cl –
[image:6.595.56.284.74.225.2]Selected adsorption of OH –
Fig. 12 Schematic illustration showing the adsorption mechanism for dissolution of metals in the relation between hydrogen ion and chloride ion proposed by Sato.19)
NaCl concentration , x / kmol m-3
H2
SO
4
concentration ,
c
/ kmol
m
-3
101 100 101
101
100
[image:6.595.55.284.289.439.2]3) S. Kijima: Boshoku Gijutsu17(1968) 193–201.
4) J. D. Hartson and J. C. Scully: Corros. Sci.25(1969) 493–501. 5) M. Asawa: J. Jpn. Inst. Met.34(1970) 871–877.
6) N. A. Nielsen: Corrosion27(1971) 173–189.
7) H. Kamide and H. Sugawara: Boshoku Gijutsu25(1976) 89–95. 8) M. Asawa: TETSU-TO-HAGANE8(1971) 1340–1349.
9) S. Tsujikawa and Y. Hisamatsu: J. Jpn. Inst. Met.41(1977) 829–837. 10) O. Ando, S. Tsujikawa and Y. Hisamatsu: Boshoku Gijutsu27(1978)
580–582.
11) K. Kon, S. Tsujikawa and Y. Hisamatsu: J. Jpn. Inst. Met.45(1981) 1043–1048.
12) S. Tsujikawa, K. Tamaki and Y. Hisamatsu: TETSU-TO-HAGANE14
(1980) 2067–2076.
13) T. Shinohara, S. Tsujikawa and Y. Hisamatsu: Boshoku Gijutsu34
(1985) 283–290.
14) T. Shinohara, Y. Atarashiya and S. Tsujikawa: Proceeding of 43rd
Japan Corrosion Conference, J. Soc. Cor. Eng. (1996) 59–62. 15) P. Che-Sheng Chen, T. Shinohara and S. Tsujikawa: Zairyo-to-Kankyo
46(1997) 313–319.
16) R. Nishimura: Corros. Sci.34(1993) 1859–1868.
17) R. Nishimura and Y. Maeda: Corros. Sci.46(2004) 755–768.
18) Stainless Binran: Stainless Kyokai, (Nikkan Kogyo Shinbunshya,
1995) p. 262.
19) N. Sato: Boshoku Gijutsu39(1990) 495–511.
20) E. McCafferty and N. Hackerman: J. Electrochem. Soc.119(1972) 999–1004.
21) H. C. Kuo and K. Nobe: J. Electrochem. Soc.125(1979) 853–859. 22) N. A. Darwish, F. Hilbert, W. J. Lorenz and H. Rossway:
Electro-chimica Acta18(1973) 421–426.
23) K. E. Heusler and G. H. Cartledge: J. Electrochem. Soc.108(1961) 732–740.