Munich Personal RePEc Archive
Export Performance with Border Sharing
Countries: An Assessment of Pakistan
Munir, Kashif and Sultan, Maryam
University of Central Punjab
14 February 2016
Export Performance with Border Sharing
Countries: An Assessment of Pakistan
Kashif Munir
*&
Maryam Sultan
†University of Central Punjab,
Lahore, Pakistan
*
Associate Professor, Department of Economics, University of Central Punjab, Lahore, Pakistan.
Phone: +92 321 5136276, Fax: +92 42 35954892, email: kashif.munir@ucp.edu.pk, kashif_ok@hotmail.com
†
Research Associate, Department of Economics, University of Central Punjab, Lahore, Pakistan
Abstract
This study analyzed the export performance of Pakistan with its border sharing countries for the year 2014. The study has followed Dalum et al. (1998) revealed symmetric comparative advantage index to measure export performance. The study has split the analysis into highest and marginal comparative advantage and disadvantage. Pakistan is exporting around 160, 155, 133 and 60 commodities at three-digit level of SITC (Rev 3) classification to Afghanistan, China, India and Iran respectively. We found that in more than half of these commodities exported to border sharing countries Pakistan has highest and marginal comparative disadvantage. Result shows that rice and cotton is of worth importance because both are cash crops of Pakistan. Rice is in marginal disadvantage segment for Afghanistan, China and Iran. Political and diplomatic channels are needed to improve the performance of cross border trading among the countries especially with border sharing countries.
1. Introduction
Trading pattern of the world has greatly changed since late 1940, multiple measures have been adopted in the form of gradual decline in trade barriers in order to endure in this world. This trade liberalization among the countries led to foster the world growth. In this era of globalization, bilateral and multilateral trading systems are endorsing the importance of export competitiveness. Earlier, the concept of competition used among industries at domestic level but nowadays it has extended to international level. Trade theories emerge from absolute advantage (Smith, 1776) and comparative advantage (Ricardo, 1817). However, Heckscher-Ohlin-Vanek (1968) presented the two commodity model and explained the comparative advantage of a country on the basis of relative factor endowment. The failure of factor price equalization theorem of HOV was confirmed by Leontief (1954) and known as Leontief paradox. Difference between HOV and Leontief paradox leads to the formation of many other trade models. Linder (1961) suggest that basis of trade among countries is the similar factor endowment rather than different factor endowment as proposed by HOV.
Balassa (1965) developed an index called “Revealed Comparative Advantage” (RCA) to make the phenomenon of comparative advantage simple and authentic. Many researchers have used this index to find the export performance of a country in the world market. To check the difference and variations in the trade pattern of countries over time, sector and regions this index is utilized (Richardson & Zhang, 1999). Batra and Zeba (2005) analyze the export performance of India and China at two and six-digit level of Harmonized System (HS) of classification of commodities being exported to world. They confirmed that over the time there is difference in the comparative advantage of commodities at different segregation level. According to classical, neo-classical and endogenous trade theories, countries should trade those commodities in which they have comparative advantage or in other words, countries should have specialized in those commodities in which they have lower opportunity cost.
These countries have modern technology with large and more developed agricultural and industrial sector as compared to Pakistan. China is the second largest export market of Pakistan. Trade volume with India is not large due to political and military tension between both the countries. However, trade volume of Pakistan with Iran is decreasing from the last few years. During 2012 to 2013, Pak-Iran trade has decreased by approximately 26%. Iran is the huge importer of rice and Pakistan is the huge exporter of rice in the world. In 2013, Iran’s import of rice was $56 billion in which Pakistan’s share was only 0.2%. Iran and Pakistan are the members of ECO but they are not utilizing the benefits of this trade agreement.
The focus of this study is to analyze Pakistan’s export performance with border sharing countries i.e. Afghanistan, China, India, and Iran at three-digit level of Standard International trade code (SITC) (Rev. 3) for the year 2014. This study will analyze the highest and marginal comparative advantage as well as comparative disadvantage of Pakistan’s exports with border sharing countries by using revealed symmetric comparative advantage (RSCA) proposed by Dalum et al. (1998). Earlier studies measure the comparative advantage of Pakistan by using Balassa (1965) index for agricultural commodities and manufacturing products. This study significantly differ from earlier studies on two grounds: firstly, export performance of Pakistan with its border sharing countries are analyzed for all commodities exported to them, and secondly, Delum at al. (1998) method of RSCA is used in order to avoid the problem of asymmetry in Balassa (1965) index. This study will provide suitable policies to increase the export advantage of Pakistan with border sharing countries.
2. Literature Review
Balassa (1977) conducted a study on industrialized economies in order to find the trade pattern by using RCA. Following Balassa (1977), various researchers used this index to compute the comparative advantage among different nations and find the change in trade pattern over time (Jebuni et al., 1988; Yeats, 1998; Richardson & Zhang, 1999; Yue, 2001; Ferto & Hubbard, 2003). Ratkorm (2008), Serin and Civan (2008), Sheng and Song (2008) find the export performance of European countries with their different trading partners by using revealed comparative advantage.
used revealed symmetric comparative advantage (RSCA) and found that in many commodities India has lost comparative advantage with other Asian countries due to economic reforms. Many researchers found the comparative advantage of Pakistan in agricultural and manufacturing sectors. Chaudhry et al. (1994) examined the pattern of specialization in agricultural sector of Pakistan. They found whether Pakistan specialized in one commodity or move towards diversification. They used domestic resource cost (DRC) coefficient for computing comparative advantage in agricultural sector of Pakistan and found that Pakistan has comparative advantage in cotton but it is more suitable for Pakistan to diversify their products to trade internationally. Shahabuddin (2000) worked with domestic resource cost (DRC) coefficient for computing comparative advantage and used it for the agricultural sector of Bangladesh. He also used economic profitability ratio for measuring comparative advantage and found that Bangladesh has comparative advantage in many crops like vegetables, potato, onion and cotton.
Mahmood (2004) found those commodities, for which Pakistan has maintained, lose or gain comparative advantage at world level during the period from 1990 to 2004 by using Balassa index for 978 manufacturing products of Pakistan. The study found that among top twenty-five manufacturing industries twenty industries are labor intensive. Anwar et al. (2005) used nominal protection coefficient (NPC) and effective protection coefficient (EPC) in order to measure policy distortion while domestic resource cost (DRC) ratio was used to measure comparative advantage for wheat in Punjab and Sindh during the period of three years (2001, 2002 and 2003). They found that Pakistan has no comparative advantage in wheat production at world level. Javed et al. (2006) used domestic resource cost (DRC), nominal protection coefficient (NPC) and effective protection coefficient (EPC) to find the comparative advantage of cotton in two provinces of Pakistan i.e. Punjab and Sindh from 1999 to 2003. They found that production of cotton in Sindh has more comparative advantage than Punjab.
Quddus and Mustafa (2011) examined the comparative advantage of four major crops (wheat, rice, sugarcane and cotton) of Pakistan through domestic resource cost (DRC) ratio. The study also computed economic profitability of these four major crops for the period of 1999 to 2005. They found that Punjab has comparative advantage for only domestic production not for export for wheat, while in rice Punjab has comparative advantage for export as well. Riaz and Jensen (2012) analyzed revealed comparative advantage of Pakistan’s major exports related to agricultural sector with different regions and border sharing countries. They found top exports markets for Pakistan’s exports and concluded that agricultural products of Pakistan have competitiveness in many developed countries.
Taneja et al. (2011) worked on comparative advantage of India and Pakistan by incorporating 686 items included in negative list of India. They found that Pakistan has no comparative advantage in majority of the products included in negative list. Ahmad and Kalim (2013) examined the impact of quota-free trade of textile and clothing sector of Pakistan. Their analysis include before liberalization for the period 1972 to 1994 and after quota abolishment for the period 1995 to 2011. They found declining trend of revealed comparative advantage of Pakistan in textile and clothing sector during the year 2011 to 2012. Memon et al. (2014) found the revealed comparative advantage of manufacturing sector for the period of 2003 to 2012 for Pakistan, India and China. They found that many products require attention in order to sustain in global competitiveness.
Previous research in Pakistan focused on export performance of agricultural products by using Balassa index and DRC ratio, while few studies analyzed manufacturing commodities. However, Balassa index suffer from asymmetric problem. This study analyze the export performance of Pakistan with border sharing countries for all commodities exported to them by using revealed symmetric comparative advantage (RSCA) proposed by Dalum et al. (1998).
3. Methodology and Data
(RCA)" to measure the trade specialization as well as comparative advantage. This index shows relative comparative advantage of a country’s export. This index is computes as:
RCAij = (Xij/Xwj)/(Xi/Xw) (3.1)
Where, RCAij is revealed comparative advantage of country i for commodity or sector j, Xij is
exports of a country i for a sector or commodity j, Xwj is total exports of world for commodity or
sector j, Xi is total exports of country I, and Xw is total exports of world.
The value of RCA lies between zero to infinity with one as a break-even point. If the value of RCAij is greater than one, it means that the country i has comparative advantage in export of that
commodity or sector and vice versa. Balassa index of RCA deals with comparative advantage of a product in the world market. RCA index can be converted from world level to regional or bilateral level as well. Modified RCA for a single country as a reference market can be expressed as:
RCACij=(XijC / XCi)/(Xij/Xi) (3.2) Where, RCACij is the revealed comparative advantage for export of commodity or sector j of country i into country C, XijC is the exports of a commodity or sector j of country i to a particular country C, XiC is the total exports of country i to a particular country C, Xij is the total exports of commodity j of country i, and Xi is the total exports of country i.
The value of RCACij lies between zero to infinity with one as a break-even point. If the value of RCAij is greater than one it means that country i has comparative advantage in the export of
commodity j in particular country C. However, on both sides of the break-even point the value of RCA (RCACij) is not comparable because the value of RCA lies between zero to one, and this is due to asymmetry in its values. Dalum et al. (1998) provide a modification of RCA that makes it symmetric and known as revealed symmetric comparative advantage (RSCA). Mathematically,
𝑅𝐶𝐴𝐶𝑖𝑗 is converted into 𝑅𝑆𝐶𝐴𝑖𝑗𝐶 as:
𝑅𝑆𝐶𝐴𝑖𝑗𝐶 = (𝑅𝐶𝐴𝑖𝑗𝐶 – 1)/(𝑅𝐶𝐴𝑖𝑗𝐶 +1) (3.3)
This study uses Dalum et al. (1998) RSCA index in order to compute comparative advantage of Pakistan with its border sharing countries for the year 2014. The data for the commodities exported at three-digit level of Standard International trade code (SITC) (Rev. 3) classification for the year 2014 collected from United Nations Commodity Trade Statistics Database (COMTRADE). Pakistan’s border sharing countries are Afghanistan, China, India and Iran. Pakistan is exporting 160 commodities to Afghanistan, 155 to China, 133 to India and 60 commodities to Iran in the year 2014.
4. Results
We have ranked the commodities according to their comparative advantage into four segments. Commodities whose comparative advantage lies between 0.5 to 1 and -0.5 to -1 are termed as highest comparative advantage and disadvantage respectively. However, commodities whose comparative advantage lies between 0 to 0.4 and 0 to -0.4 are termed as marginal comparative advantage and disadvantage respectively.
4.1Exports Performance with Afghanistan
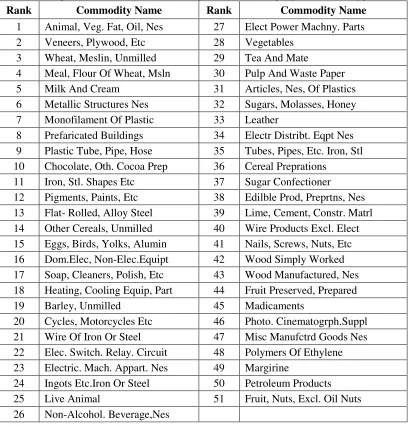
Table 4.1 presents the ranks of commodities based on highest revealed symmetric comparative advantage of Pakistan with Afghanistan. Pakistan is exporting around 160 commodities to Afghanistan in the year 2014. Only 51 out of 160 commodities fall in the highest RSCA segment. Pakistan has strongest comparative advantage in “Animal, vegetable fat and oils” as it has highest rank among the exported commodities to Afghanistan. The rank of wheat and iron is 3 and 11 respectively. The ranks of electric machine, vegetables and Sugars, Molasses, Honey are 23, 28 and 32 respectively. Pakistan is the biggest exporter of leather and leather products and has highest RSCA in leather in Afghanistan. Sugar confectioner, wood manufactured, medicaments, petroleum products and fruits, nuts also have highest RSCA in Afghanistan during the year 2014. The highest relative rank of first five commodities indicates that Pakistan has highest RSCA in food related products like meat, milk, cream and wheat.
Table 4.1: Highest Revealed Symmetric Comparative Advantage of Pakistan in Afghanistan Rank Commodity Name Rank Commodity Name
1 Animal, Veg. Fat, Oil, Nes 27 Elect Power Machny. Parts
2 Veneers, Plywood, Etc 28 Vegetables
3 Wheat, Meslin, Unmilled 29 Tea And Mate
4 Meal, Flour Of Wheat, Msln 30 Pulp And Waste Paper
5 Milk And Cream 31 Articles, Nes, Of Plastics
6 Metallic Structures Nes 32 Sugars, Molasses, Honey
7 Monofilament Of Plastic 33 Leather
8 Prefaricated Buildings 34 Electr Distribt. Eqpt Nes
9 Plastic Tube, Pipe, Hose 35 Tubes, Pipes, Etc. Iron, Stl
10 Chocolate, Oth. Cocoa Prep 36 Cereal Preprations
11 Iron, Stl. Shapes Etc 37 Sugar Confectioner
12 Pigments, Paints, Etc 38 Edilble Prod, Preprtns, Nes
13 Flat- Rolled, Alloy Steel 39 Lime, Cement, Constr. Matrl
14 Other Cereals, Unmilled 40 Wire Products Excl. Elect
15 Eggs, Birds, Yolks, Alumin 41 Nails, Screws, Nuts, Etc
16 Dom.Elec, Non-Elec.Equipt 42 Wood Simply Worked
17 Soap, Cleaners, Polish, Etc 43 Wood Manufactured, Nes
18 Heating, Cooling Equip, Part 44 Fruit Preserved, Prepared
19 Barley, Unmilled 45 Madicaments
20 Cycles, Motorcycles Etc 46 Photo. Cinematogrph.Suppl
21 Wire Of Iron Or Steel 47 Misc Manufctrd Goods Nes
22 Elec. Switch. Relay. Circuit 48 Polymers Of Ethylene
23 Electric. Mach. Appart. Nes 49 Margirine
24 Ingots Etc.Iron Or Steel 50 Petroleum Products
25 Live Animal 51 Fruit, Nuts, Excl. Oil Nuts
26 Non-Alcohol. Beverage,Nes
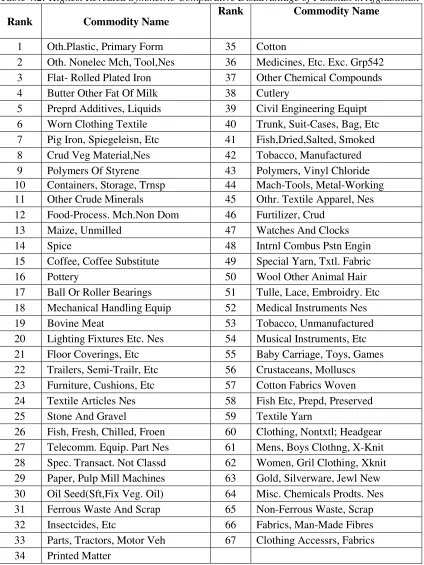
Table 4.2: Highest Revealed Symmetric Comparative Disadvantage of Pakistan in Afghanistan
Rank Commodity Name
Rank Commodity Name
1 Oth.Plastic, Primary Form 35 Cotton
2 Oth. Nonelec Mch, Tool,Nes 36 Medicines, Etc. Exc. Grp542
3 Flat- Rolled Plated Iron 37 Other Chemical Compounds
4 Butter Other Fat Of Milk 38 Cutlery
5 Preprd Additives, Liquids 39 Civil Engineering Equipt
6 Worn Clothing Textile 40 Trunk, Suit-Cases, Bag, Etc
7 Pig Iron, Spiegeleisn, Etc 41 Fish,Dried,Salted, Smoked
8 Crud Veg Material,Nes 42 Tobacco, Manufactured
9 Polymers Of Styrene 43 Polymers, Vinyl Chloride
10 Containers, Storage, Trnsp 44 Mach-Tools, Metal-Working
11 Other Crude Minerals 45 Othr. Textile Apparel, Nes
12 Food-Process. Mch.Non Dom 46 Furtilizer, Crud
13 Maize, Unmilled 47 Watches And Clocks
14 Spice 48 Intrnl Combus Pstn Engin
15 Coffee, Coffee Substitute 49 Special Yarn, Txtl. Fabric
16 Pottery 50 Wool Other Animal Hair
17 Ball Or Roller Bearings 51 Tulle, Lace, Embroidry. Etc
18 Mechanical Handling Equip 52 Medical Instruments Nes
19 Bovine Meat 53 Tobacco, Unmanufactured
20 Lighting Fixtures Etc. Nes 54 Musical Instruments, Etc
21 Floor Coverings, Etc 55 Baby Carriage, Toys, Games
22 Trailers, Semi-Trailr, Etc 56 Crustaceans, Molluscs
23 Furniture, Cushions, Etc 57 Cotton Fabrics Woven
24 Textile Articles Nes 58 Fish Etc, Prepd, Preserved
25 Stone And Gravel 59 Textile Yarn
26 Fish, Fresh, Chilled, Froen 60 Clothing, Nontxtl; Headgear
27 Telecomm. Equip. Part Nes 61 Mens, Boys Clothng, X-Knit
28 Spec. Transact. Not Classd 62 Women, Gril Clothing, Xknit
29 Paper, Pulp Mill Machines 63 Gold, Silverware, Jewl New
30 Oil Seed(Sft,Fix Veg. Oil) 64 Misc. Chemicals Prodts. Nes
31 Ferrous Waste And Scrap 65 Non-Ferrous Waste, Scrap
32 Insectcides, Etc 66 Fabrics, Man-Made Fibres
33 Parts, Tractors, Motor Veh 67 Clothing Accessrs, Fabrics
34 Printed Matter
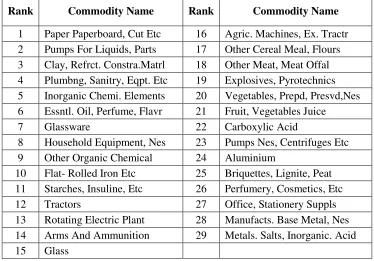
revealed symmetric comparative advantage segment. Paper, paperboard, glassware, tractors, fruit and vegetable juice, aluminium and metals etc. are those commodities that lie in the marginal comparative advantage segment. These commodities also have comparative advantage in Afghanistan but their comparative advantage is smaller as compared to those commodities presented in table 4.1.
Table 4.3: Marginal Revealed Symmetric Comparative Advantage of Pakistan in Afghanistan
Rank Commodity Name Rank Commodity Name
1 Paper Paperboard, Cut Etc 16 Agric. Machines, Ex. Tractr
2 Pumps For Liquids, Parts 17 Other Cereal Meal, Flours
3 Clay, Refrct. Constra.Matrl 18 Other Meat, Meat Offal
4 Plumbng, Sanitry, Eqpt. Etc 19 Explosives, Pyrotechnics
5 Inorganic Chemi. Elements 20 Vegetables, Prepd, Presvd,Nes
6 Essntl. Oil, Perfume, Flavr 21 Fruit, Vegetables Juice
7 Glassware 22 Carboxylic Acid
8 Household Equipment, Nes 23 Pumps Nes, Centrifuges Etc
9 Other Organic Chemical 24 Aluminium
10 Flat- Rolled Iron Etc 25 Briquettes, Lignite, Peat
11 Starches, Insuline, Etc 26 Perfumery, Cosmetics, Etc
12 Tractors 27 Office, Stationery Suppls
13 Rotating Electric Plant 28 Manufacts. Base Metal, Nes
14 Arms And Ammunition 29 Metals. Salts, Inorganic. Acid
15 Glass
Table 4.4: Marginal Revealed Symmetric Comparative Disadvantage of Pakistan in Afghanistan
Rank Commodity Name Rank Commodity Name
1 Mineral Manufactures, 8 Pass. Motor Vehcls. Bus
2 Animal Feed Stuff 9 Footwear
3 Other Man-Made Fibres 10 Nitrogen-Functn Compound
4 Oth. Mach, Pts, Spcl Indust 11 Polyacetal, Polycarbonate
5 Paper And Paperboard 12 Steam Gener. Boilers, Etc
6 Rice 13 Plastic Plate, Sheets, Etc
7 Textile, Leather Machines
4.2Exports Performance with China
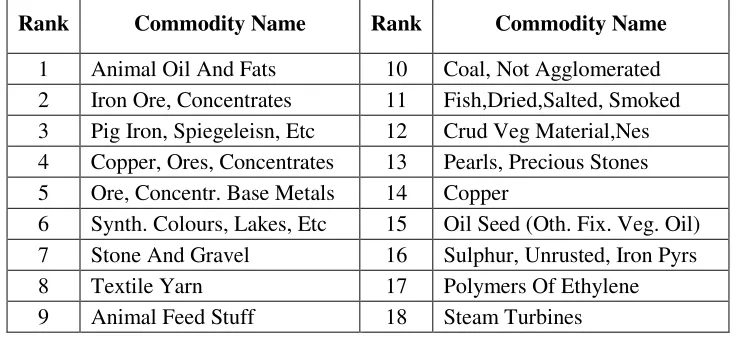
[image:13.612.125.485.89.227.2]Table 4.5 presents the ranks of commodities based on highest revealed symmetric comparative advantage of Pakistan with China. Pakistan is exporting around 156 commodities to China in the year 2014. Pakistan has highest comparative advantage in only 18 commodities out of 156 commodities. Animal oil and fats, textile yarn, animal feed stuff, fish, crud vegetables and oil seeds are only agricultural products in which Pakistan has highest comparative advantage in Chines market. China is the largest exporter of vegetables (Riaz & Jansen, 2012). Pakistan has its market for crude vegetable material in China. As compared to Afghanistan and India, Pakistan has highest comparative advantage in textile yarn in China having 8th rank in the commodity list. Among agricultural products, Pakistan also has highest comparative advantage in copper ores, copper, Sulphur, polymers of ethylene and steam turbines having relative ranking 4, 14, 16, 17 and 18 respectively.
Table 4.5: HighestRevealed Symmetric Comparative Advantage of Pakistan in China
Rank Commodity Name Rank Commodity Name
1 Animal Oil And Fats 10 Coal, Not Agglomerated
2 Iron Ore, Concentrates 11 Fish,Dried,Salted, Smoked
3 Pig Iron, Spiegeleisn, Etc 12 Crud Veg Material,Nes
4 Copper, Ores, Concentrates 13 Pearls, Precious Stones
5 Ore, Concentr. Base Metals 14 Copper
6 Synth. Colours, Lakes, Etc 15 Oil Seed (Oth. Fix. Veg. Oil)
7 Stone And Gravel 16 Sulphur, Unrusted, Iron Pyrs
8 Textile Yarn 17 Polymers Of Ethylene
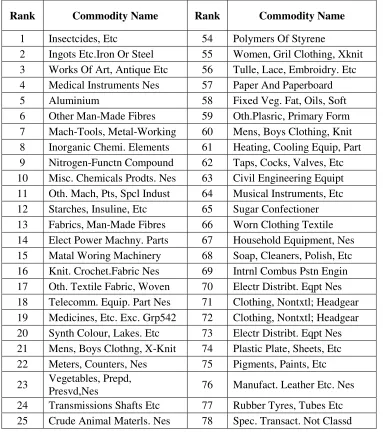
[image:13.612.122.492.522.691.2]Table 4.6 presents the ranks of commodities based on highest revealed symmetric comparative disadvantage of Pakistan with China. The exports of Pakistan consist of around 156 commodities to China in the year 2014. There are large number of commodities in which Pakistan has highest comparative disadvantage in Chines market, 105 commodities out of 156 commodities are in the list of highest comparative disadvantage. The highest disadvantage is for the product “Insecticides” having rank 1st in the list. The other commodities included in this list are related to clothing, different types of instruments, medicines, different types of equipment, food items and machinery and parts. Despite of having strong comparative disadvantage in these commodities, Pakistan is exporting all these commodities in large amount to China.
Table 4.6: HighestRevealed Symmetric Comparative Disadvantage of Pakistan in China
Rank Commodity Name Rank Commodity Name
1 Insectcides, Etc 54 Polymers Of Styrene
2 Ingots Etc.Iron Or Steel 55 Women, Gril Clothing, Xknit
3 Works Of Art, Antique Etc 56 Tulle, Lace, Embroidry. Etc
4 Medical Instruments Nes 57 Paper And Paperboard
5 Aluminium 58 Fixed Veg. Fat, Oils, Soft
6 Other Man-Made Fibres 59 Oth.Plasric, Primary Form
7 Mach-Tools, Metal-Working 60 Mens, Boys Clothing, Knit
8 Inorganic Chemi. Elements 61 Heating, Cooling Equip, Part
9 Nitrogen-Functn Compound 62 Taps, Cocks, Valves, Etc
10 Misc. Chemicals Prodts. Nes 63 Civil Engineering Equipt
11 Oth. Mach, Pts, Spcl Indust 64 Musical Instruments, Etc
12 Starches, Insuline, Etc 65 Sugar Confectioner
13 Fabrics, Man-Made Fibres 66 Worn Clothing Textile
14 Elect Power Machny. Parts 67 Household Equipment, Nes
15 Matal Woring Machinery 68 Soap, Cleaners, Polish, Etc
16 Knit. Crochet.Fabric Nes 69 Intrnl Combus Pstn Engin
17 Oth. Textile Fabric, Woven 70 Electr Distribt. Eqpt Nes
18 Telecomm. Equip. Part Nes 71 Clothing, Nontxtl; Headgear
19 Medicines, Etc. Exc. Grp542 72 Clothing, Nontxtl; Headgear
20 Synth Colour, Lakes. Etc 73 Electr Distribt. Eqpt Nes
21 Mens, Boys Clothng, X-Knit 74 Plastic Plate, Sheets, Etc
22 Meters, Counters, Nes 75 Pigments, Paints, Etc
23 Vegetables, Prepd,
Presvd,Nes 76 Manufact. Leather Etc. Nes
24 Transmissions Shafts Etc 77 Rubber Tyres, Tubes Etc
26 Misc Manufctrd Goods Nes 79 Metal Removal Work Tools
27 Trunk, Suit-Cases, Bag, Etc 80 Electric. Mach. Appart. Nes
28 Containers, Storage, Trnsp 81 Office, Stationery Suppls
29 Othr. Textile Apparel, Nes 82 Fixed Veg. Fat, Oils, Other
30 Articles, Nes, Of Plastics 83 Articles Of Rubber, Nes
31 Measure, Control Instrmnt 84 Parts, For Office Machins
32 Special Yarn, Txtl. Fabric 85 Spice
33 Lighting Fixtures Etc. Nes 86 Footwear
34 Baby Carriage, Toys, Games 87 Other Chemical Compounds
35 Textile Articles Nes 88 Pumps Nes, Centrifuges Etc
36 Steam Gener. Boilers, Etc 89 Perfumery, Cosmetics, Etc
37 Trailers, Semi-Trailr, Etc 90 Polymers, Vinyl Chloride
38 Lime, Cement, Constr. Matrl 91 Transistprs, Valves, Etc.
39 Vegetables 92 Tubes, Pipes, Etc. Iron, Stl
40 Women, Girls Clothing. Knit 93 Sugars, Molasses, Honey
41 Elec. Switch. Relay. Circuit 94 Printing, Bookbinding Machs
42 Edilble Prod, Preprtns, Nes 95 Dom.Elec, Non-Elec.Equipt
43 Textile, Leather Machines 96 Fruit, Vegetables Juice
44 Materials Of Rubber 97 Cereal Preprations
45 Wood Simply Worked 98 Madicaments
46 Metallic Structures Nes 99 Gold, Silverware, Jewl New
47 Clothing Accessrs, Fabrics 100 Petroleum Products
48 Metals. Salts, Inorganic. Acid 101 Aircraft, Assoctd. Equipnt
49 Printed Matter 102 Non-Alcohol. Beverage,Nes
50 Floor Coverings, Etc 103 Paper Paperboard, Cut Etc
51 Pumps For Liquids, Parts 104 Glassware
52 Agric. Machines, Ex. Tractr 105 Parts, Tractors, Motor Veh
[image:15.612.120.496.67.510.2]53 Tools
Table 4.7: MarginalRevealed Symmetric Comparative Advantage of Pakistan in China
Rank Commodity Name Rank Commodity Name
1 Non-Ferrous Waste, Scrap 10 Fish, Fresh, Chilled, Froen
2 Engines, Motors Non- Elect 11 Mineral Manufactures, Nes
3 Residual Petrol. Products 12 Silk
4 Hides, Skins(Ex.Furs), Raw 13 Maize, Unmilled
5 Mechanical Handling Equip 14 Electro-Medcl, Xray Equip
6 Ship, Boat, Structrs 15 Leather
7 Furskins, Tanned, Dressed 16 Cotton Fabrics Woven
8 Crustaceans, Molluscs 17 Non-Elect Mach.Parts, Etc
9 Rotating Electric Plant
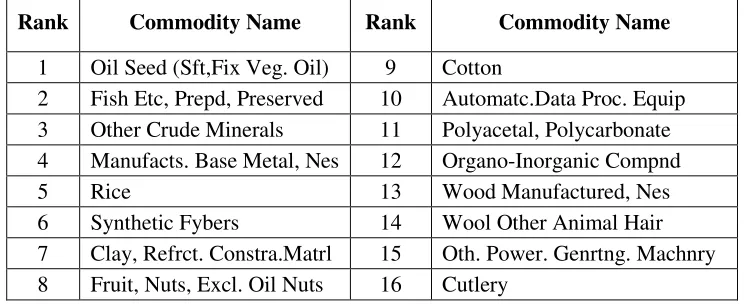
[image:16.612.127.487.89.257.2]Table 4.8 presents the ranks of commodities based on marginal revealed symmetric comparative disadvantage of Pakistan with China. Around 16 out of 156 commodities lie in the marginal revealed symmetric comparative disadvantage segment. Pakistan is a big exporter of rice in Asian countries. But in China, Pakistan has no market for rice. This may be due to difference in preferences of Chines rice consumers. In agricultural products especially cotton Pakistan has marginal comparative disadvantage. By improving these sectors, Pakistan can achieve advantage in these commodities.
Table 4.8: MarginalRevealed Symmetric Comparative Disadvantage of Pakistan in China
Rank Commodity Name Rank Commodity Name
1 Oil Seed (Sft,Fix Veg. Oil) 9 Cotton
2 Fish Etc, Prepd, Preserved 10 Automatc.Data Proc. Equip
3 Other Crude Minerals 11 Polyacetal, Polycarbonate
4 Manufacts. Base Metal, Nes 12 Organo-Inorganic Compnd
5 Rice 13 Wood Manufactured, Nes
6 Synthetic Fybers 14 Wool Other Animal Hair
7 Clay, Refrct. Constra.Matrl 15 Oth. Power. Genrtng. Machnry
8 Fruit, Nuts, Excl. Oil Nuts 16 Cutlery
4.3Exports Performance with India
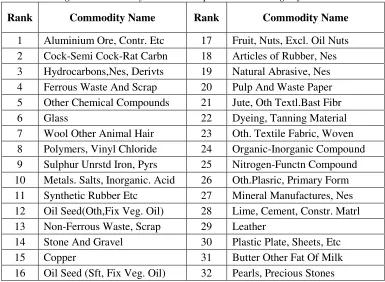
[image:16.612.120.494.448.602.2]export potential in Indian market (Sultan & Munir, 2015). The commodities in which Pakistan has highest RSCA are aluminium ores, hydrocarbons, glass and synthetic rubber as indicated by their relative ranking. The top ten ranked commodities do not have agricultural products. Pakistan has high comparative advantage in chemicals, metals, organic and inorganic compounds, leather and plastic materials in Indian market since 2014. Only few commodities related to agricultural products are included in this segment.
Table 4.9: HighestRevealed Symmetric Comparative Advantage of Pakistan in India
Rank Commodity Name Rank Commodity Name
1 Aluminium Ore, Contr. Etc 17 Fruit, Nuts, Excl. Oil Nuts
2 Cock-Semi Cock-Rat Carbn 18 Articles of Rubber, Nes
3 Hydrocarbons,Nes, Derivts 19 Natural Abrasive, Nes
4 Ferrous Waste And Scrap 20 Pulp And Waste Paper
5 Other Chemical Compounds 21 Jute, Oth Textl.Bast Fibr
6 Glass 22 Dyeing, Tanning Material
7 Wool Other Animal Hair 23 Oth. Textile Fabric, Woven
8 Polymers, Vinyl Chloride 24 Organic-Inorganic Compound
9 Sulphur Unrstd Iron, Pyrs 25 Nitrogen-Functn Compound
10 Metals. Salts, Inorganic. Acid 26 Oth.Plasric, Primary Form
11 Synthetic Rubber Etc 27 Mineral Manufactures, Nes
12 Oil Seed(Oth,Fix Veg. Oil) 28 Lime, Cement, Constr. Matrl
13 Non-Ferrous Waste, Scrap 29 Leather
14 Stone And Gravel 30 Plastic Plate, Sheets, Etc
15 Copper 31 Butter Other Fat Of Milk
16 Oil Seed (Sft, Fix Veg. Oil) 32 Pearls, Precious Stones
Table 4.10: HighestRevealed Symmetric Comparative Disadvantage of Pakistan in India
Rank Commodity Name Rank Commodity Name
1 Alcohol, Phenol, Etc, Deritv 35 Flat- Rolled, Alloy Steel
2 Parts, Tractors, Motor Veh 36 Furniture, Cushions, Etc
3 Works Of Art, Antique Etc 37 Clothing Accessrs, Fabrics
4 Civil Engineering Equipt 38 Oth. Nonelec Mch, Tool,Nes
5 Synthetic Fibber 39 Women, Girls Clothing. Knit
6 Baby Carriage, Toys, Games 40 Cycles, Motorcycles Etc
7 Cutlery 41 Mens, Boys Clothng, X-Knit
8 Agric. Machines, Ex. Tractr 42 Vegetables, Prepd, Presvd,Nes
9 Elec. Switch. Relay. Circuit 43 Trunk, Suit-Cases, Bag, Etc
10 Trailers, Semi-Trailr, Etc 44 Insectcides, Etc
11 Polyacetal, Polycarbonate 45 Textile Articles Nes
12 Medicines, Etc. Exc. Grp542 46 Tea And Mate
13 Polymers Of Styrene 47 Tobacco, Unmanufactured
14 Oth. Mach, Pts, Spcl Indust 48 Mens, Boys Clothing, Knit
15 Nails, Screws, Nuts, Etc 49 Manufact. Leather Etc. Nes
16 Ore Concentr. Base Metals 50 Soap, Cleaners, Polish, Etc
17 Special Yarn, Txtl. Fabric 51 Textile Yarn
18 Floor Coverings, Etc 52 Fabrics, Man-Made Fibres
19 Glassware 53 Aircraft, Assoctd. Equipnt
20 Misc Manufctrd Goods Nes 54 Tubes, Pipes, Etc. Iron, Stl
21 Sugar Confectioner 55 Veneers, Plywood Etc
22 Taps, Cocks, Valves, Etc 56 Paper Paperboard, Cut Etc
23 Pottery 57 Othr. Textile Apparel, Nes
24 Cereal Preprations 58 Sugars, Molasses, Honey
25 Clay, Refrct. Constra.Matrl 59 Other Meat, Meat Offal
26 Clothing, Nontxtl; Headgear 60 Tulle, Lace, Embroidry. Etc
27 Gold, Silverware, Jewl New 61 Starches, Insuline, Etc
28 Animal Feed Stuff 62 Fish, Fresh, Chilled, Froen
29 Footwear 63 Household Equipment, Nes
30 Fruit Preserved, Prepared 64 Metallic Structures Nes
31 Iron Ores, Concentrates 65 Steam Turbines
32 Madicaments 66 Pigments, Paints, Etc
33 Crustaceans, Molluscs 67 Parts, For Office Machins
34 Women, Gril Clothing, Xknit 68 Paper And Paperboard
marginal RSCA segment. Pakistan has highest marginal advantage in synthetic colour, inorganic chemicals, rubber tyres, medical instruments and fruit and vegetable juice having relative ranks 1, 2, 4, 8 and 16 respectively. A deep look on the commodities having highest and marginal comparative advantage, it shows that there are few commodities relating to food and other agricultural products in which Pakistan has RSCA in Indian export market.
Table 4.11: MarginalRevealed Symmetric Comparative Advantage of Pakistan in India
Rank Commodity Name Rank Commodity Name
1 Synth Colour, Lakes. Etc 10 Wood Simply Worked
2 Inorganic Chemi. Elements 11 Crud Veg Material,Nes
3 Containers, Storage, Trnsp 12 Worn Clothing Textile
4 Rubber Tyres, Tubes Etc 13 Spice
5 Furskins, Tanned, Dressed 14 Other Crude Minerals
6 Printed Matter 15 Carboxylic Acid
7 Other Organic Chemical 16 Fruit, Vegetables Juice
8 Medical Instruments Nes 17 Knit. Crochet.Fabric Nes
9 Textile, Leather Machines 18 Petroleum Products
[image:19.612.118.489.517.672.2]Table 4.12 presents the ranks of commodities based on highest revealed symmetric comparative disadvantage of Pakistan with India. Around 15 out of 133 commodities lie in the marginal RSCDA segment. Miscellaneous chemical products, plastic waste, cotton fabric woven, musical instrument and fertilizer are included among those commodities in which Pakistan has marginal comparative disadvantage.
Table 4.12: MarginalRevealed Symmetric Comparative Disadvantage of Pakistan in India
Rank Commodity Name Rank Commodity Name
1 Spec. Transact. Not Classd 9 Manufacts. Base Metal, Nes
2 Tools 10 Cotton Fabrics Woven
3 Ingots Etc.Iron Or Steel 11 Measure, Control Instrmnt
4 Misc. Chemicals Prodts. Nes 12 Musical Instruments, Etc
5 Pumps For Liquids, Parts 13 Furtilizer, Crud
6 Plastic Waste, Scrap Etc 14 Electro-Medcl, Xray Equip
7 Articles, Nes, Of Plastics 15 Edilble Prod, Preprtns, Nes
4.4Exports Performance with Iran
[image:20.612.124.491.265.432.2]Table 4.13 presents the ranks of commodities based on highest revealed symmetric comparative advantage of Pakistan with Iran. Pakistan is exporting around 60 commodities to Iran in the year 2014. Out of 60 only 18 commodities are there in which Pakistan has strongest comparative advantage in Iran. Mostly, the commodities in this sector are related to machinery, equipment and metals. Only “vegetables, preserved & prepared” is the agricultural product in which Pakistan has strong comparative advantage in Iranian market as found by Riaz and Jansen (2012).
Table 4.13: HighestRevealed Symmetric Comparative Advantage of Pakistan in Iran
Rank Commodity Name Rank Commodity Name
1 Paper And Paperboard 10 Textile, Leather Machines
2 Paper, Pulp Mill Machines 11 Essntl. Oil, Perfume, Flavr
3 Ship, Boat, Structrs 12 Heating, Cooling Equip, Part
4 Paper Paperboard, Cut Etc 13 Food-Process. Mch.Non Dom
5 Aluminium 14 Wood Manufactured, Nes
6 Polymers Of Ethylene 15 Electr Distribt. Eqpt Nes
7 Bovine Meat 16 Vegetables, Prepd, Presvd,Nes
8 Oth. Mach, Pts, Spcl Indust 17 Articles, Nes, Of Plastics
9 Plastic Plate, Sheets, Etc 18 Plumbng, Sanitry, Eqpt. Etc
Table 4.14 presents the ranks of commodities based on highest revealed symmetric comparative disadvantage of Pakistan with Iran. The exports of Pakistan consist of around 60 commodities to Iran in the year 2014. There are 26 commodities in this segment. Pakistan has comparative advantage in vegetables and fruit juices, dried fruits/nuts (Riaz & Jansen, 2012). But in 2014 Pakistan has high comparative disadvantage in vegetables and fruit nets. This indicates that Pakistan has no more market in Iran for these commodities. Likewise, Afghanistan, India and China Pakistan has no market for textile yarn in Iran.
Table 4.14: HighestRevealed Symmetric Comparative Disadvantage of Pakistan in Iran
Rank Commodity Name Rank Commodity Name
1 Manufacts. Base Metal, Nes 14 Vegetables
2 Tubes, Pipes, Etc. Iron, Stl 15 Oil Seed(Sft,Fix Veg. Oil) 3 Agric. Machines, Ex. Tractr 16 Fruit, Nuts, Excl. Oil Nuts
4 Worn Clothing Textile 17 Clothing, Nontxtl; Headgear
5 Pearls Precious Ston 18 Non-Ferrous Waste, Scrap
6 Printed Matter 19 Aircraft, Assoctd. Equipnt
7 Furniture, Cushions, Etc 20 Textile Articles Nes
8 Sugar Confectioner 21 Crud Veg Material,Nes
9 Other Crude Minerals 22 Textile Yarn
10 Stone And Gravel 23 Misc Manufctrd Goods Nes
11 Clothing Accessrs, Fabrics 24 Mens, Boys Clothng, Knit
12 Baby Carriage, Toys, Games 25 Spec. Transact. Not Classd
[image:21.612.124.485.356.463.2]13 Cotton Fabrics Woven 26 Mens, Boys Clothng, X-Knit
Table 4.15: Marginal Revealed Symmetric Comparative Advantage of Pakistan in Iran
Rank Commodity Name Rank Commodity Name
1 Intrnl Combus Pstn Engin 6 Civil Engineering Equipt
2 Medical Instruments Nes 7 Other Meat, Meat Offal
3 Preprd Additives, Liquids 8 Fruit, Vegetables Juice
4 Sugars, Molasses, Honey 9 Perfumery, Cosmetics, Etc
[image:21.612.117.499.498.592.2]5 Rice
Table 4.16: Marginal Revealed Symmetric Comparative Disadvantage of Pakistan in Iran
Rank Commodity Name Rank Commodity Name
1 Cereal Preprations 5 Misc. Chemicals Prodts. Nes
2 Cutlery 6 Special Yarn, Txtl. Fabric
3 Madicaments 7 Edilble Prod, Preprtns, Nes
4 Fruit Preserved, Prepared
comparative disadvantage. A slight improvement in these products Pakistan can obtain comparative advantage in these commodities.
5. Conclusion
Pakistan is blessed with abundant natural resources and have diversified export commodities. Despite of rich and generous water resources, agro-ecological conditions for agricultural products and partially developed manufacturing sectors, Pakistan is still unable to utilize its untapped export potential in the world market. From last few years, it is widely believed that the agricultural export performance of Pakistan is declining. Most of the studies are conducted to find the comparative advantage of agricultural products of Pakistan with different export regions and world. Few studies have worked on revealed comparative advantage of Pakistan at regional and bilateral level. Few studies have been conducted by incorporating all commodities that Pakistan is exporting to its border sharing countries. This study has computed the RCA of exports of Pakistan with its border sharing countries at three-digit level of SITC classification by using Delum et al., (1998) index of revealed symmetric comparative advantage.
Pakistan is exporting around 156 commodities to China. China is the largest exporter of vegetables (Riaz & Jansen, 2012). Pakistan has its market for crude vegetable material in China. As compared to Afghanistan and India, Pakistan has highest comparative advantage in textile yarn in China having 8th rank in the commodity list. Pakistan is exporting 156 commodities out of which 105 are those commodities in which Pakistan has highest RSCDA. Pakistan is the biggest exporter of rice in Asian countries. But in China, Pakistan has no market for rice. This may be due to difference in preferences of Chines rice consumers. In agricultural products especially cotton Pakistan has marginal comparative disadvantage.
In case of India, Pakistan is exporting around 133 commodities in the year 2014. Around 68 out of 133 commodities lie in the highest RSCDA segment. Pakistan has highest comparative disadvantage in Indian market in textile articles, textile yarn, clothing appraisal and men and women clothing knit. Pakistan has highest marginal advantage in synthetic colour, inorganic chemicals, rubber tyres, medical instruments and fruit and vegetable juice. There are few commodities relating to food and other agricultural products in which Pakistan has RSCA in Indian export market.
In Iranian market, the agricultural products of Pakistan have no RSCA. Only “vegetables, preserved & prepared” is the agricultural product in which Pakistan has strong comparative advantage in Iranian market. Like Afghanistan, India and China, Pakistan has no market for textile yarn in Iran. In rice Pakistan has marginal comparative advantage in Iranian market. Despite of large producer of cereals, Pakistan has no market for these products in Iran. All these results are consistent with the findings of Riaz and Jansen (2012).
References
Ahmad, N., & Kalim, R. (2013). Changing Revealed Comparative Advantage of Textile and Clothing Sector of Pakistan: Pre and Post Quota Analysis. Pakistan Journal of Commerce and Social Sciences, 7 (3), 520-544.
Anwar, S., Hussain, Z., & Javed, M. S. (2005). Comparative Advantage and Competitiveness of Wheat Crop in Pakistan. The Lahore Journal of Economics, 10 (2), 101-110.
Akhtar, N., Zakir, N., & Ghani, E. (2008). Changing revealed comparative advantage: a case study of footwear industry of Pakistan. The Pakistan Development Review, 7 (4), 695-709.
Balassa, B. (1965). Trade Liberalization and Revealed Comparative Advantage. The Manchester School of Economics and Social Studies, (33), 99-117.
Balassa, B. (1977). Revealed' Comparative Advantage Revisited: An Analysis of Relative Export Shares of the Industrial Countries; 1953-1971. The Manchester School of Economic & Social Studies, 45 (4), 327-44.
Batra, A., & Khan, Z. (2005). Revealed Comparative Advantage: An Analysis for India and China. Indian Council for Research on International Economic Relations Working Paper No. 168.
Chaudhry, M. H., J. Anwar, S. H., & Din, S.S.U. (1994). Interrelationships between wheat yield and its components. J. Agric. Res, 32 (2), 119-126.
Dalum, B., Laursen, K., & Villumsen, G. (1998). Structural change in OECD export specialization patterns: de-specialization and stickiness. Int Rev Appl Econ, 12 (3), 447–467. Ferto, I. & Hubbard, I. J. (2003). Revealed Comparative Advantage and Competitiveness in Hungarian Agri-Food Sectors. World Economy, 26 (2), 247-59.
Ilyas, M., Mukhtar, T., & Javed, M. T. (2009). Competitiveness among Asian exporters in the world rice market. The Pakistan Development Review, 48 (4), 783-794.
Lall, S. (2001). Competitiveness Indices and Developing Countries: An Economic Evaluation of the Global Competitiveness Report. World Development, 29 (9),1501-1525.
Laursen, K. (1998). Revealed Comparative Advantage and the Alternatives as Measures of International Specialization. Danish Research Unit for Industrial Dynamics, Working Paper No. 98-30.
Leontief, W. (1954). Domestic Production and Foreign Trade: The American Capital Position Reexamined. Proceeding of the American Philosophical Society, 97, 332-349.
Linder, S. B. (1961). An Essay on Trade and Transformation. Stockholm: Almqvist & Wicksell.
Mahmood, A. (2004). Export Competitiveness and Comparative Advantage of Pakistan’s Non-agricultural Production Sectors: Trends and Analysis. Pakistan Development Review, 43 (4), 541-561.
Memon, N., Rehman, F., & Rabbi, F. (2014). Should Pakistan Liberalize Trade with India Against the Backdrop of the FTA with China? A Comparative Advantage Analysis for the Manufacturing Sector. The Lahore Journal of Economics, 19, 327-348.
Quddus, M. A., & Mustafa, U. (2011). Comparative advantage of major crops production in Punjab: An application of policy analysis matrix. The Lahore Journal of Economics, 16 (1), 63-94.
Ratkorm, N. (2008). Comparative Advantage of Thailand's export product in Australia During Free Trade Agreement Thailand-Australia.
Ricardo, D (1817). Principles of Political Economy and Taxation, London: John Murray.
Richardson, D. & Zhang, C. (1999). Revealing Comparative Advantage: Chaotic or Coherent Patterns Across Time and Sector and U.S Trading Partner? National Bureau of Economic Research, Working Paper No. 7212.
Riaz, K., & Jansen, H. G. (2012). Spatial patterns of revealed comparative advantage of Pakistan's agricultural exports. Pakistan Economic and Social Review, 50 (2), 97-120.
Shahabuddin, Q. (2000). Assessment of comparative advantage in Bangladesh agriculture. The Bangladesh Development Studies, 26 (1), 37-76.
Sheng, Y., & Song, L. (2008). Comparative Advantage and Australia‐China Bilateral Trade. A journal of applied economics and policy, 27 (1), 41-56.
Shinoj, P., & Mathur, V. C. (2008). Comparative advantage of India in agricultural exports vis-à-vis Asia: a post-reforms analysis. Agricultural Economics Research Review, 21 (1), 60-66.
Smith, A. (1776). An Inquiry into the Nature and Causes of the Wealth of Nations. London: W. Strahan.
Taneja N, Kalita P, Prakash S (2011a) Issues in India-Pakistan trade negotiations. Economic & Political Weekly, 46 (30), 24–28.
Yeats, A. J. (1998). Does Mercosur's trade performance raise concerns about the effects of regional trade arrangements? The World Bank Economic Review, 12 (1), 1-28.
Yue, C. (2001). Comparative Advantage, Exchange Rate and Exports in China. Paper Prepared for the International Conference on Chinese Economy, CERDI, France.