INFLUENCE OF BEHAVIOURAL FACTORS ON INVESTORS DECISION MAKING: A STUDY WITH REFERENCE TO COMMODITY MARKET
Dr.K.CHITRA, Director,
Sri Ramakrishna Engineering College, Coimbatore. T.Jayashree, Assistant Professor,
Bhaktavatsalam Memorial College for Women, Chennai.
Abstract
Extensive review of literature proves that behavioural factors have its impact on decision making of investors. This research paper has categorised the behavioural factors into Allusion, Regretful, Reluctance, Belief, Self Reliance, Risk Aversion, Rational Choice and Constructive. Decision making includes three factors such as Technical analysis, Fundamental analysis and Market psychology. The study is conducted among the investors in commodity market and 171 respondents are identified through convenience sampling. The result evidences that Belief and Rational choice has significant relationship with Technical analysis. The factor such as Allusion, Self Reliance and Risk Aversion has a significant relationship between Fundamental analysis. There is significant relationship between Self Reliance and Market Psychology. The study evidences that the investors are risk averse and rely on past performance. Their experience and knowledge in investment activity helps them to analyze the price variations at regular intervals in commodity market and make rational decision making.
Keywords: Behavioural finance, Commodity Markets, Behavioural Factors, Decision Making 1. INTRODUCTION
India, a commodity based economy where two-third of the one billion population depends on agricultural commodities. Commodities actually offer immense potential to become a separate asset class for market-savvy investors, arbitrageurs and speculators. Commodity market is an important constituent of the financial markets of any country. It is the market where a wide range of products, viz., precious metals, base metals, crude oil, energy and soft commodities like palm oil, coffee etc. are traded. It is important to develop a vibrant, active and liquid commodity market. This would help investors hedge their commodity risk, take speculative positions in commodities and exploit arbitrage opportunities in the market. Commodities are easy to understand as far as fundamentals of demand and supply are concerned. Retail investors should understand the risks and advantages of trading in commodities futures before taking a leap. Historically, pricing in commodities futures has been less volatile compared with equity and bonds, thus providing an efficient portfolio diversification option.
Research in behavioural finance has significant application. A better perceptive of behavioural process and outcomes is important for financial planners because an understanding of how investors generally respond to market movements’ aid investment advisors devise appropriate asset allocation strategies for their clients. By identifying the most influencing factors on investors’ behaviour have effect on companies’ future policies and strategies. It also facilitates government, to impart required legislations and the additional procedures needed in order to satisfy investors’
desires and also to give more support to market efficiency. The research can guide portfolio allocation decisions for investment managers, by understanding the behaviour of investors, how they attains profit and suffer huge losses in making investment decisions. Beyond this understanding the psychological foundation of human behaviour in financial markets facilitates the formulation of macroeconomic policy and the devising of new financial institutions.
1.1. OVERVIEW OF COMMODITY MARKET IN INDIA
Commodity market is a market that trades in primary rather than manufactured products. Soft commodities are agricultural products such as wheat, coffee, cocoa and sugar. Hard commodities are mined, such as gold, rubber and oil. Investors access about 50 major commodity markets worldwide with purely financial transactions increasingly outnumbering physical trades in which goods are delivered. Commodity markets can include physical trading and derivatives trading using spot prices, forwards, futures, and options on futures. Farmers have used a simple form of derivative trading in the commodity market for centuries for price risk management.
Forward Contracts (Regulation) Act was enacted in 1952 and the Forwards Markets Commission (FMC) was established in 1953 under the Ministry of Consumer Affairs and Public Distribution. In due course, several other exchanges were created in the country to trade in diverse commodities.
Chart 1.1 Percentage share of major group of Commodity traded during 2013-14
Based on the report of FMC, the volume and value of Commodity markets for the year 2013 -14 shows 8832.76 lakh tonne and Rs10144793.98 Crore. There are almost 113 commodities being regulated under section 15 of the Forward Commission Regulation Act 1952 (Annexure I) with 6 National Exchanges and 11 Commodity Specific Regional Exchanges (Annexure II). With the introduction of futures trading, the size of the commodities market grows many folds. The chart above shows the major commodities traded during the year. Bullion includes Gold and Silver. Metals other than bullion include Aluminium, copper, lead, nickel, steel, zinc, iron. Agricultural commodities includes channa/gram, wheat, maize, soya oil, menthe oil, guar seed, guar gum, potato, chillies, jeera, cardamom, pepper, rubber and other agriculture products.
Bullion 43% Energy 24% Agri commodities 16%
Metals other than bullion 17%
Bullion Energy
Agricultural commodities Metals other than bullion
The commodities market exits in two distinct forms namely the Over the Counter (OTC) market and the Exchange based market. Also, as in equities, there exist the spot and the derivatives segment. The spot markets are essentially over the counter markets and the participation is restricted to people who are involved with that commodity say the farmer, processor, wholesaler etc. Derivative trading takes place through exchange-based markets with standardized contracts, settlements etc. In India, the exchanges offer a nation-wide anonymous, order driven, screen based trading system for trading. The Forward Markets Commission (FMC) regulates these exchanges. Consequently six commodity exchanges have been approved to commence business in this regard. Multi Commodity Exchange (MCX) located at Mumbai, National Commodity and Derivatives Exchange Ltd (NCDEX) located at Mumbai, National Multi Commodity Exchange (NMCE) located at Ahmadabad, Indian Commodity Exchange Ltd, Mumbai (ICEX), ACE Derivatives and Commodity exchange, Mumbai, Universal Commodity Exchange Ltd, Navi Mumbai were the National Multi Commodity Exchanges operated in India. Some of the leading exchanges of the world are New York Mercantile Exchange (NYMEX), the London Metal Exchange (LME) and the Chicago Board of Trade (CBOT).
2. REVIEW OF LITERATURE
(Kahneman, 1974)Behavioural finance emphasizes three heuristics styles, such as representativeness, availability and adjustment and anchoring biases is employed in numerical predictions to assess probabilities and to predict values. (Dennis Dittrich, 2001)Overconfidence in investment behaviour and participants’ decisions are contrasted with the optimal investment solution, with a risk averse and risk loving investment decision. (Chun, 2007) The study identifies four common investor behaviours i.e. overconfidence, loss aversion, representativeness and price anchoring. The results indicate that representativeness and price anchoring to be important contributory factors to the decision making process. Overconfidence seems to influence Malaysian market investors. (Inga Chira, 2008) It analyzes excessive optimism and overconfidence, loss aversion, illusion of control and confirmation biases, the influence of sunk cost on the decision making process, and the concept of familiarity. (Carmen Lee, 2008) This study integrates prospect theory, reference point adaptation and cognitive-experiential self-theory to provide more insight on such investor’s capitulation based on which a dynamic model of investor behaviour is adopted. (Skata, 2008) Overconfidence may affect not only a company’s internal financing structure, but also its interactions with other market participants through merger and acquisition activity. (Luong, 2011) The study reveals the behavioural factors influencing the decisions of individual investors at the Ho Chi Minh Stock Exchange. The factors Heuristics, Prospect, Herd and Market have impact on their investment performance. The research is designed to evaluate the investors’ performance based on the criteria that the investment return rate and level of investment satisfaction. (Ebenezer Bennet, 2011) This paper aims at identifying the factors influencing the retail investors’ attitude. The average value of the five highly influential factors according to the sample retail investors were investor’s tolerances for risk, strength of the Indian economy, media focus on the stock market, political stability and finally government policy towards business. Stories of successful investors, get rich quickly philosophy, information available on internet, cost cutting by companies are four least influencing factors while investing in stocks.
(Kumar) Considering the theory of irrationality of individual investors and contextual factors that affect individual investor behaviour. Five psychological axes as prudence and precautious attitude, conservatism, under confidence, informational asymmetry and financial addiction appear driving the Indian individual investor behaviour. (Chin, 2012) The study determines how psychology affects investors’ decision making. Four Psychological biases such as belief, self-confidence, regret and snake-bite effect and their impact on decision making are identified. Investors are found to rely on
beliefs in making decisions. (Schubler, 2012) analyzes whether socio demographic attributes experience, education and income affect behaviour. The study shows that systematic mistakes are prevalent among German investors and they act according to the Self-Attribution Bias and the Endowment Effect. Representativeness and Herd Behaviour is also prevalent among tested characteristics, predicts investor behaviour.
(Salman Ali Quershi, 2012) The study is an attempt to investigate the effect of behavioural factors such as heuristics, risk aversion, use of financial tools and firm level corporate governance on the decision making of equity fund managers of Pakistan. The results of the study demonstrate that a positive and significant relationship exist among heuristics, use of financial tools, risk aversion, firm-level corporate governance, and investment decision making. (Suresh.A.S, 2013) The unique nature of capital market instruments forces investors to depend strongly on fundamental factors in their investment decisions. Fundamental analysis examines the economic environment, industry performance and company performance before making an investment decision. (Arvid O.I.Hoffman)The study aims to gain a better understanding of individual investors’ decision-making and their investment performance. This paper analyzes how systematic differences in investors’ investment objective and strategies impact the portfolios they select and the returns they earn and the investors who rely on fundamental analysis have higher aspirations and turnover, take more risks, are more overconfident, and outperform investors who rely on technical analysis. (Hayat.M.Awan) The impact of investment behaviour on investment decisions is identified in the study. The results shows that a significant relationship between the investor behaviour and decision making process. The behavioural dimensions of individual involvement and overconfidence are significantly related to market sentiments. The behavioural trait of involvement is most significantly related to technical analysis. The behavioural dimensions of risk attitude and overconfidence are significantly associated with fundamental analysis.
2.1. OBJECTIVE OF THE STUDY The main objectives of the study are
To understand the behavioural factors influencing investors in commodity market To analyse the influence of behavioural factors on investors decision making
3. RESEARCH METHODOLOGY
The exploratory study was undertaken to examine the behaviour of commodity market investors. A questionnaire was designed and distributed to individual commodity investors. The study focused on investors who specifically trade commodity with intra and inter day transactions. The data are collected from 171 investors based on convenient sampling. The target respondents were from different financial broking institutions like India Info line Ltd, Share khan Ltd, Karvy Securities, Kotak Securities, etc. The questionnaire consists of four sections. The first section pertains to the respondent’s Demographic characteristics. The second section consists of 8 dimensions with 45 variables capturing the investor’s opinion or experiences that reflect their behaviour. Third section consists of 3 dimensions with 14 variables identifying the investors’ decision making in trading activity. Fourth section examines the impact of investors’ behaviour influencing on decision making. The data are collected by distributing the forms personally through financial broking services and individual investors. Descriptive analysis, Factor analysis and Multiple Linear Regression are the statistical tools used for analysis.
HYPOTHESIS DEVELOPMENT
Based on the objectives framed, the following hypothesis is developed to investigate how each behavioural factor affect decision making of investors.
H1: There is no significant relationship between Behavioural factors and Technical Analysis H2: There is no significant relationship between Behavioural factors and Fundamental Analysis H3: There is no significant relationship between Behavioural Factors and Market Psychology
4. ANALYSIS AND INTERPRETATION The findings are grouped and presented under various headings; DESCRIPTIVE STATISTICS
Table 4.1 Profile of the Respondents Demographic Factors No of Respondents Percentage Demographic Factors No of Respondents Percentage
Gender Marital status
Male 158 92 Single 82 48 Female 13 8 Married 89 52 Age Occupation 18-25 19 11 Self employed 20 12 26-35 54 32 Private 128 75 36-45 47 27 Govt 21 12 46-55 29 17 Retired 2 1
Above 56 22 13 Annual Income
Education Less than Rs2 lakh 22 13
High School 3 2 Rs2-5 lakh 52 30
UG 59 35 Rs5-10 lakh 56 33
PG 81 47 Above Rs10 lakh 41 24
Post PG 28 16
(Source: Primary Data)
Table 4.1. reveals that majority (92%) of the respondents are Male. 32% of commodity investors belong to the age group of 26-35 years. 52% of the respondents are Married. Most (47%) have completed their Post-Graduation. 33% of the respondents earn Rs2 lakh to 5 lakh annually. 75% of the respondents are employed in Private organization.
FACTORS INFLUENCING INVESTOR BEHAVIOUR
To assess the reliability of the constructs developed, the Cronbach alpha coefficients for 45 questions were calculated. The Cronbach alpha is the most widely used index for determining
internal consistency (Kerlinger 1986). It has been accepted that hypothesized measure of construct, reliabilities of 0.50 or higher are required.
Table 4.2. Reliability analysis on Investor Behaviour
Cronbach's Alpha No of Items
0.821 45
(Source : Primary Data)
The table 4.2 depicts, the Cronbach alpha value (0.821) confirms the homogeneity of the items comprising them, and indicates acceptable level of reliability. With an objective to determine the suitability of data for factor analysis, Kaiser Meyer Oklin Measure of Sampling adequacy and Bartlett Test of Sphericity were applied. KMO measure of Adequacy is a statistic that indicates the proportion of variance that might be caused by factors. Bartlett Test measures the significance level among variables.
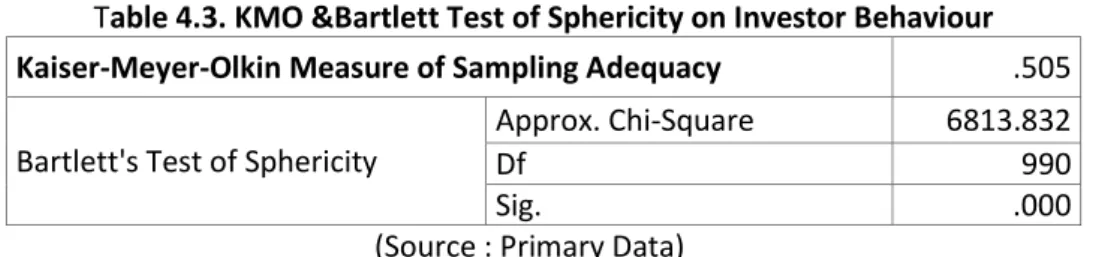
Table 4.3. KMO &Bartlett Test of Sphericity on Investor Behaviour Kaiser-Meyer-Olkin Measure of Sampling Adequacy .505 Bartlett's Test of Sphericity
Approx. Chi-Square 6813.832
Df 990
Sig. .000
(Source : Primary Data)
The above table 4.3 shows the KMO and Bartlett Test of Sphericity of Investor Behaviour. KMO of Investor Behaviour with 0.546 provides an evidence for sampling adequacy for the study. The significant value for Bartlett Test of Sphericity is 0.000 which indicates that there exists significant relationship among variables.
Factor analysis is performed to reduce the variables into few factors. The response collected on the five points scale is subjected to factor analysis and the results are shown below;
Table 4.3 Factor Analysis on Investors Behaviour
Behavioural Dimensions Factor Loading
Constructive
I rarely modify my traded commodity given by the analyst or advisors 0.802 I concentrate on constructing my commodities without looking at the market
trend
0.757 I often segregate my assets into safe commodities without looking the market
trend
0.606 I categorize my income to various investments and savings into trading activity 0.425 While taking decision, I consider about the personal characteristics, norms,
habits etc.
0.355 Risk Aversion
My failures are often based on the result of unfavourable circumstances. 0.802 When I make decisions I keep my past loss in mind 0.722 I will not increase my trading activity when the market performance is poor 0.718
Loss of capital is more important than returns 0.632
I feel nervous when price drops in my commodity 0.612
The pain of financial loss is 2 times stronger than the pleasure of financial gain 0.504 Belief
My future predictions may go wrong due to decline in the market 0.796 When making decisions, I tend to focus only on the positive aspects 0.788
I ignore negative information once after my decision making 0.769 I listen to the advice of my family/friends for taking decisions 0.678 I usually seek information to confirm my right decisions during recession 0.608 My decisions are based on other investors decision 0.584 My instinct has often helped me make good trading activity 0.411 Self Reliance
I make predictions based on the knowledge of the past information 0.751 I am confident that my knowledge about trading is above average 0.708
I only invest in the familiar commodity 0.701
Gains in my trading must be attributed to my competence 0.603 I believe the returns are higher for commodity that I am familiar with 0.597 I have more control over my outcome of trading activity 0.584 Loss happened in my trading decisions are prior to my knowledge 0.484 Reluctant
I am more comfortable by taking no action during the market changes 0.731 Presently I am not ready to make any new changes in my commodities 0.661 Even though the market is beneficial, I am not ready to change my trading
activity
0.547 I rarely make changes in my commodity trading once decided 0.506 While I consider to change my commodity, I analyze varied opinions but often
end up without much change
0.238 Rational Choice
I trust more on the advice from nationally advertised firms than from smaller local firms
0.717 I choose my own decision even though its future earnings growth is going to be
moderate
0.701 While reflecting on past mistakes, I understand that it can be easily avoided 0.687
I take much care while doing excessive trading 0.433
I have a better outcome if I make my own choice 0.396
Allusion
I avoid investing in commodity with a history of poor earnings 0.679 I compare the current commodity prices with recent high and low prices to
justify my choice
0.612 I rely on past performance to buy commodity as it performs well 0.500 When I make decisions, I see my profits during my past experience 0.485 When thinking about buying and selling, the price I paid is a big factor 0.483 I am unlikely to buy a commodity if it was more expensive than last year 0.357 I am likely to sell my commodity after the price hits recent one year high 0.273 Regretful
I should buy the commodity earlier at the lower price because now its price has risen
0.617 I should sell the commodity earlier at a higher price before the price drops over
the buying price
0.530 I should hold the commodity longer because now the price has increased over
my selling price
0.332 (Source : Primary Data)
From the above table it can be seen that the Investors Behavioural factors with 45 variables is grouped into 8 dimensions which include Risk Aversion, Belief, Constructive, Rational Choice, Allusion, Regretful, Reluctance and Self Reliance based on their respective factor loadings.
Constructive dimension is divided into 5 variables shows that investors rarely modify traded commodity given by the analyst or advisors (0.802), they concentrate on constructing the commodity without looking at the market trend (0.757), they often segregate assets into safe commodity without looking at the market trend (0.606), they categorise income to various investments and savings into trading of commodity (0.425), they consider personal characteristics, norms, habits etc (0.355).
Risk Aversion dimension with 6 variables includes investors failure are often based on the result of unfavourable circumstances (0.802), they keep past loss in mind (0.722), they will not increase the trading activity when market performance is poor (0.718), loss of capital is more important than returns (0.632), feel nervous when price drops in their commodity (0.612), pain of financial loss is two times stronger than the pleasure of financial gain (0.504).
Belief with 7 variables shows that investors future predictions may go wrong due to decline in the market (0.796), tend to focus on positive aspects (0.788), ignore negative information once after their decision making (0.769), listen to advice of their family/friends (0.678), seek information to confirm right decision during recession (0.608), decisions are based on other investors decision (0.584), instinct often helped to make good trading activity (0.411).
Self Reliance with 7 variables includes investors predictions based on the knowledge of the past information (0.751), confident that their knowledge about trading is above average (0.708), invest in familiar commodity (0.701), gains in trading attributed to their competence (0.603), believe the returns are higher for commodity that they are familiar with(0.597), have more control over their outcome of trading activity(0.584), loss happened in their trading decisions are prior to their knowledge(0.484).
Reluctance with 5 variables includes investors are more comfortable by taking no action during the market changes (0.731), not ready to make any new changes in their commodity (0.661), even though the market is beneficial, not ready to change any commodity (0.547), rarely make changes in commodity traded once decided (0.506), while considering to change their commodity, analyze varied opinions but often end up without much change (0.238).
Rational choice with 5 variables includes investors trust more on advice from nationally advertised firms than smaller firms (0.717), choose their own decision even though its future earnings growth is going to be moderate (0.701), while reflecting on past mistakes, it can be easily avoided (0.687), take much care doing excessive trading (0.433), have a better outcome if they make their own choice (0.396).
Allusion with 7 variables includes investors avoid investing in commodity with history of poor earnings (0.679), compare the current commodity prices with recent high and low prices(0.612), rely on past performance to buy commodity as it performs well(0.500), see profits during their past experience(0.485), price paid is a big factor(0.483), investor are unlikely to buy commodity if it was more expensive than last year (0.357), likely to sell their commodity after the price hits recent one year high (0.273).
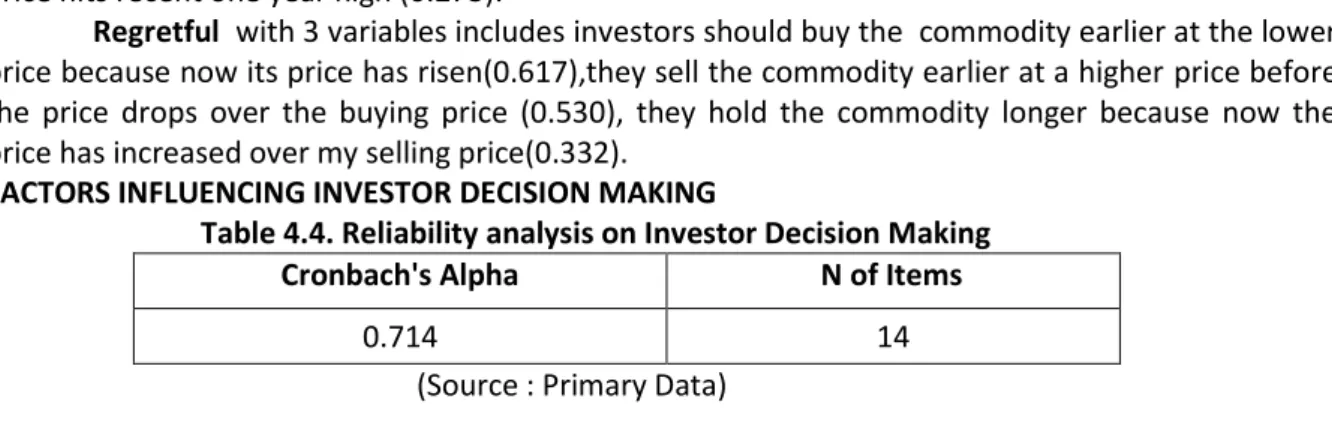
Regretful with 3 variables includes investors should buy the commodity earlier at the lower price because now its price has risen(0.617),they sell the commodity earlier at a higher price before the price drops over the buying price (0.530), they hold the commodity longer because now the price has increased over my selling price(0.332).
FACTORS INFLUENCING INVESTOR DECISION MAKING
Table 4.4. Reliability analysis on Investor Decision Making
Cronbach's Alpha N of Items
0.714 14
In the current survey, the table 4.4 shows Cronbach alpha value on Investor decision making is 0.714 that confirms the homogeneity of the items comprising them, and indicates acceptable level of reliability.
Table 4.5. KMO &Bartlett Test of Sphericity on Investor Decision Making
Kaiser-Meyer-Olkin Measure of Sampling Adequacy .588 Bartlett's Test of Sphericity Approx. Chi-Square 742.427
Df 91
Sig. .000
(Source : Primary Data)
The above table shows the KMO and Bartlett Test of Sphericity of Investor Decision making. KMO of Behavioural Bias with 0.588 provides an evidence for sampling adequacy for the study. The significant value for Bartlett Test of Sphericity is 0.000 which indicates that there exists significant relationship among variables.
Factor analysis is performed to reduce the variables into few factors influencing the Investor Decision Making. The response on Technical analysis, Fundamental analysis and Market Psychology is received on a five point scale and subjected to factor analysis. Results are shown below.
Table 4.6 Factor Analysis of Investor Decision Making
Dimensions Factor Loading
Technical Analysis
I use past price movements to predict future price 0.802
I do active trading volume/turnover 0.782
I use charts, patterns and trends 0.627
I watch daily price fluctuation 0.519
Fundamental Analysis
I follow the reports compiled by MCX/NCDEX 0.728
I compare current data with previous year price trend 0.724 I watch political, economic and weather news which play a crucial role
in commodity market
0.703
I use inventory data 0.625
I depend on Government regulations 0.581
I usually depend upon demand and supply condition 0.579 Market Psychology
I follow the recommendations of my professional investor/broker 0.752 In accordance with the news stories in the media 0.702
Based on rumours in the market 0.689
I go along with the recommendations of my friends/family 0.665 (Source : Primary Data)
From the above table, Investors decision making are grouped into 3 dimensions with 14 variables. It includes Technical analysis, Fundamental analysis and Market psychology with factor loadings. Technical analysis with 4 variables includes investors use past price movements to predict future price(0.802), investors do active trading volume/turnover(0.782), use charts, patterns and trends (0.627), watch daily price fluctuation (0.519).
Fundamental analysis with 6 variables includes investors follow reports compiled MCX/NCDEX (0.728), compare current data with previous year price trend (0.724), watch political, economic and weather news that play crucial role in commodity market (0.703), use inventory data(0.625), depend on Government regulations(0.581), depend upon demand and supply condition(0.579).
Market Psychology with 4 variables includes investors follow recommendations of professional investors/brokers (0.752), they follow new stories in the media (0.702), based on rumours in the market (0.689), go along with recommendations of my friends/family (0.665).
INFLUENCE OF BEHAVIORIAL FACTORS ON INVESTORS DECISION MAKING
Regression analysis is a statistical process for estimating the relationship between a dependent variable and one or more independent variables. In the study, to understand the influence of Behavioural factors on the Investors Decision Making, the Regression analysis is performed. Decision making is further grouped into three categories viz Technical, fundamental and Market Psychology. For this purpose the following hypothesis is framed.
H1: Behavioural factors does not have a significant influence on the investors decision making based on Technical analysis
The above hypothesis is subjected to regression analysis and the result is presented below; Table 4.7 Regression Analysis showing the influence of behavioural factors on Technical Analysis
Model R R Square Adjusted R Square Std Error of Estimate 0.809 0.654 0.587 1.36058
Model Unstandardized Coefficients
Standardized Coefficients T Sig. B Std. Error Beta (Constant) -4.619 2.018 -2.289 0.027 Allusion 0.008 0.086 0.011 0.095 0.925 Regretful 0.113 0.194 0.073 0.584 0.562 Reluctant 0.225 0.130 0.227 1.725 0.092 Belief 0.217 0.061 0.410 3.547 0.001 Self Reliance 0.096 0.072 0.156 1.337 0.188 Risk Aversion -0.104 0.113 -0.132 -0.923 0.361 Rational Choice 0.287 0.124 0.302 2.316 0.026 Constructive 0.151 0.108 0.165 1.396 0.170
The above table depicts the Regression model that identifies eight broad dimensions of investor behaviour, which is most closely related and has impact on the investment decision based on Technical analysis. The model revealed that the behavioural factors such as Belief and Rational choice are significantly associated with the investment decision making process as the p values are 0.001 and 0.026 are less than the alpha value(0.05). The null hypothesis is rejected. Behavioural factors which show P value as Allusion (0.925), Regretful (0.562), Reluctant (0.092), Self reliance (0.188), Risk aversion (0.361) and Constructive (0.170) are not statistically significant. The values of R square and adjusted R square states that investor behaviour cast an impact of 58 to 65 percent on the investment decision making process based on Technical analysis.
H2: Behavioural factors does not have a significant influence on the investors decision making based on Fundamental analysis
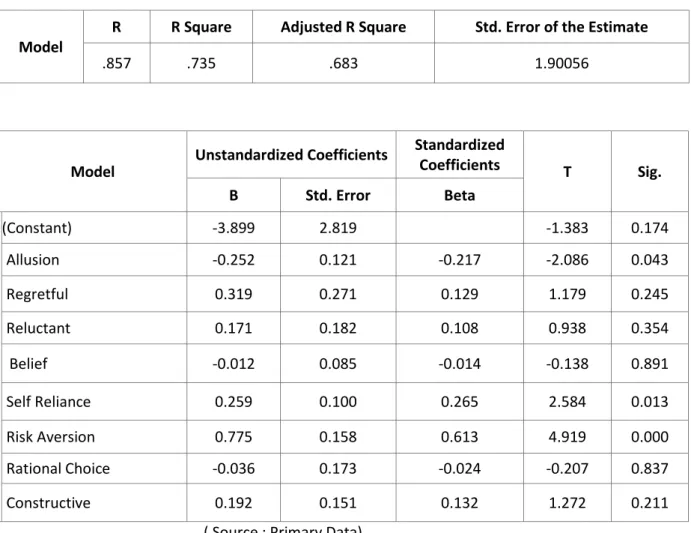
Table 4.8 Regression Analysis showing the influence of behavioural factors on Fundamental analysis
Model
R R Square Adjusted R Square Std. Error of the Estimate
.857 .735 .683 1.90056
Model Unstandardized Coefficients
Standardized Coefficients T Sig. B Std. Error Beta (Constant) -3.899 2.819 -1.383 0.174 Allusion -0.252 0.121 -0.217 -2.086 0.043 Regretful 0.319 0.271 0.129 1.179 0.245 Reluctant 0.171 0.182 0.108 0.938 0.354 Belief -0.012 0.085 -0.014 -0.138 0.891 Self Reliance 0.259 0.100 0.265 2.584 0.013 Risk Aversion 0.775 0.158 0.613 4.919 0.000 Rational Choice -0.036 0.173 -0.024 -0.207 0.837 Constructive 0.192 0.151 0.132 1.272 0.211
( Source : Primary Data)
The above table 4.8 depicts the Regression model that identifies eight broad dimensions of investor behaviour, which is most closely related and has impact on the investment decision based on Fundamental analysis. The model revealed that the behavioural factors such as Allusion, Self Reliance and Risk Aversion are significantly associated with the investment decision making process as the p values are 0.043, 0.013 and 0.000 are less than the alpha value(0.05). The null hypothesis is rejected. Behavioural factors such as Regretful (0.245), Reluctant (0.354), Belief (0,891), Rational choice (0.837) and Constructive (0.211) are not statistically significant. The values of R square and
adjusted R square states that investor behaviour cast an impact of 68 to 73 percent on the investment decision making process based on Fundamental analysis.
H3: Behavioural factors does not have a significant influence on the investors decision making based on Market Psychology
Table 4.9 Regression analysis showing the influence of behavioural factors on Market psychology
Model R R Square Adjusted R Square Std. Error of the Estimate
.734 .539 .449 1.68696
Model Unstandardized Coefficients
Standardized Coefficients T Sig. B Std. Error Beta (Constant) -2.089 2.502 -0.835 0.409 Allusion -0.159 0.107 -0.203 -1.480 0.147 Regretful 0.298 0.240 0.178 1.238 0.223 Reluctant 0.178 0.161 0.167 1.101 0.277 Belief 0.036 0.076 0.063 0.473 0.639 Self Reliance 0.307 0.089 0.467 3.459 0.001 Risk Aversion -0.070 0.140 -0.082 -0.501 0.619 Rational Choice 0.225 0.154 0.220 1.465 0.151 Constructive 0.153 0.134 0.156 1.142 0.260
(Source : Primary Data)
The above table 4.7 depicts the Regression model that identifies eight broad dimensions of investor behaviour, which is most closely related and has impact on the investment decision based on Market Psychology. The model revealed that Self Reliance has significantly associated with the investment decision making process as the p value is 0.001 are less than the alpha value (0.05). The null hypothesis is rejected. Behavioural factors with P value shows Allusion (0.147), Regretful (0.223), Reluctant (0.277), Belief (0.639), Risk Aversion (0.619), Rational choice (0.151) and Constructive (0.260) are not statistically significant. The values of R square and adjusted R square states that investor behaviour cast an impact of 44 to 53 percent on the investment decision making process based on Market Psychology.
5. SUGGESTIONS AND CONCLUSION
The evidence documented in this study shows that behavioural factors influence on the investors’ decision making. The result shows that the independent variables such as Belief and Rational Choice have a significant relationship with Technical analysis in decision making. It is understood that investors focus on positive aspects of an investment and their future predictions may go wrong due to decline in the market. Their instinct often helped to make good investment. Investors opt for wait and sell approach and they rarely change their investment decision even though the market is beneficial. Investors trust more on the advice from nationally advertised firms than from smaller
local firms. They take much care while doing excessive trading and make their own investment choice and use chart patterns and watch daily price fluctuations.
There is significant relationship between factors such as Belief, Self Reliance and Risk Aversion with Fundamental analysis, which shows that the investors’ decisions are based on company announcements and they compare current data with previous year price trend and avoid investing in companies with history of poor earnings. They compare the current commodity prices with recent high and low prices to justify their choice and make predictions based on the knowledge of past information.
There is a significant relationship between Self Reliance and Market Psychology which shows that investors follow the recommendations of professional investors and they believe the returns are higher for the shares they are familiar with. The present study concludes the evidences that behavioural factors have an impact on the investors’ decision making and future studies can be incorporated on a large sample size of investors to identify the various factors influencing investors’ decision making.
REFERENCES
Amos Tversky, D. K. (2002). The Framing of Decisions and the Pscyholgy of choice. JSTOR . Bondt, W. F. (1998). A portrait of the individual investor. European Economic Review, 42,
831-844.
Carmen Lee, R. K. (2008). How Adaptation to Losses affects Future selling decisions. Association for Consumer Research Annual North American Conference. San Francisco. Chin, A. L. (2012). Psycholgical Biases and Investor Behavior: Survey Evidence from
Malaysian Stock Market. International Journal on Social Science Economics and Art, 2 (2). Chun, D. L. (2007). Investor Behavior and Decision making Style:A Malaysian Perspective.
IBBM .
Dennis Dittrich, W. G. (2001). Overconfidence in Investment Decisions - An Experimental approach.
Ebenezer Bennet, G. I. (2011). Factors influencing Retail Investors' Attitude towards Investing in Equity stocks: A study in Tamil Nadu. Journal of modern accounting and auditing, 7 (3), 316-321.
Gaurav Kabra, P. K. (2010). Factors influencing Investment decision of Generations in India. Asian Journal of Management Research .
Hayat.M.Awan, K. B. Understanding Investment Behavior of individual investors:How they handle investment decisions? Do they act rationally?
Inga Chira, M. A. (2008). Behavioral Bias Within the Decision Making process. Journal of Business and Economic Research, 6 (8).
Kahneman, A. T. (1974). Judgment under uncertainty:Heurisitcs and Biases. JSTOR, 185 (4157), 1124-1131.
Kumar, A. C. Determinants of Individual investor Behavior: An Orthogonal Linear Transformation Approach.
Luong, D. T. (2011). Behavioral factors influencing individual investors decision making and performance - A survey at the Ho Chi Minh Stock Exchange.
Lubna Riaz, A. I.-i.-A. (2012). Impact of Psychological factors on Investment decision making mediating by risk perception: A conceptual study. Middle-East Journal of Scientific Research, 12 (6).
M.Pompian, M. (1963). Behavioral Finance and Wealth Management.
R.Ritter, J. (2003). Behavioral Finance. Pacific-Basin Finance Journal, 11 (4), 429-437.
Salman Ali Quershi, K. u. (2012). Factors affecting Investment Decision making of Equity fund managers. Wulfenia Journal, Austria, 19 (10).
Dr.M.Selvam, E. E. (2011). Investos' Attitude on Stock selection decision. International Journal of Management And Business Studies, 1 (2).
Shafi, D. M. (2014). Determining influencing individual investor behavior in stock market: A cross country research survey. Arbian Journal of Business and Management Review, 2 (1).
Schubler, T. N. (2012). Investment decisions and Socio demographic characteristics - Empirical evidence from Germany. International Journal of EConomics and Finance, 4 (9). Shyan-Rong Chou, G.-L. H.-L. (2010). Investor Attitudes and Behavior towards Inherent Risk
and Potential Returns in Financial Products. International Research Journal of Finance and Economics, 44.
Suresh.A.S. (2013). A study on Fundamental and Technical analysis. International Journal of Marketing, Financial Services and Management Research, 2 (5).